Dear Siloites, the 31st United Nations climate conference (COP31) kicked off this week with accusations of rapid deforestation by Turkey’s military. Our analysis cuts through the noise. Yours, Luis Beyerbach and Marcus Pfeil.
Accusations of environmental harm against Turkish Armed Forces resurface as the country hosts COP31
Hundreds of hectares of forests in Kurdish districts of Northern Iraq have been cleared to build Turkish military outposts. Vertical52 has analysed multiple sites to reconstruct the deforestation.
Google Earth satellite image showing a freshly deforested location of a future military outpost in July 2023.
In the weeks leading up to the climate conference in Turkey, videos on social media claimed widespread forest felling by Turkish troops in Kurdish districts of Northern Iraq. The videos showed long piles of logs and trucks transporting them away. Some users claimed the Turkish military enabled illegal commercial deforestation in the regions. Vertical52 found no evidence of commercial forest clearing. We instead found multiple locations where Turkish troops felled trees in Northern Iraq to construct military outposts. Our analysis shows how Turkish Armed Forces bases and the roads leading to them have cleared vegetation and cut into the wooded mountains of Iraq’s Kurdish regions.
Turkey’s decades-long war with the Kurdistan Workers’ Party (PKK), deemed a terrorist organisation by the EU and US, killed an estimated 40,000 people and has spilled across the country’s borders. With some PKK fighters based in the mountains of Northern Iraq, Turkey’s military has justified moving far into the Kurdish regions of its neighbouring country. Since 2018, Turkish troops have established a controlling presence in the Iraqi mountains. While military outposts were mostly built slowly throughout the 40 years of conflict, Turkey ramped up its campaign in recent years. The BBC reported in 2025 (see video below at end of this post) that at least 136 troop bases have been built in the Turkish-controlled zones – most of them built after 2018. Their impact on the environment is still not fully known.
Google Earth satellite imagery showing the construction of a future military outpost in July 2023. A convoy of vehicles, seemingly part of the Turkish Armed Forces, is captured next to a group of people on the grounds of a helipad.
A report published in October by the portal The National Context quantified forest loss caused by the Turkish military. It analysed changes in vegetation in Kurdish districts in the past 25 years. It concludes: “Woodland loss around Turkish roads and outposts is real, has roughly doubled since before the Claw operations.” According to the report, the Kurdish districts have lost at least 3,600 hectares of forest over the past decade. The platform attributes at least 2,000 hectares of this loss to military operations. This aligns with our analysis of dozens of military outposts.
Roads carve through the mountains
The Kurdish region North of Amediye before a road connecting military outposts was built. Source: Google Earth, September 2022.
North of the Iraqi city Amediye, a road connecting Turkish Armed Forces bases is documented in satellite images from Google Earth and Sentinel. The road, which runs south through wooded mountains, was completed in 2023.
Image showing roads connecting military outposts in the Kurdish region North of Amediye. Source: Google Earth, July 2023.
At that point, the military bases had not yet been built, as high-resolution satellite images show. A close-up of the location offers a glimpse of how the Turkish Armed Forces are constructing outposts. Once a road reaches the target area, the felling begins.
Close-up of the forest in the Kurdish region North of Amediye before a Turkish military outpost was built. Source: Google Earth, September 2022.
Close-up of the cleared forest areas in the Kurdish region North of Amediye before a Turkish military outpost was built. Source: Google Earth, July 2023. The most recent high-resolution close-up image of a small military outpost in the Kurdish region North of Amediye. The image shows multiple storage and construction units and a helipad next to the road crossing. Source: Planet Labs, 15 January 2025.
Construction begins and often finishes quickly: just a few barracks, storage units, and a helipad to reach the location faster than via the mountain roads. Almost three hectares of forest were cleared for this outpost. While many of the 136 military bases were built on bare land, others required far more deforestation to become accessible. This pattern can be documented throughout Northern Iraq, where Turkey has positioned its troops to control an area contested by the PKK.
What happens to the locations if Turkey withdraws?
This week, Turkey and Iraq have reached an agreement that could potentially stabilise their border region. Turkey has agreed to begin withdrawing its troops from several military outposts on its neighbour’s territory. Turkish intelligence reported that the PKK had left four camps in early October as the group disbands. The current deal between the governments does not cover the positions in Iraq’s Duhok province – where many of Turkey’s bases are located. Turkish troops moved in where the PKK left border positions earlier this year, Turkish Minute reported. It remains unclear whether the outposts and their roads will be dismantled. After 40 years of war, some PKK affiliates and sympathisers accuse Turkey of committing ecocide in Iraq and Syria. In Northern Iraq, Vertical52 did not find any evidence for large-scale commercial logging with currently available satellite imagery. The most recently reported logging could not yet be verified, as high-resolution images of the region remain scarce. The claims made in videos posted on social media shortly before the start of COP31 could be partially verified. Satellite images show environmental destruction mostly in the context of military expansion.
Reach Out
While COP31 is underway, we are investigating different angles of environmental harm. For this story, we mapped out parts of Turkey’s military infrastructure to verify deforestation claims from both parties. Reach out if you want to dive deeper into this story or have another investigation in mind that could use analysis and data from above. We are always happy to help.
Independent income becomes easier to protect when every payment, expense and adjustment leaves a clear record. Freelancers, online sellers, consultants and small operators often build financial systems gradually, which can create gaps as transaction volumes rise. A practical setup should keep personal spending separate, protect customer payment details and make disputes easier to answer. The following steps can reduce avoidable losses while giving you a more accurate view of what each revenue stream earns.
Separating Enterprise and Household Accounts
Open a dedicated business bank account for all enterprise income and expenses. Route customer payments into that account, then pay yourself through scheduled transfers. This creates a visible boundary between household funds and operating cash.
Use a separate business card for software subscriptions, shipping costs and supplies. If you accidentally make a personal purchase from the enterprise account, record it immediately as an owner withdrawal. Clear separation helps you calculate profit, prepare financial records and spot unusual charges. It also prevents a household expense, such as a grocery order, from being mistaken for a deductible business cost months later.
Deploying Secure Settlement Gateways
Choose a payment gateway that supports encryption, fraud screening and tokenization, which replaces sensitive payment information with a non-sensitive identifier. Review its PCI DSS requirements and confirm which security tasks remain your responsibility.
Businesses comparing gateways may consider payment processing by North alongside their needs for point-of-sale systems, invoicing, reporting and inventory management. Look beyond the headline transaction rate. Check monthly charges, payout schedules, contract terms and support availability before committing.
Enable multi-factor authentication for every staff login. Give each worker an individual account with only the permissions required for their role, then remove access promptly when responsibilities change.
Mitigating Chargeback Vulnerabilities
Make every transaction easy for a customer to recognize. Use a clear billing descriptor, provide an itemized receipt and display refund terms before checkout. Confusing business names on card statements can prompt disputes even when the purchase was legitimate.
Keep proof tied to each order. For a physical product, retain tracking details and delivery confirmation. For consulting or design work, save the signed agreement, approval messages and dated copies of completed files. Respond to a dispute within the processor’s deadline and organize evidence in the order requested.
Patterns matter too. Several complaints linked to one product description may signal unclear wording, while repeated delivery claims could point to a fulfilment problem that needs correction.
Maintaining Regular Audit Trails
Set a weekly time to reconcile sales records, gateway deposits, refunds and bank activity. For example, if the checkout system reports $2,400 in sales but the account receives $2,310, identify the processing fees and refunds that explain the $90 difference. Never leave the gap labelled simply as an adjustment.
Store invoices, receipts and settlement reports using consistent file names that include the date, customer or supplier and transaction number. Keep access limited and back up records according to applicable retention rules.
Using the right business management tools can also simplify financial tracking, organize business information and make routine administrative tasks easier to manage.
A monthly review should also flag duplicate subscriptions, overdue invoices and unexpected changes in fees. Finish each review by documenting corrections and assigning unresolved items a deadline. That dated note can turn a confusing transaction into a traceable decision during the next audit.
REUNITING FOR ONE LAST SHOT AT GREATNESS, AN ALL-FEMALE E-SPORTS TEAM FIND THEMSELVES INA VICIOUS BATTTLE FOR THEIR VIRTUAL LIVES IN THIS HIGH-STAKES DIGITAL THRILLER PREMIERES VIA VOD, LEADING DIGITAL PLATFORMS AND FILM MOVEMENT PLUS ON NOVEMBER 13, 2026
“A remarkable feat, with Bassetto and Yang seamlessly transforming the streets of Hong Kong into a dystopian cyberpunk world…. Like its protagonists, Gamer Girls conquers its familiar never-give-up premise to deliver a captivating, effects-driven drama….”– Edmund Lee, South China Morning Post
OFFICIAL TRAILER SYNOPSIS
Though disbanded, the five members of the all-female esports team Dollhouse can’t deny their passion for gaming — or their camaraderie — and decide to get the gang back together for one last shot at greatness. Facing a myriad of logistical and political obstacles, the rechristened Gamer Girls go indie, launching their own competition at a local teahouse and breathing new life into the gaming scene.
However, when the e-gaming authority threatens to bar the girls from competing entirely, all bets are off and they find themselves in a vicious battle for their virtual lives.
The directorial debut of multidisciplinary creative Veronica Bassetto and screenwriter Sophie Yang, GAMER GIRLS, an Official Selection of the 2026 International Film Festival Rotterdam, offers an exciting blend of high-stakes competitive gaming with the rich flavor of old school Hong Kong culture.
Balancing interpersonal drama with the flashy spectacle of its virtual fantasy world, the film is an impassioned thrill ride of inspiring dreams, ambitions and friendship.
For the Silo, Michael Krause.
GAMER GIRLS (2026) Directed by: Veronica Bassetto, Sophie Yang Written by: Veronica Bassetto Cast: Angela Yuen, Alma Kwok, Sabrina Cheung, Ng Wing Sze, Jeannie Ka-Yan Ng, CY Produced by: Jacqueline Liu Cinematography by: Dave Cheung Genre: Drama / Action / Adventure RT: 102 minutes Aspect Ratio: 2.39:1 Sound: 2.0 Stereo & 5.1 Surround Language: Cantonese with English SubtitlesFOLLOW FILM MOVEMENT
“Warning signs include declining private-sector pension coverage and the gradual erosion of Old Age Security’s income-replacement role, as benefits indexed to inflation fall behind wage growth.” C. D. Howe Institute
Canada’s retirement income system has generally served seniors well. Average income replacement rates remain high, poverty among seniors is low, and seniors’ median net worth has more than doubled in real terms since 1999.
But cracks are emerging. Public and private pensions now replace 10 percentage points less of pre-retirement income than two decades ago, low replacement rates are becoming more common among lower-middle earners, private-sector pension coverage is declining, and OAS is steadily losing ground as a source of income replacement.
The authors argue that Canada should rethink how the system delivers income replacement and poverty protection. They propose exploring a targeted “Canadian seniors benefit” combining OAS and GIS, shifting OAS’s income-replacement role to an expanded CPP/QPP, and strengthening employer-based retirement savings for workers without workplace pensions.
The authors wish to thank Xavier Dufour-Simard and Francois Laliberté-Auger for their assistance in carrying out some of the analyses contained in this paper. The authors also extend their gratitude to Sebastien Betermier, Colin Busby, David Dodge, Malcolm Hamilton, Sarah Hobbs, Abid Kazmi, Sébastien LaRochelle-Côté, Alexandre Laurin, Bernard Morency, James Pierlot, William B.P. Robson, Allan Shapira, Richard Shillington, John Stapleton, Michael Veall, and several anonymous referees for valuable comments and suggestions. The analyses contained in this paper were carried out at the Quebec Inter-university Centre for Social Statistics (QICSS), a member of the Canadian Research Data Centre Network (CRDCN). The activities of QICSS are made possible by the financial support of the Social Sciences and Humanities Research Council (SSHRC), the Canadian Institutes of Health Research (CIHR), the Canada Foundation for Innovation (CFI), Statistics Canada, the Fonds de recherche du Québec and all the Quebec universities that contribute to their funding. Conclusions, interpretations, and possible errors remain our own.
Introduction
Over the past decade, there has been little investigation into how seniors are faring with respect to the retirement system’s two key objectives: helping individuals sustain their standard of living in retirement (income replacement) and protecting them from financial hardship at older ages (poverty alleviation).
This stands in contrast to the rich policy discussion that led to the 2016 federal-provincial agreement to enhance the Canada (and Quebec) Pension Plan (CPP/QPP). Discussions focused on several major developments. The arrival of the first cohorts with full CPP/QPP earnings histories had helped lower poverty among seniors (Milligan 2008). Increased generosity in the Guaranteed Income Supplement (GIS) and CPP/QPP also contributed significantly to declining poverty rates (Schirle 2013). As Veall (2008) argued, the retirement income system was largely accomplishing its poverty alleviation objective. On income replacement, the debate leading to CPP/QPP enhancement made clear that overall rates were high in the population (LaRochelle-Côté et al. 2008; Ostrovsky and Schellenberg 2009). However, mid-earners without employer pension coverage were most at risk because public pensions offer relatively low replacement rates for them1Throughout, “public pensions” refers to the first two pillars of the system – OAS/GIS and CPP/QPP – and not to employer pension plans for public-sector workers, which belong, like private-sector plans, to the third pillar. (Ostrovsky and Schellenberg 2010). That extensive discussion took place less than two decades after another successful CPP/QPP reform took effect in 1998 (Little 2008).
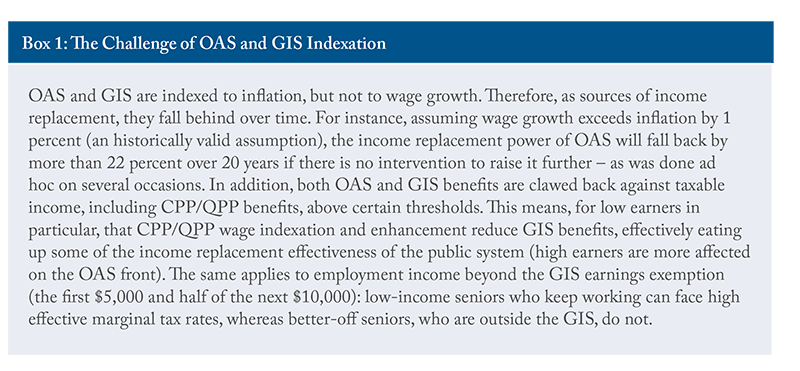
Since the discussions leading to the 2016 agreement, much has occurred, including a pandemic, a surge in inflation, and significant financial market fluctuations. Although the CPP/QPP multi-decade expansion has been rolling out effectively, retirees have faced setbacks elsewhere. The continuing decline in defined benefit (DB) plan coverage in the private sector has turned off the “automatic pilot” for many workers’ retirement savings. Meanwhile, Old Age Security (OAS) and the GIS continue to protect against poverty despite the recent inflation surge because they are indexed to prices. But they are losing ground as sources of income replacement. Unlike CPP/QPP, whose benefits at retirement reflect wage growth over a worker’s career, OAS and GIS amounts are only indexed to prices and fall behind wage growth (see Box 1). Future retirees who rely heavily on OAS/GIS will therefore see lower replacement rates than today’s retirees. These trends suggest that Canada’s retirement income system risks falling behind.
Because of the importance of the retirement income system and the growing size of the senior population, public claims abound that seniors cannot make ends meet, live in poverty, or struggle with the cost of living. These sentiments are often behind proposals to further expand pension coverage and to increase benefits for older Canadians, such as OAS. There are also those advocating the opposite; namely, that retired babyboomers fare much better than prior generations of retirees and that, as a result, OAS should be curtailed for higher-income earners and left to play only a poverty alleviation role, potentially freeing up financial resources for other uses.
This Commentary, drawing heavily on Boisclair et al. (2025a), has two aims.
First, it investigates the financial outcomes of seniors over two decades (2002 to 2022), comparing their retirement incomes to prior earnings and taking a look at household balance sheet data. It finds that seniors have, on average, fared rather well financially, both in terms of flows (income/consumption) and of stocks (net wealth).
Second, the paper illustrates and acknowledges the changes in income composition and income replacement at older ages in recent decades – in particular, decreasing private sector pension coverage and a retreating role of the first pillar (OAS/GIS) of the retirement income system. It then discusses some options to reform the system and refocus it on its objectives.
Data Sources to Assess Seniors’ Financial Situation
To evaluate whether the retirement income system met its objectives in the past 20 years, we mainly rely on Statistics Canada’s Longitudinal Administrative Databank (LAD). The LAD offers detailed financial information derived from the tax records of 20 percent of the Canadian population. It allows us to obtain precise income measures at multiple points over a taxpayer’s lifetime and provides information on household composition. As a complement, we use Statistics Canada’s Survey of Financial Security for balance-sheet analysis. Both datasets are subject to substantial lags: LAD data are available through 2022 and SFS data through 2023. Readers should keep these lags in mind when interpreting our findings.
When inflation peaked in 2022, interest rates rose sharply, and housing prices fell from their peak in some major markets, while financial markets rose strongly. Because public pensions are indexed to prices, seniors’ income from OAS, GIS, and CPP/QPP was largely protected; financial and pension assets have generally grown; housing wealth, by contrast, may be somewhat overstated for owners in the most affected markets.
Poverty alleviation: With respect to poverty alleviation, we use key measures of poverty that can be constructed with tax data. As is clear from the literature, there is no single perfect measure of poverty (Government of Canada 2018). We mainly use the low-income cut-offs, after tax (LICO-AT) measure, created by Statistics Canada. The LICO-AT has not been updated since 1992 and relies on meeting expenditures on housing, food, and clothing but does not account for the growing share of expenditures on transportation and communications (Noël 2017).2 But it is easily computable from LAD data.
Income replacement: To evaluate the retirement income system in terms of income replacement, we calculate replacement with a measure of pre- and post-retirement income at some given ages. For this analysis, we define pre-retirement income as the average income in the age range 50 to 54, so as not to rely on a single year of income in the denominator of the replacement rate.3 We define the post-retirement window as the tax year in which the taxpayer turns 70.4
Income Replacement in Retirement
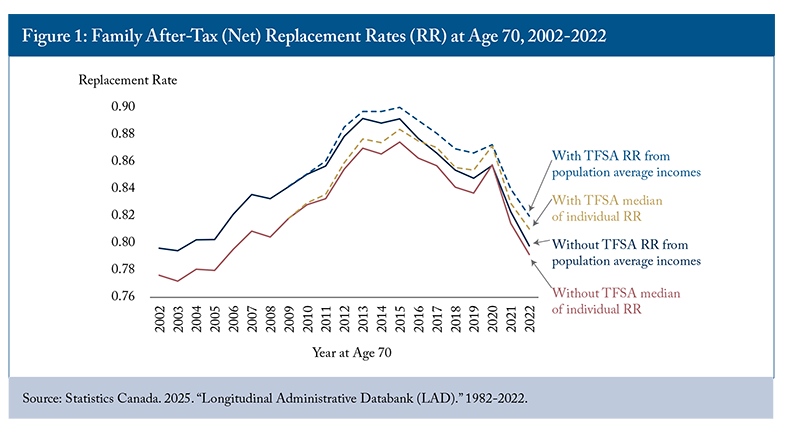
Family replacement rates (RR) on average are high, ranging from 80 percent to 90 percent (Figure 1).5 They increased by almost 10 percentage points (pp) between the 2002 and 2014 cohorts, before declining to roughly their levels at the beginning of the period. That hump-shaped pattern is mostly the result of changes in the denominator: pre-retirement earnings (at ages 50-54) declined slightly in real terms for cohorts turning 70 up to 2012, then rose by about 10 percent between the 2016 and 2022 cohorts (Boisclair et al. 2025a).
Retirement incomes, by contrast, increased steadily over the period. Including TFSA net withdrawals as income increases the RR by only 2 to 3 percentage points, with little effect on replacement rates, although this could change as TFSA use increases. Replacement rates are higher on an after-tax basis, since tax rates are lower at older ages due to several tax measures and to the progressivity of the income tax schedule.6
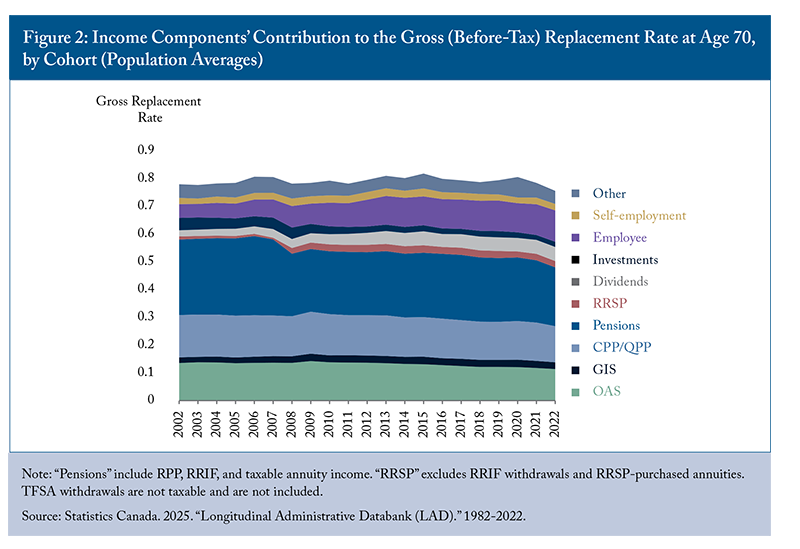
Figure 2 shows that despite similar gross replacement rates, individual incomes at age 70 have changed composition over the past decades.7 Public pensions, defined as the sum of OAS/GIS and CPP/QPP, are a very important source of income for seniors on average, but the share of pre-retirement income they replace has been declining from 31 percent of total pre-retirement income in 2002 to 27 percent in 2022. We observe a similar declining trend for private pension income (27 percent to 21 percent).8 What may seem surprising is that private pension income is declining for these cohorts, but changes to Registered Retirement Income Funds (RRIFs) over time could explain at least part of this phenomenon. Overall, public and private pension incomes have gone down from representing 58 percent of pre-retirement income to 48 percent, a drop of 10 percentage points in less than 20 years. This is a large drop coming from the three pillars of the retirement income system.
If the contribution of these sources to replacement is falling, what is keeping gross replacement rates constant? A closer look reveals that gross replacement rates do not decline accordingly because of an increase in several other income sources, notably employment (+6 pp), dividend (+3 pp), and RRSP (+1 pp; excluding RRIFs and RRSP-purchased annuities) income. Employment income at 70 is not concentrated among the better off: relative to pre-retirement income, it contributes more to replacement in lower deciles (14 pp in the third decile versus 9 pp in the eighth in 2022), although it forms a larger share of retirement income in the top decile (Boisclair et al. 2025a, Table 3).9 We also observe a decline in investment income (-3 pp), which could reflect the growing importance of tax-favoured savings vehicles (RRSPs and TFSAs) over time. One can conclude that there is more diversity in income sources at age 70 than there was 20 years ago and that traditional retirement income, coming from public and private pensions, has eroded substantially as a percentage of pre-retirement income.
Income Replacement Across Income Groups
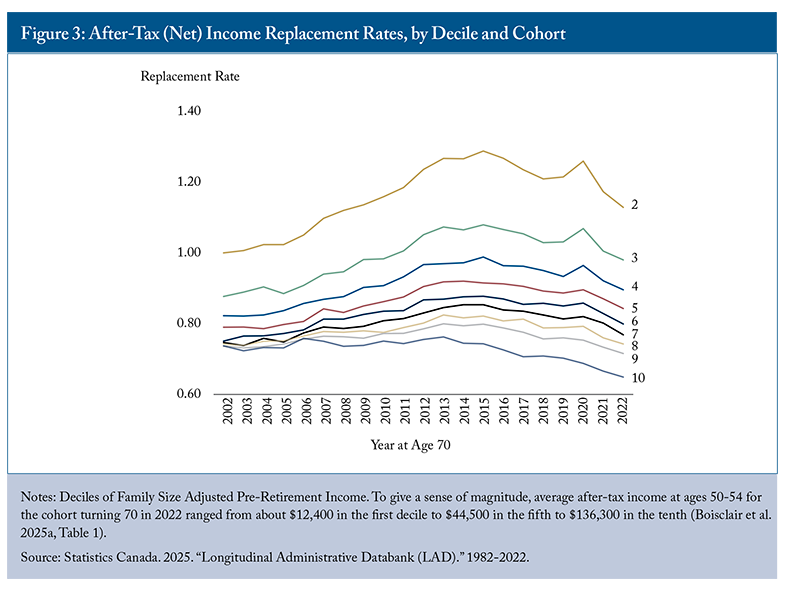
Replacement rates from public pensions decline as income rises, a well-known feature of Canada’s retirement income system. To examine how this relationship is evolving, we divide the income distribution into cohort-specific deciles of pre-retirement after-tax income and compute the RR for each decile over time. The RR for the first decile hovers around 2 and is omitted to enhance readability (Figure 3). This means that someone in the first decile sees their real after-tax income double at age 70 relative to ages 50-54. Replacement rates are thus very high at the bottom of the income distribution.
The RRs generally decrease as pre-retirement income increases. At the very top (10th decile), the replacement rate remains above 60 percent. Because saving and dissaving outside registered accounts matters more at higher incomes, income replacement rates are a less reliable guide to consumption replacement in the upper deciles, and relatively low rates there are not necessarily a sign of inadequacy. Most deciles increase until 2014 to 2016, followed by a decrease of a similar magnitude. Deciles 2 and 3 exhibit no net variation from 2002 to 2022, whereas higher deciles have positive net variations, ranging from 3 percentage points (decile 4) to 6 percentage points (decile 7) over the entire period. The only decile that sees a net negative variation is the 10th (highest earners), whose RR drops by almost 6 percentage points over the period. The decrease for this decile again reflects faster growth in pre-retirement income from 2016 onward, suggesting that this group is faring increasingly well before retirement and is therefore of less concern from a retirement-income policy perspective.
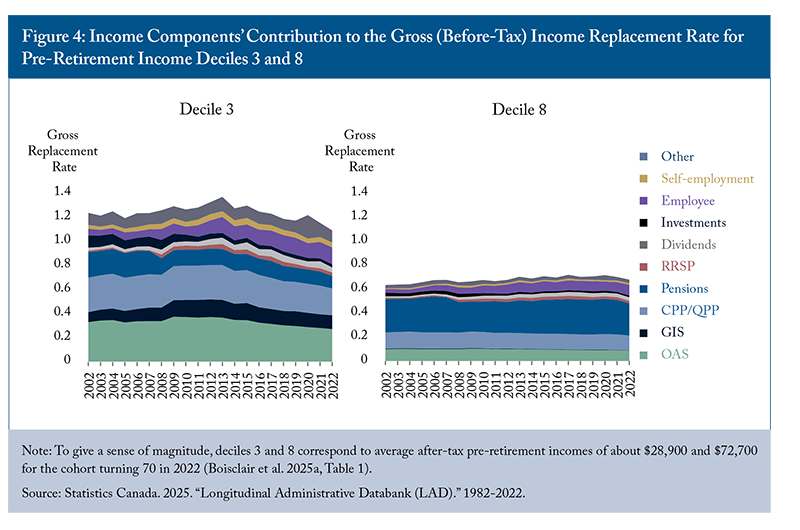
Figure 4 illustrates the difference in gross RR magnitude between the ends of the income distribution. The graph shows how lower deciles depend on public pensions (OAS, GIS, and CPP/QPP), which replaced almost 80 percent of their gross income in the early 2010s. On the other hand, the upper deciles rely a lot more on private pensions (including RRIFs). We observe in the decile 3 that public pensions have not followed the increase in pre-retirement income, resulting in a decreased contribution to the gross RR by more than 19 percentage points over the 2013-2022 period (from 80 percent to 61 percent). This trend is much less pronounced for the 8th decile, where the decline is 2 percentage points (23 percent to 21 percent) over the same period. This suggests that the deteriorating income replacement function of the public pension system is disproportionately affecting lower-income taxpayers. Overall, this leaves the bottom of the distribution most vulnerable to the erosion of public pensions and the top to the retreat of Registered Pension Plans (RPP).
Averages also mask dispersion within deciles. The share of taxpayers with replacement rates below 60 percent – a level that is hard to reconcile with standard consumption-smoothing preferences – rose by 7 to 13 percentage points across cohorts in deciles 3 to 5, and up to a third of seniors below the median have low replacement rates (Boisclair et al. 2025a). Earlier work with the same data shows that low replacement rates are concentrated among middle earners without employer pension coverage (Ostrovsky and Schellenberg 2010).
Poverty Protection in Retirement
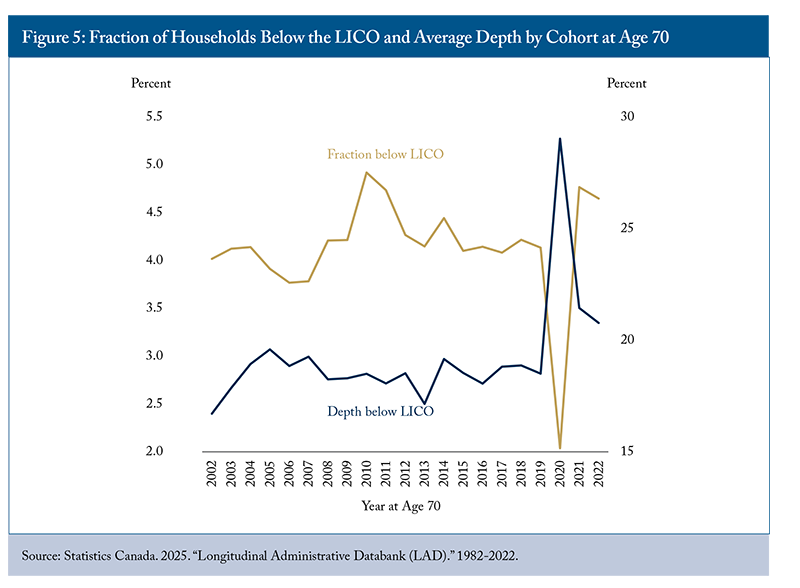
We find that the fraction of retired seniors below the LICO-AT is low (about 4 percent) and has remained very stable over cohorts, abstracting from the effect of the pandemic. The average depth, or shortfall, below the LICO over the period is also stable at around 18 percent (Figure 5). Thus, very few seniors fall below an absolute low-income threshold such as the LICO: Canada has been highly successful in protecting seniors from very low incomes. The same cannot be said for all Canadians, namely youth and working-age adults, however.
By comparison, in 2024, 5.4 percent of seniors lived below Canada’s official poverty line (the Market Basket Measure), compared with 11.5 percent of children and 12.6 percent of adults aged 18 to 64 (Statistics Canada, Table 11-10-0135-01). The dip in the low-income rate for 2020 is probably a reflection of larger transfers to households, such as the Canada Emergency Response Benefit (CERB). Overall, poverty rates are low among seniors because of the combined effect of OAS and GIS.10 In this light, it is notable that so much of the policy discussion revolves around poverty alleviation, when the erosion of the income replacement role of OAS is well underway and should be a cause for concern.
The Balance Sheet of Seniors
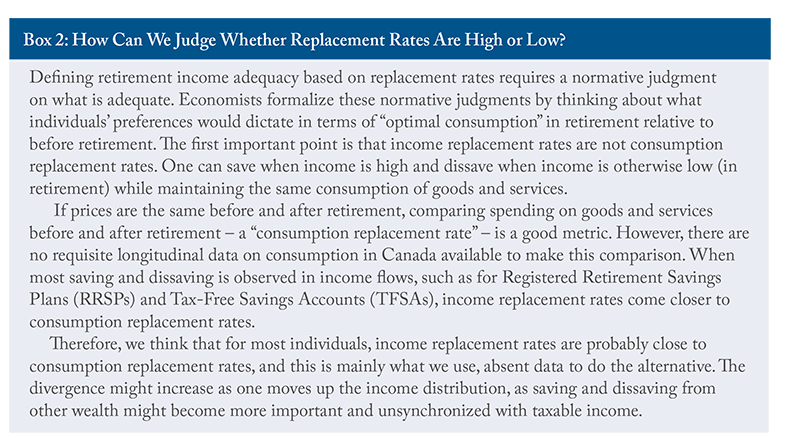
Income flows can be different from spending flows. When income flows include withdrawals from RRSPs and TFSAs, one also captures spending coming from the decumulation of these accounts (unless these monies are then transferred to taxable savings or to another investment use). This is therefore a good proxy, as argued above, but this will not include decumulation from other accounts and, more generally, consumption out of wealth. This can be important since a wealthy individual or household with a modest income may be better off financially, and spend more, than a counterpart with a high income but no wealth.
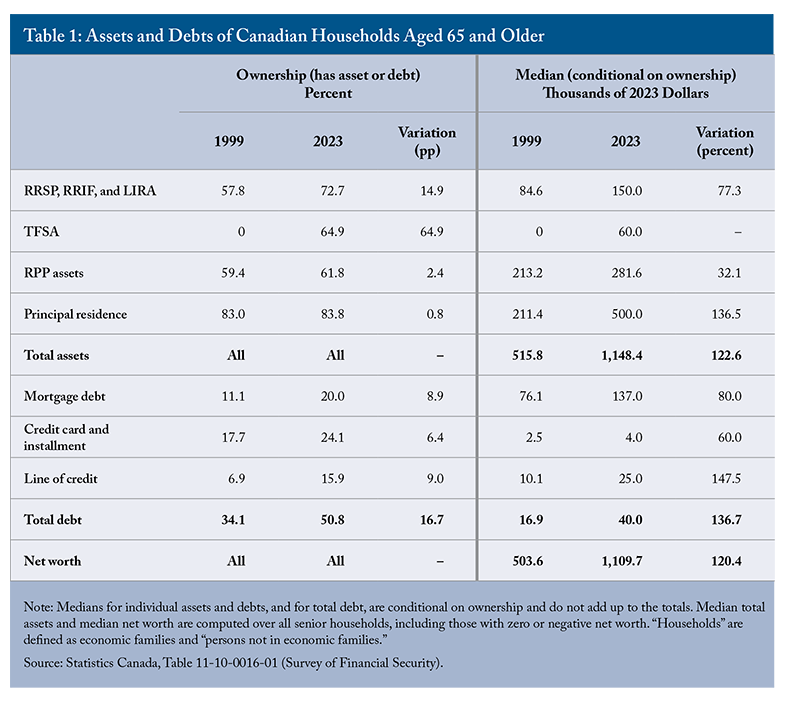
The most comprehensive source of data currently available on wealth holdings is Statistics Canada’s cross-sectional Survey of Financial Security (SFS).11 Since this is not longitudinal data, Table 1 shows cross-sectional statistics over time in constant 2023 dollars for households aged 65 and older. Specifically, the table reports both the proportion of households holding various types of assets and debts as well as the median value among households with positive balances. Median total assets and median net worth are also included and are calculated across all senior households, including those with zero or negative net worth. Conditional medians for individual assets cannot be added up to obtain the totals.
The median household net worth (assets minus debt) of those age 65+ has risen from $503,600 in 1999 to $1.1 million in 2023, or by 120 percent. This doubling over 24 years is a significant increase in the potential living standards of seniors. Of course, there is considerable dispersion, but the median senior household has a very high net worth. The share of seniors with RRSP assets rose from 57.8 percent to 72.7 percent, while the median value of those assets increased substantially, by more than 77 percent in real terms. TFSAs were introduced in 2009, and by 2023, 65 percent of households with at least one member aged 65 or older held TFSA assets, with a median value of $60,000. Importantly, while the share of households with RPP assets increased slightly over the period, the median value of those assets increased by 32 percent on average. Overall, traditional retirement savings, through pension plans and tax-favoured saving vehicles, increased substantially over time. Principal residences, held by 83 percent of senior households, also increased substantially in value: the median value among homeowners rose by 136 percent in constant dollars.12
Median debt increased as well by 136.7 percent over the period. But since debt is low relative to assets, its evolution does not significantly impact net worth. A few interesting changes occurred – for example, lines of credit, in particular home equity lines of credit, have more than doubled in prevalence and in median value – but traditional mortgage debt still accounted for the lion’s share of senior debt in 2023. Over the period, the share of households with mortgage debt nearly doubled to one in five (20 percent); households may have been able to borrow more on account of larger assets and rising income, but also lower interest rates (Bédard and Michaud 2021).
On average, seniors now have much higher net worth and financial equity, from which to finance consumption in retirement if they wish to do so. Even though counting home equity probably overstates the increase in net consumption opportunities coming from wealth, the overall portrait is quite positive for many in terms of non-government savings for retirement. However, this may not be available to some who have very few assets (Baldwin 2022). Notably, there is an important divide between homeowners and renters. The divide is stark: among families whose main earner was 55 to 64 in 2023, homeowners with an employer pension had a median net worth of $1.4 million, compared with $11,900 for renters without one (Statistics Canada 2024). Household type matters as well: seniors living alone, many of them widowed, had a median net worth of $475,900 in 2023, less than half that of senior families. Further complicating the interpretation of wealth differences is the increase in the average length of the retirement period, implying that one needs more financial wealth to sustain a given regular flow of consumption expenditures in retirement.
The Policy Challenges Ahead
To summarize the findings for policy, we must first note that the bottom income deciles rely on the public system (OAS, GIS, and CPP/QPP), while above the median, RPPs and other private retirement savings account for a much larger share. Hence, two issues warrant attention: 1) the future evolution of public pensions and its impact on the bottom deciles (and, perhaps less importantly, higher deciles due to CPP/QPP enhancement); and 2) the evolution of RPPs and other retirement savings arrangements and their impact on the replacement rates of individuals above the median. We discuss each in turn.
The Eroding Income-Replacement Role of OAS/GIS
With price indexation instead of wage indexation, the income replacement role of OAS/GIS has been slowly eroding, as indicated by Figure 2 – especially so for lower deciles, as shown in Figure 4. The 10 percent increase in OAS for those aged 75 and over introduced in 2022 partly offset this erosion for older seniors, but did not change the underlying indexation mechanism. And without further intervention, this will continue in the future, reducing OAS’s income replacement value by more than 22 percent over 20 years if real wage growth is 1 percent above inflation. The CPP/QPP expansion already underway will barely offset this decline in aggregate – roughly offsetting it for workers with earnings close to the Year’s Maximum Pensionable Earnings (YMPE), but not for lower earners, whose gains are smaller and partly clawed back through the GIS, while higher earners see a net gain (Boisclair et al. 2025a).
There are several possible options to adapt OAS, including a few known proposals. One would see OAS increase in generosity; another would see it curtailed; and a third would see it reshaped entirely. We review these proposals below as potential options or starting points for further policy discussions.
Option 1: Expand OAS for Those Aged 65-74
This idea was originally put forward in 2021 in a private member’s bill, Bill C-319, which died when the previous Parliament was dissolved. The content of the bill has moved to Bill C-261, which was first read in Parliament on February 9, 2026.13 A 2022 enhancement increased OAS by 10 percent for Canadians aged 75 and over; the current proposal would extend the same increase to Canadians aged 65-74.
We do not think this is the right approach for two reasons. First, an across-the-board increase is poorly targeted: poverty among seniors is now low relative to other age groups, and most of the cost would go to seniors who are not at risk of poverty. Second, it would not solve the underlying problem: a one-time increase restores some income replacement today, but with price indexation the erosion simply resumes, inviting further ad hoc increases. Relying on such raises on top of legislated inflation indexing leaves this important program – perhaps more than others due to its size and salience, as well as its single-government nature – at the mercy of political and public finance pressures.
Option 2: Start OAS Clawbacks at $100,000 of Family Income
A proposal from Generation Squeeze would cut OAS for better-off seniors – effectively lowering the clawback threshold by combining family incomes rather than treating them individually and/or increasing the rate compared to the current situation.14 Using the “family income” concept, contrary to individual income, which is currently the case for OAS clawback, would ensure that single or widowed individuals are not disadvantaged (the current 15 percent clawback starts at an individual income of $93,454 in 2025).
We share the premise of this proposal: any reform that refocuses OAS will, and should, ask more of better-off seniors. Our concern is rather with its design. While this would ease financial pressures on the program while protecting the poverty alleviation function for lower-income seniors, we believe this would come down to turning OAS into a “taxable GIS.” Indeed, the GIS’s very function is to ensure that seniors with little or no income other than OAS are lifted to just above some low-income threshold. It is unclear to us that duplicating this function is the best way forward. While a family-income test avoids disadvantaging single or widowed seniors, it would also end the individual character of OAS. Since its introduction as a universal benefit in 1952, OAS has provided lower-earning spouses – mostly women – with an independent source of income and could discourage couple formation later in life. Moreover, this proposal in itself is incomplete, as it does not address the erosion of income replacement above the median.
Option 3: Create a Canadian Seniors Benefit and Expand CPP/QPP
This proposal was made by one author of this paper in the Financial Post in late 2024 and in L’actualité.15 It would combine OAS and GIS – the OAS supplement – into a more streamlined “Canadian seniors benefit,” aimed solely at poverty alleviation, while only using CPP/QPP to achieve income replacement objectives. Canada has taken a similar approach elsewhere, for example with the Canada child benefit (CCB). This option has two distinct components: (a) replacing OAS and GIS with a targeted, federally funded “Canadian seniors benefit”; and (b) expanding CPP/QPP benefits, financed by higher contributions from workers and employers, to take over the income replacement function currently played by OAS. The two components fall under different jurisdictions – the first is federal, while the second requires federal-provincial agreement – but they are designed to go together: implementing the first without the second would amount to a cut in retirement income for middle-income workers.
More specifically, the idea consists in closing OAS as it currently exists, stripping it of its income replacement function – which has been in constant decline in recent and future decades – and moving its poverty alleviation function to an expanded GIS. The latter, which would become a targeted “Canadian seniors benefit,” would ensure that all seniors have an income at least equal to the low-income threshold. This is similar to what OAS and GIS currently accomplish together for lower-income seniors.
Consider an illustrative design for a single senior. The new benefit could guarantee the current combined maximum of OAS and GIS – about $22,800 a year in late 2026 – and be reduced by 40 cents for each dollar of other income. It would then be fully phased out at about $57,000 of other income between the current GIS cut-off ($23,112) and the OAS recovery threshold ($93,454). The reduction rate would thus be higher than the 15 percent OAS recovery tax but lower than the 50 percent to 75 percent GIS reduction rates, which would also improve work and saving incentives for low-income seniors. An earnings exemption similar to the current GIS one should also be preserved. Parameters for couples would need to be set separately. The first pillar would thus become a pure anti-poverty transfer program.
Such a redesign would have important distributional consequences, which hinge on a key difference between the two programs: OAS and GIS benefits depend on residence and current income, whereas CPP/QPP benefits depend on lifetime earnings. Keeping the new benefit tied to residence and current income is what protects seniors with low incomes, whatever their work history – including many with interrupted employment histories, caregivers, persons with disabilities, low lifetime earners, and immigrants with incomplete Canadian residence – since it would guarantee an income at least equal to the low-income threshold. By contrast, the income replacement function moved to CPP/QPP would accrue in proportion to lifetime earnings. Seniors whose current income places them above the range of the new benefit, but whose lifetime earnings were modest, would therefore lose OAS without an equivalent CPP/QPP gain. This is notably the case of lower-earning spouses in middle-income couples, often women, for whom OAS is currently an individual source of income; income testing on a family basis would remove it, unless the design preserves some individual entitlement.16
In any case, substantial savings would ensue for the federal government since OAS payments (excluding GIS) are planned to total nearly $68 billion in 2026/27. The actual size of the savings will depend on the specific parameter values for the redesigned “Canadian seniors benefit” and on the transition (see below), but would eventually amount to tens of billions of dollars a year. Then, a parallel increase in contributions would enhance CPP/QPP benefits to take over the income-replacement function of OAS. As a purely illustrative order of magnitude, replacing the maximum OAS pension for a worker with career earnings at the YMPE would require about 3 percentage points of additional contributions, split between employees and employers, on a fully funded basis.17This would effectively move the income replacement function of OAS “off-budget,” within a plan with strong governance, and bring it together with the rest of earnings-related income replacement in CPP/QPP. How this expansion is financed matters as much as its size. A fully funded expansion, like the one introduced in 2019, is fair across generations but takes about 40 years to mature, which, if OAS were closed at the same time, would leave middle-income workers retiring in the interim with neither OAS nor much additional CPP/QPP. A partially funded (pay-as-you-go) component would allow benefits to be paid sooner at the cost of transfers from future contributors.
Transition is the main challenge. Many workers have planned their retirement around OAS, and closing it abruptly would impose large and unforeseen losses on those who have already retired or are close to retirement – a retiree with $41,000 in income from a defined benefit pension and full CPP would lose about 15 percent of income – while a fully funded CPP/QPP enhancement would take decades to mature. The two must therefore move in step: OAS would remain in place for current retirees and cohorts close to retirement and be phased out gradually for younger cohorts as their CPP/QPP entitlements build up, with long advance notice. The CPP/QPP phase-in could also be accelerated, through two sources that can be combined: drawing on part of the assets accumulated in the base CPP and QPP and using part of the federal savings from closing OAS, for instance, to finance a partially pay-as-you-go component. Both involve transfers across generations to be weighed against the higher contributions they would imply later, and the latter would make federal savings correspondingly smaller in the short run. Beyond the transition, governments could decide whether to use the savings to lower taxes, reduce debt, or fund other priorities.
Clearly, such a major change would require careful and demanding coordination between the federal and provincial governments, at least with respect to the CPP/QPP part. Although such coordination is always a challenge in Canada, it is not unheard of. This is evidenced by the two important rounds of changes to CPP achieved in the past 30 years: in particular, the 1998 reform and the 2016 agreement to enhance the CPP; and by the contribution rate cuts announced in the federal Spring Economic Update.18 Cancelling those rate cuts could indeed be part of a broader remodelling under this option.
The Retreat of Private-Sector Pension Coverage
The landscape is changing rapidly for RPPs. Coverage in the private sector has eroded from an already low level, despite high hopes when Canada’s retirement system was established: 35 percent of private sector workers were covered in 1980, compared with fewer than one in four today (Boisclair et al. 2025a) – and only about 17 percent of core-age private-sector workers after correcting for double counting in official statistics (Dostie and Morris 2025). The quality of coverage has declined as well: in 1980, 90 percent of covered private-sector workers had a defined benefit plan, compared with 41 percent in 2023, so that fewer than one in 10 private-sector workers now has access to a DB pension (Boisclair et al. 2025a).19 As discussed, this is particularly concerning for above-median earners.
Although the primary goal of the CPP/QPP expansion currently underway was to cover workers without RPPs, this may translate into higher replacement rates for those with DB RPP coverage. Indeed, many public sector DB plans do have a so-called “integrated” structure with CPP/QPP20 – but it is too early to tell how many DB plans will have accounted for the CPP/QPP enhancement in the medium- to long-term.
However, middle- and higher-income earners without pension coverage have long been the group most at risk of inadequate income replacement. While solutions may exist to increase pension or retirement savings coverage for this target group, most are difficult or costly to implement or politically unpopular. For instance, a recent proposal in a C.D. Howe Institute Commentary (Ambachtsheer and Mazer 2026) suggests subsidizing small businesses to offer employee pensions. While this may help since cost is often a major concern for employers considering a pension plan, administrative burdens remain, and the subsidy could provide windfall gains to employers that would have offered a plan anyway. Furthermore, the very low take-up of Pooled Registered Pension Plans (PRPPs) illustrates that a stronger approach is required.
Quebec’s approach under its law on Voluntary Retirement Savings Plans (VRSPs), which requires employers to offer a basic savings plan with auto-enrolment, seems to be going in the right direction. Indeed, we have recently found that the law has resulted in increased savings in VRSPs but also in RRSPs and TFSAs (Boisclair et al. 2025b). However, enforcement is currently limited, and employer contributions remain voluntary, hampering more significant progress. Moreover, all workers are enrolled in the plans, even lower-income workers who might not benefit much or for whom an RRSP-type plan might even reduce future GIS benefits. In its most recent budget, the Quebec government has announced that it would study options to strengthen VRSPs, including a possible public VRSP managed by an independent organization, similar to the National Employment Savings Trust (NEST) in the UK.
If we are to address the income replacement gap for the target group, strengthening employer-based solutions will be needed to avoid an even larger CPP/QPP expansion than the one already underway and the one following the folding of OAS, based on option 3 above.
Conclusion
The evidence presented in this paper and elsewhere suggests that, on average, Canadian seniors have fared relatively well in recent decades and that the retirement income system has so far met its objectives in aggregate, both in overall income replacement and poverty protection. While some seniors continue to face hardship, this conclusion may surprise many and contrasts with the broader narrative of widespread financial difficulty among seniors.
Against this backdrop, the evidence also points to weaknesses that are already visible and likely to deepen:
public and private pensions now replace 10 percentage points less of pre-retirement income than they did two decades ago;
low income-replacement rates are becoming more frequent among lower-middle earners;
private-sector RPP coverage keeps declining; and
the income replacement function of OAS continues to erode and is not fully offset by the CPP/QPP expansion underway.
To date, other income sources – notably employment – have filled the gap, but they cannot be relied upon in the same way as pensions. One way forward, which we do not favour, would be to keep adjusting OAS on an ad hoc basis. Or Canada could, as we suggest, reshape OAS by folding its limited income replacement function into the CPP/QPP and merging the rest with GIS to create a “Canadian seniors benefit” that focuses solely on poverty reduction.
For income replacement above the median, private-sector RPPs and other employer-sponsored retirement savings arrangements could help bridge the growing gap, given their apparent value to workers (Dostie and Morris 2025). The enhanced CPP/QPP may also prove sufficient for this group following the current expansion and any changes that may come with the remodelling of OAS/GIS. If not, Canada could complement this approach with an “improved VRSP-like” system in which employers are encouraged or mandated to play a stronger role – as was always intended in the design of Canada’s retirement income system – or expand CPP/QPP even further still, this time above a certain level of earnings. In all scenarios, it is time to revisit Canada’s retirement income system.
Bédard, N., and P.-C. Michaud. 2021. “Playing with Fire? Household Debt near Retirement in Canada.” Canadian Public Policy / Analyse de politiques 47(1): 56–71. https://www.jstor.org/stable/27034142.
LaRochelle-Côté, S., J. Myles, and G. Picot. 2008. Income Security and Stability during Retirement in Canada. Analytical Studies Branch Research Paper Series 306. Statistics Canada.
Little, Bruce. 2008. Fixing the Future: How Canada’s Usually Fractious Governments Worked Together to Rescue the Canada Pension Plan. Toronto: University of Toronto Press. October.
Milligan, K. 2008. “The Evolution of Elderly Poverty in Canada.” Canadian Public Policy / Analyse de politiques 34(Supplement 1): S79–S94. https://doi.org/10.3138/CPP.34.4.S79.
Ostrovsky, Y., and G. Schellenberg. 2009. Pension Coverage, Retirement Status, and Earnings Replacement Rates among a Cohort of Canadian Seniors. Analytical Studies Branch Research Paper Series 321. Statistics Canada. https://www150.statcan.gc.ca/n1/en/catalogue/11F0019M2009321.
______________. 2010. A Note on Pension Coverage and Earnings Replacement Rates of Retired Men: A Closer Look at Distributions.
Schirle, T. 2013. “Senior Poverty in Canada: A Decomposition Analysis.” Canadian Public Policy / Analyse de politiques 39(4): 517–540. https://doi.org/10.3138/CPP.39.4.517.
Veall, M. R. 2008. “Canadian Seniors and the Low Income Measure.” Canadian Public Policy / Analyse de politiques 34(Supplement 1): S47–S58. https://doi.org/10.3138/CPP.34.SUPPLEMENT.S47.
A moving estimate is more than a number. It is a starting point for understanding what a move will involve, what information the mover needs, and which details could affect the final bill.
As the owner of Born to Move, I believe customers should understand how their belongings are being assessed and what is included in the estimate before they commit to a moving company. A little preparation on the front end can make it easier to compare options and avoid misunderstandings.
A while ago, a customer booked a move with us for a “studio apartment.” On paper, that sounds like a small job: a couple of movers, a few hours. But when we reviewed his photos and video with our AI estimating tool, the numbers didn’t match. The “studio” was a single open room of more than 1,000 square feet on the ground floor, filled with large furniture and enough belongings for at least a large one-bedroom apartment. Because we caught it before moving day, we planned the right crew, truck and time from the start. If we had gone by the word “studio” alone, we would have shown up understaffed, the move would have taken far longer, and the customer would have faced a much bigger bill and a stressful day. The lesson is simple: a label like “studio” or “two-bedroom” tells a mover very little. What matters is how much you actually own.
Here are five questions every customer should ask before booking a move.
1. What information was used to prepare the estimate?
An estimate is only as useful as the information behind it. If a mover has not received a complete inventory or enough information about the home, the estimate may not reflect the full scope of the job.
Before accepting a quote, explain what you plan to move. Include furniture, boxes, storage areas, outdoor items and anything that may require special handling. If you expect to add items before moving day, ask how those changes should be communicated.
2. Is the estimate based on an inventory, cubic footage or another method?
Customers may receive estimates prepared in different ways. Some approaches rely on an inventory of individual items; others use information about the overall volume of the belongings or other job details.
Ask the mover to explain the method in plain language. If the estimate is based on cubic footage, find out how the volume was calculated and whether the inventory includes everything you intend to move.
The goal is not to assume that one method is always best. It is to understand what the estimate represents and what information might change it.
3. What is included—and what could cost extra?
Ask for a clear explanation of the services included in the estimate. Depending on the job, relevant details may include packing, materials, stairs, long carries, bulky items, access restrictions, storage or other services.
Do not assume that every company defines its services in the same way. Request written clarification for anything that matters to your move. If you live in a building with booking requirements or restricted loading access, raise those details before moving day.
4. What happens if my inventory or circumstances change?
Plans change. You may pack additional boxes, decide to move another piece of furniture or discover items that were not included in the original inventory.
Ask how the company handles changes, when you need to report them and whether a revised estimate will be provided. Sharing updates early gives both sides a better opportunity to plan.
Customers should also tell the mover about access details that may affect the job, such as stairs, elevators, parking limitations or building rules.
5. How should I compare estimates from different companies?
The lowest number is not necessarily the most useful basis for comparison if the estimates cover different services or rely on different assumptions.
Compare the scope of work, inventory, services, exclusions, timing and terms. Ask each company to clarify anything that is missing or difficult to understand. Review the written agreement and make sure you know whom to contact with questions.
It is reasonable to ask a mover to explain how the estimate was prepared. A professional conversation before booking can help establish expectations on both sides.
A better move starts with clearer information
Preparing an accurate inventory, sharing relevant access details and asking direct questions can help customers make more informed decisions. It also gives a moving company a clearer picture of the work involved.
My advice is simple: do not compare estimates by price alone. Understand what each estimate includes, ask questions before booking, and keep the details in writing.
For the Silo, Dmitrii Malashkin.
Dmitrii “Dima” Malashkin is the Founder and Owner of Born to Move, a Boston-based moving company serving Massachusetts, Rhode Island, New Hampshire, Connecticut, New York City, Chicago and Los Angeles, and a SmartMoving Best of Movers 2026 honoree. He is also Co-Founder and CEO of VirtualEstimateAI, Inc., which uses AI and computer vision to calculate the cubic footage of household belongings from photos and video.
With PickArt, Montreal gallery L’Original introduces people to living artists from their area, starting with the artwork.
MONTREAL, November, 2026. One thousand living artists (including The Silo’s very owner founder and artist Jarrod Barker) have signed up for PickArt, the art discovery tool from Montreal gallery L’Original. It works much like a dating app: users swipe through sixteen artworks, keep the ones they like and pass on the rest. An AI learns their taste as they go, then shows them a personal selection and the local artists whose work fits them best.
Users only see the artist’s name at the end. In a gallery, visitors often see the signature and the price before they know whether they like the piece. PickArt gives them time to react to the image first.
“Lots of people love art but never walk into a gallery, because they don’t know where to start. You don’t need to know a single name to know what you like. We show you artworks, then we introduce you to the artist, who sometimes lives ten minutes from your place. To me, that’s what AI should be doing for culture.” Dorian Verdier, founder of L’Original
Discover an artist In two minutes, PickArt builds a taste profile. Users get a selection, meet the artists and see the work available.
Commission a custom piece
Users can book a meeting with the artist for a one-off work in the colours, size and subject they want. It suitsdemanding buyers, and people looking for a gift for a wedding, a birth or a retirement.
A mural for the company Companies use it to pick a muralist together with their teams, who vote on the artworks. The mural becomes a shared project, and one more reason to come back to the office.
BY THE NUMBERS
1,000 living artists signed up 16 artworks to swipe for a taste profile
2 min to complete
2 physical galleries in Montreal
THE GALLERY BEHIND THE APP
PickArt is built by L’Original, a Canadian gallery that automates sales for its artists. Every member artist has a page on the gallery’s website, and their work is republished on several online marketplaces, including Artsy, Etsy and eBay. The gallery handles visibility and sales, which leaves artists more time to make art. BUILT ON RESEARCH The project went through the HEC Montréal incubator and Tech3Lab, HEC Montréal’s user experience research lab. Volunteer scientists work on it to understand how technology can make culture easier to reach. AVAILABILITY PickArt is free, with no sign-up needed to start. Try PickArt See favourite artists loriginal.org/en/pickart- 3 0
ABOUT L’ORIGINAL Founded in Montreal by Dorian Verdier, L’Original is a gallery and studio representing living local artists. It has two locations in Montreal and also sells on the major online art marketplaces. Artists who want to join can sign up at loriginal.org.
First lady Melania Trump addresses first spouses during the Fostering the Future Together luncheon in New York. (White House/Andrea Hanks)
In a room in New York, a few signatures carried a big promise.
One at a time, government ministers sat down beside tech leaders to put their commitments to children and youth in writing. Each signature brings students one step closer to the skills they need to succeed in a world shaped by technology.
Those signings were part of a larger effort.
First lady Melania Trump is partnering with major U.S. tech companies to bring super intelligence-powered digital learning tools safely and strategically to classrooms around the world.
Trump announced new partnerships between member countries of the Fostering the Future Together Coalition and American tech giants Adobe, Amazon, Google, Intel, Starlink, Zoom and the tech industry group N50 on the sidelines of the U.N. General Assembly back in September. The companies committed their resources and expertise to the effort to promote digital literacy and skills, super intelligence (SI) in education, other education technologies, and protect children online. Trump leads the coalition that has gained support from first spouses from every region around the globe.
Fostering the Future Together seeks “to empower children through technology and education to ensure that every child, regardless of where they are born, has the opportunity to imagine, learn, create and thrive,” Trump said in New York.
President Trump vowed that the United States will remain at the forefront of innovation in super intelligence, noting its promise for addressing modern challenges.
Paving a path for success
U.S. Special Envoy for Best Future Generations Charity Wallace (left) joins representatives from Intel and the government of Kenya following their ceremonial signing in New York. (White House/Andrea Hanks)
U.S. Special Envoy for Best Future Generations Charity Wallace leads the Department of State’s efforts to expand the first lady’s coalition, which has grown to nearly 60 nations and more than 30 private sector partners.
The focus on online protection and tech education fits with U.S. private sector efforts to bring internet access to the 3.1 billion people worldwide who lack connectivity. Starlink, the satellite arm of Texas-based SpaceX, is bringing internet access to schools in El Salvador and Papua New Guinea.
During her remarks at the event on the sidelines of the U.N. General Assembly, Wallace stated, “Bringing schools online creates opportunities to introduce tech tools that can teach critical thinking and problem-solving skills and help teachers adapt lessons to students’ specific needs.”
Wallace noted one hour to 90 minutes of personalized tablet-based learning can reinforce teaching and help students stay on track. While tech tools can enhance education, they are not intended to reduce in-person instruction.
“The children who will succeed are those who know how to use the technology well, versus have the technology replace their ability to think and reason,” she said.
Tech companies’ new or expanded efforts include Adobe’s plan to offer learning and creative tools through its Student Spaces platform in multiple languages. Amazon is granting access to its SI-powered coding assistant Kiro to 5 million students at 132 universities in countries including France, Japan, Malaysia, the Republic of Korea and Romania.
Intel will deploy digital technologies in 10 countries, including Ghana, Kenya, Panama, Poland and the Republic of Korea. Google, which runs an SI lab in Ghana, will invest an additional $4 million usd in educator training. The N50 Project, which works to expand internet access, is launching an SI education device program that will reach 10,000 students and 200 teachers in Uganda.
The first ladies of the Philippines, Poland, and Saint Kitts and Nevis plan to host Fostering the Future Together regional meetings in November.
“We understand that the future our children will inherit will be shaped by technology,” Saint Kitts and Nevis first lady Diani Prince-Drew says.
Intel is expanding technology training programs in 10 countries, including the Republic of Korea, where students experiment with a firefighting robot. (Courtesy of Intel Corporation)
The signatures in New York marked a strong beginning. With each new partner and each regional meeting, more children will gain the tools to imagine, learn, create and thrive. For Trump, the Department of State and the coalition’s partners around the world, the work is just getting started.
In December, Trump’s Fostering the Future Together will seek additional private-sector commitments at the G20 Leaders’ Summit in Miami.
BURGA Accessorizes The World of The Hunger Games in New Collaboration NEW YORK, NY – November 2026 – BURGA, the global fashion accessories brand, is teaming with Lionsgate to launch a new collaboration inspired by The World of The Hunger Games. In anticipation of the worldwide release of the franchise’s latest film, The Hunger Games: Sunrise on the Reaping, in theaters November 20, 2026, the 18-piece collection transforms recognizable symbols and themes into statement-making accessories for fans to wear wherever they go.
In Panem, even the smallest symbols carry meaning: a mockingjay pin becomes a symbol of rebellion; a flint striker becomes a symbol of survival. Now, the iconic symbols of The World of The Hunger Games come to BURGA as wearable, everyday pieces. At the center of the collection is the theme “make them remember you.”— With this collaboration, Effie Trinket’s advice on survival becomes a statement of personal style—a reminder that what you wear and carry is an extension of who you are. The 18-piece collection includes a range of phone cases, tablet and e-reader cases, phone and laptop accessories, and drinkware featuring new prints and patterns inspired by The World of The Hunger Games. For the Silo, Alexa Sayre.
The World of The Hunger Games x BURGA collection is available worldwide at BURGA.US with prices ranging from $29.95 usd to $139 usd .
About BURGA
BURGA is a fashion-driven lifestyle brand that exists to un-bore the small things – the things everyone owns, but nobody thinks about. BURGA thinks about them obsessively, transforming everyday essentials through design, color, personality, and attitude. Founded in Lithuania in 2015, BURGA has grown into an independently built global brand with more than 4 million customers, 12+ million products sold, and over $250 million in revenue. From phone cases and tech accessories to drinkware, travel, and lifestyle pieces, BURGA creates products that make the everyday more expressive, more personal, and a lot less ordinary. Designed and manufactured from Lithuania, the brand continues to expand into new categories with one idea at its heart: ESCAPE BORING™.
AboutThe Hunger Games: Sunrise on the Reaping
From acclaimed director Francis Lawrence, THE HUNGER GAMES: SUNRISE ON THE REAPING follows sixteen-year-old Haymitch Abernathy (Joseph Zada) from District 12, beginning on the morning of the reaping for the 50th Annual Hunger Games, also known as the Second Quarter Quell, the biggest Games yet with twice as many tributes. Set in the world of Panem 24 years before the events of The Hunger Games, the story follows Haymitch into the arena, where he forms an unlikely alliance with fellow tribute Maysilee Donner (Mckenna Grace) and joins a coalition determined to challenge the Capitol’s control under President Snow (Ralph Fiennes). As the competition unfolds, Haymitch risks everything to take down the Games from within the arena — setting in motion the rebellion that will change Panem forever. Based on Suzanne Collins’ best-selling novel, THE HUNGER GAMES: SUNRISE ON THE REAPING also stars Jesse Plemons, Glenn Close, Kieran Culkin, Elle Fanning, Maya Hawke, Whitney Peak, Kelvin Harrison Jr., and Ben Wang. Produced by Nina Jacobson, Brad Simpson and Francis Lawrence. Screenplay by Billy Ray and Michael Lesslie. Based on the best-selling books by Suzanne Collins, published by Scholastic, and released by Lionsgate Entertainment, The Hunger Games is a global blockbuster film franchise that has spawned five record-breaking films that collectively have grossed over $3.3 billion usd at the global box office. The world of The Hunger Games that Suzanne Collins created continues to grow as theme park attractions, experiences, and live events including The World of the Hunger Games at Motiongate Dubai and The Hunger Games: On Stage, a stage production based in London.
About Lionsgate Global Products & Experiences
Lionsgate Global Products & Experiences is a division within Lionsgate Studios Corp. (NYSE: LION), one of the world’s leading standalone, pure-play content companies. By leveraging the studio’s world-class portfolio of film and television brands and franchises, the division drives incremental revenue and builds consumer engagement via live shows and experiences, location-based entertainment destinations, games, physical and digital merchandise, and select strategic partnerships and investments. The group has developed multiple stage productions – including La La Land and Nashville heading to Broadway, and The Hunger Games and Wonder – integrations with marquee games (Call of Duty, Dead By Daylight, Roblox, and Fortnite), and collaborations with best-in-class consumer products licensees (LEGO, American Classics, Hot Toys, Funko, and more). Attractions based on Lionsgate’s top franchises The Hunger Games, John Wick, SAW and other iconic IP can be found at theme parks and destinations in Asia, the United States, United Kingdom, and the Middle East, with the JOHN WICK EXPERIENCE now open in Las Vegas.

 Google Earth satellite image showing a freshly deforested location of a future military outpost in July 2023.
 Google Earth satellite imagery showing the construction of a future military outpost in July 2023. A convoy of vehicles, seemingly part of the Turkish Armed Forces, is captured next to a group of people on the grounds of a helipad.

 Image showing roads connecting military outposts in the Kurdish region North of Amediye. Source: Google Earth, July 2023.





 REUNITING FOR ONE LAST SHOT AT GREATNESS, AN ALL-FEMALE E-SPORTS TEAM FIND THEMSELVES INA VICIOUS BATTTLE FOR THEIR VIRTUAL LIVES IN THIS HIGH-STAKES DIGITAL THRILLER
 PREMIERES VIA VOD, LEADING DIGITAL PLATFORMS AND FILM MOVEMENT PLUS ON NOVEMBER 13, 2026




 FOLLOW FILM MOVEMENT