Tag Archives: interest rates

Cracks In Future For Canada Retirement Income

“Warning signs include declining private-sector pension coverage and the gradual erosion of Old Age Security’s income-replacement role, as benefits indexed to inflation fall behind wage growth.” C. D. Howe Institute
  • Canada’s retirement income system has generally served seniors well. Average income replacement rates remain high, poverty among seniors is low, and seniors’ median net worth has more than doubled in real terms since 1999.
  • But cracks are emerging. Public and private pensions now replace 10 percentage points less of pre-retirement income than two decades ago, low replacement rates are becoming more common among lower-middle earners, private-sector pension coverage is declining, and OAS is steadily losing ground as a source of income replacement.
  • The authors argue that Canada should rethink how the system delivers income replacement and poverty protection. They propose exploring a targeted “Canadian seniors benefit” combining OAS and GIS, shifting OAS’s income-replacement role to an expanded CPP/QPP, and strengthening employer-based retirement savings for workers without workplace pensions.

The authors wish to thank Xavier Dufour-Simard and Francois Laliberté-Auger for their assistance in carrying out some of the analyses contained in this paper. The authors also extend their gratitude to Sebastien Betermier, Colin Busby, David Dodge, Malcolm Hamilton, Sarah Hobbs, Abid Kazmi, Sébastien LaRochelle-Côté, Alexandre Laurin, Bernard Morency, James Pierlot, William B.P. Robson, Allan Shapira, Richard Shillington, John Stapleton, Michael Veall, and several anonymous referees for valuable comments and suggestions. The analyses contained in this paper were carried out at the Quebec Inter-university Centre for Social Statistics (QICSS), a member of the Canadian Research Data Centre Network (CRDCN). The activities of QICSS are made possible by the financial support of the Social Sciences and Humanities Research Council (SSHRC), the Canadian Institutes of Health Research (CIHR), the Canada Foundation for Innovation (CFI), Statistics Canada, the Fonds de recherche du Québec and all the Quebec universities that contribute to their funding. Conclusions, interpretations, and possible errors remain our own.

Introduction

Over the past decade, there has been little investigation into how seniors are faring with respect to the retirement system’s two key objectives: helping individuals sustain their standard of living in retirement (income replacement) and protecting them from financial hardship at older ages (poverty alleviation).

This stands in contrast to the rich policy discussion that led to the 2016 federal-provincial agreement to enhance the Canada (and Quebec) Pension Plan (CPP/QPP). Discussions focused on several major developments. The arrival of the first cohorts with full CPP/QPP earnings histories had helped lower poverty among seniors (Milligan 2008). Increased generosity in the Guaranteed Income Supplement (GIS) and CPP/QPP also contributed significantly to declining poverty rates (Schirle 2013). As Veall (2008) argued, the retirement income system was largely accomplishing its poverty alleviation objective. On income replacement, the debate leading to CPP/QPP enhancement made clear that overall rates were high in the population (LaRochelle-Côté et al. 2008; Ostrovsky and Schellenberg 2009). However, mid-earners without employer pension coverage were most at risk because public pensions offer relatively low replacement rates for them1Throughout, “public pensions” refers to the first two pillars of the system – OAS/GIS and CPP/QPP – and not to employer pension plans for public-sector workers, which belong, like private-sector plans, to the third pillar. (Ostrovsky and Schellenberg 2010). That extensive discussion took place less than two decades after another successful CPP/QPP reform took effect in 1998 (Little 2008).
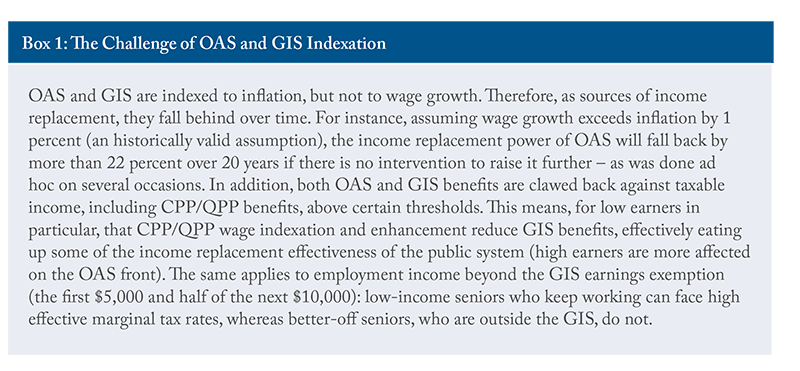
Since the discussions leading to the 2016 agreement, much has occurred, including a pandemic, a surge in inflation, and significant financial market fluctuations. Although the CPP/QPP multi-decade expansion has been rolling out effectively, retirees have faced setbacks elsewhere. The continuing decline in defined benefit (DB) plan coverage in the private sector has turned off the “automatic pilot” for many workers’ retirement savings. Meanwhile, Old Age Security (OAS) and the GIS continue to protect against poverty despite the recent inflation surge because they are indexed to prices. But they are losing ground as sources of income replacement. Unlike CPP/QPP, whose benefits at retirement reflect wage growth over a worker’s career, OAS and GIS amounts are only indexed to prices and fall behind wage growth (see Box 1). Future retirees who rely heavily on OAS/GIS will therefore see lower replacement rates than today’s retirees. These trends suggest that Canada’s retirement income system risks falling behind.

Because of the importance of the retirement income system and the growing size of the senior population, public claims abound that seniors cannot make ends meet, live in poverty, or struggle with the cost of living. These sentiments are often behind proposals to further expand pension coverage and to increase benefits for older Canadians, such as OAS. There are also those advocating the opposite; namely, that retired babyboomers fare much better than prior generations of retirees and that, as a result, OAS should be curtailed for higher-income earners and left to play only a poverty alleviation role, potentially freeing up financial resources for other uses.

This Commentary, drawing heavily on Boisclair et al. (2025a), has two aims.

  • First, it investigates the financial outcomes of seniors over two decades (2002 to 2022), comparing their retirement incomes to prior earnings and taking a look at household balance sheet data. It finds that seniors have, on average, fared rather well financially, both in terms of flows (income/consumption) and of stocks (net wealth).
  • Second, the paper illustrates and acknowledges the changes in income composition and income replacement at older ages in recent decades – in particular, decreasing private sector pension coverage and a retreating role of the first pillar (OAS/GIS) of the retirement income system. It then discusses some options to reform the system and refocus it on its objectives.

Data Sources to Assess Seniors’ Financial Situation

To evaluate whether the retirement income system met its objectives in the past 20 years, we mainly rely on Statistics Canada’s Longitudinal Administrative Databank (LAD). The LAD offers detailed financial information derived from the tax records of 20 percent of the Canadian population. It allows us to obtain precise income measures at multiple points over a taxpayer’s lifetime and provides information on household composition. As a complement, we use Statistics Canada’s Survey of Financial Security for balance-sheet analysis. Both datasets are subject to substantial lags: LAD data are available through 2022 and SFS data through 2023. Readers should keep these lags in mind when interpreting our findings.

When inflation peaked in 2022, interest rates rose sharply, and housing prices fell from their peak in some major markets, while financial markets rose strongly. Because public pensions are indexed to prices, seniors’ income from OAS, GIS, and CPP/QPP was largely protected; financial and pension assets have generally grown; housing wealth, by contrast, may be somewhat overstated for owners in the most affected markets.

Poverty alleviation: With respect to poverty alleviation, we use key measures of poverty that can be constructed with tax data. As is clear from the literature, there is no single perfect measure of poverty (Government of Canada 2018). We mainly use the low-income cut-offs, after tax (LICO-AT) measure, created by Statistics Canada. The LICO-AT has not been updated since 1992 and relies on meeting expenditures on housing, food, and clothing but does not account for the growing share of expenditures on transportation and communications (Noël 2017).2 But it is easily computable from LAD data.

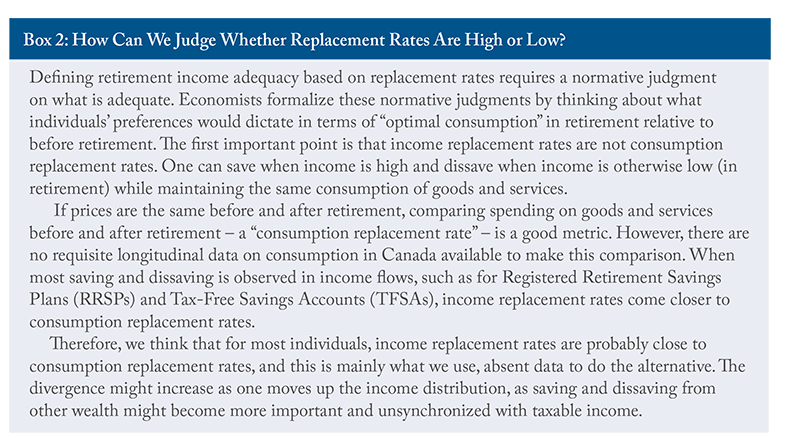
Income replacement: To evaluate the retirement income system in terms of income replacement, we calculate replacement with a measure of pre- and post-retirement income at some given ages. For this analysis, we define pre-retirement income as the average income in the age range 50 to 54, so as not to rely on a single year of income in the denominator of the replacement rate.3 We define the post-retirement window as the tax year in which the taxpayer turns 70.4
Income Replacement in Retirement

Family replacement rates (RR) on average are high, ranging from 80 percent to 90 percent (Figure 1).5 They increased by almost 10 percentage points (pp) between the 2002 and 2014 cohorts, before declining to roughly their levels at the beginning of the period. That hump-shaped pattern is mostly the result of changes in the denominator: pre-retirement earnings (at ages 50-54) declined slightly in real terms for cohorts turning 70 up to 2012, then rose by about 10 percent between the 2016 and 2022 cohorts (Boisclair et al. 2025a).
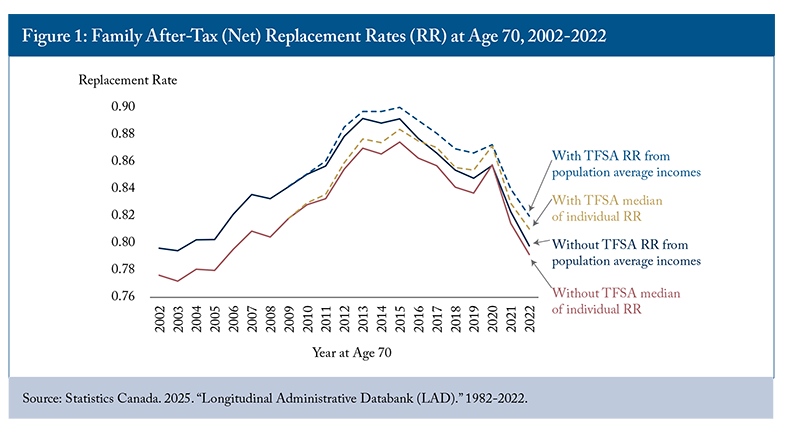
Retirement incomes, by contrast, increased steadily over the period. Including TFSA net withdrawals as income increases the RR by only 2 to 3 percentage points, with little effect on replacement rates, although this could change as TFSA use increases. Replacement rates are higher on an after-tax basis, since tax rates are lower at older ages due to several tax measures and to the progressivity of the income tax schedule.6

Figure 2 shows that despite similar gross replacement rates, individual incomes at age 70 have changed composition over the past decades.7 Public pensions, defined as the sum of OAS/GIS and CPP/QPP, are a very important source of income for seniors on average, but the share of pre-retirement income they replace has been declining from 31 percent of total pre-retirement income in 2002 to 27 percent in 2022. We observe a similar declining trend for private pension income (27 percent to 21 percent).8 What may seem surprising is that private pension income is declining for these cohorts, but changes to Registered Retirement Income Funds (RRIFs) over time could explain at least part of this phenomenon. Overall, public and private pension incomes have gone down from representing 58 percent of pre-retirement income to 48 percent, a drop of 10 percentage points in less than 20 years. This is a large drop coming from the three pillars of the retirement income system.
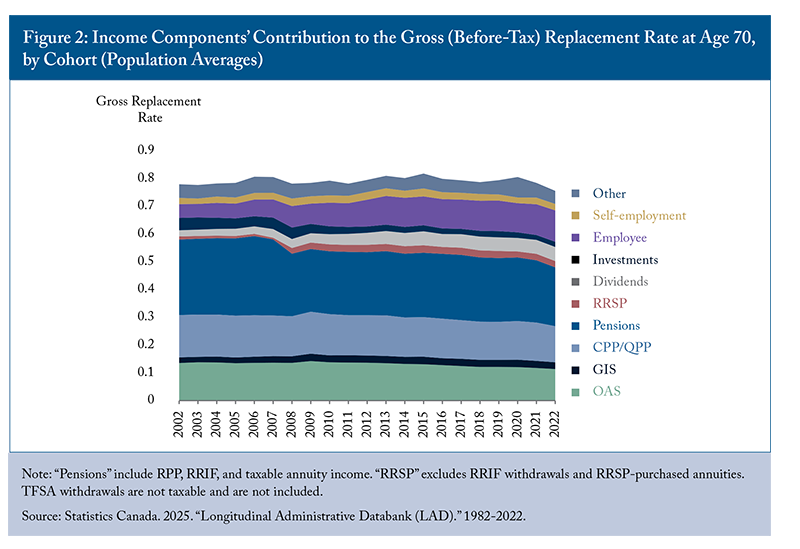
If the contribution of these sources to replacement is falling, what is keeping gross replacement rates constant? A closer look reveals that gross replacement rates do not decline accordingly because of an increase in several other income sources, notably employment (+6 pp), dividend (+3 pp), and RRSP (+1 pp; excluding RRIFs and RRSP-purchased annuities) income. Employment income at 70 is not concentrated among the better off: relative to pre-retirement income, it contributes more to replacement in lower deciles (14 pp in the third decile versus 9 pp in the eighth in 2022), although it forms a larger share of retirement income in the top decile (Boisclair et al. 2025a, Table 3).9 We also observe a decline in investment income (-3 pp), which could reflect the growing importance of tax-favoured savings vehicles (RRSPs and TFSAs) over time. One can conclude that there is more diversity in income sources at age 70 than there was 20 years ago and that traditional retirement income, coming from public and private pensions, has eroded substantially as a percentage of pre-retirement income.
Income Replacement Across Income Groups

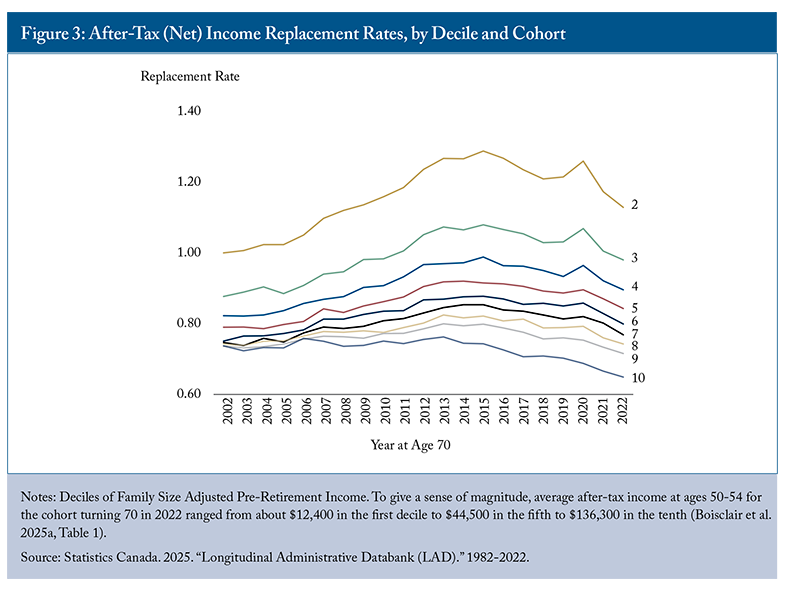
Replacement rates from public pensions decline as income rises, a well-known feature of Canada’s retirement income system. To examine how this relationship is evolving, we divide the income distribution into cohort-specific deciles of pre-retirement after-tax income and compute the RR for each decile over time. The RR for the first decile hovers around 2 and is omitted to enhance readability (Figure 3). This means that someone in the first decile sees their real after-tax income double at age 70 relative to ages 50-54. Replacement rates are thus very high at the bottom of the income distribution.
The RRs generally decrease as pre-retirement income increases. At the very top (10th decile), the replacement rate remains above 60 percent. Because saving and dissaving outside registered accounts matters more at higher incomes, income replacement rates are a less reliable guide to consumption replacement in the upper deciles, and relatively low rates there are not necessarily a sign of inadequacy. Most deciles increase until 2014 to 2016, followed by a decrease of a similar magnitude. Deciles 2 and 3 exhibit no net variation from 2002 to 2022, whereas higher deciles have positive net variations, ranging from 3 percentage points (decile 4) to 6 percentage points (decile 7) over the entire period. The only decile that sees a net negative variation is the 10th (highest earners), whose RR drops by almost 6 percentage points over the period. The decrease for this decile again reflects faster growth in pre-retirement income from 2016 onward, suggesting that this group is faring increasingly well before retirement and is therefore of less concern from a retirement-income policy perspective.

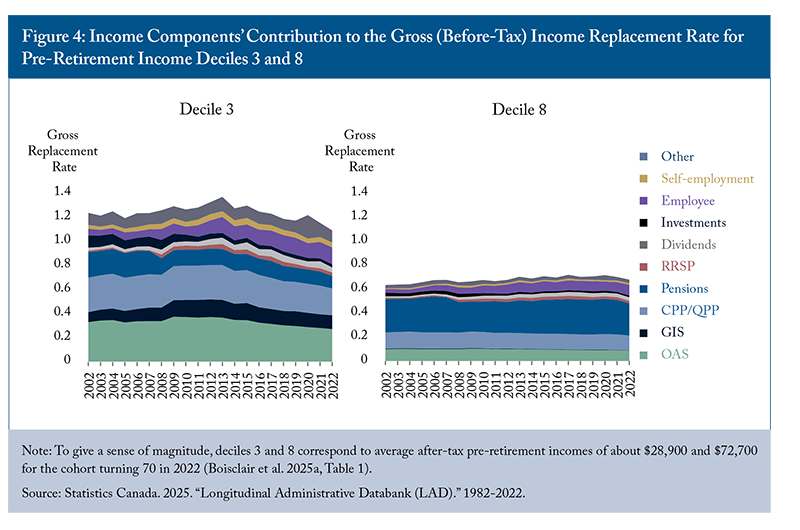
Figure 4 illustrates the difference in gross RR magnitude between the ends of the income distribution. The graph shows how lower deciles depend on public pensions (OAS, GIS, and CPP/QPP), which replaced almost 80 percent of their gross income in the early 2010s. On the other hand, the upper deciles rely a lot more on private pensions (including RRIFs). We observe in the decile 3 that public pensions have not followed the increase in pre-retirement income, resulting in a decreased contribution to the gross RR by more than 19 percentage points over the 2013-2022 period (from 80 percent to 61 percent). This trend is much less pronounced for the 8th decile, where the decline is 2 percentage points (23 percent to 21 percent) over the same period. This suggests that the deteriorating income replacement function of the public pension system is disproportionately affecting lower-income taxpayers. Overall, this leaves the bottom of the distribution most vulnerable to the erosion of public pensions and the top to the retreat of Registered Pension Plans (RPP).

Averages also mask dispersion within deciles. The share of taxpayers with replacement rates below 60 percent – a level that is hard to reconcile with standard consumption-smoothing preferences – rose by 7 to 13 percentage points across cohorts in deciles 3 to 5, and up to a third of seniors below the median have low replacement rates (Boisclair et al. 2025a). Earlier work with the same data shows that low replacement rates are concentrated among middle earners without employer pension coverage (Ostrovsky and Schellenberg 2010).

Poverty Protection in Retirement

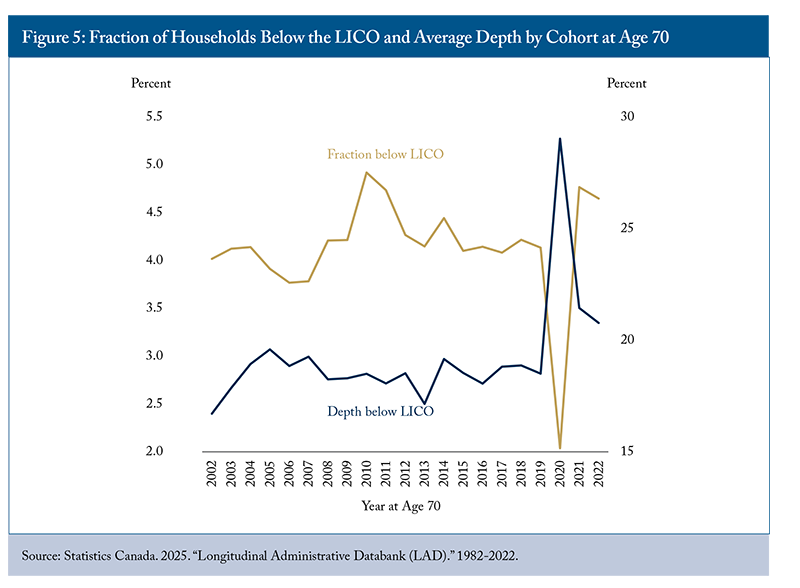
We find that the fraction of retired seniors below the LICO-AT is low (about 4 percent) and has remained very stable over cohorts, abstracting from the effect of the pandemic. The average depth, or shortfall, below the LICO over the period is also stable at around 18 percent (Figure 5). Thus, very few seniors fall below an absolute low-income threshold such as the LICO: Canada has been highly successful in protecting seniors from very low incomes. The same cannot be said for all Canadians, namely youth and working-age adults, however.

By comparison, in 2024, 5.4 percent of seniors lived below Canada’s official poverty line (the Market Basket Measure), compared with 11.5 percent of children and 12.6 percent of adults aged 18 to 64 (Statistics Canada, Table 11-10-0135-01). The dip in the low-income rate for 2020 is probably a reflection of larger transfers to households, such as the Canada Emergency Response Benefit (CERB). Overall, poverty rates are low among seniors because of the combined effect of OAS and GIS.10 In this light, it is notable that so much of the policy discussion revolves around poverty alleviation, when the erosion of the income replacement role of OAS is well underway and should be a cause for concern.

The Balance Sheet of Seniors

Income flows can be different from spending flows. When income flows include withdrawals from RRSPs and TFSAs, one also captures spending coming from the decumulation of these accounts (unless these monies are then transferred to taxable savings or to another investment use). This is therefore a good proxy, as argued above, but this will not include decumulation from other accounts and, more generally, consumption out of wealth. This can be important since a wealthy individual or household with a modest income may be better off financially, and spend more, than a counterpart with a high income but no wealth.
The most comprehensive source of data currently available on wealth holdings is Statistics Canada’s cross-sectional Survey of Financial Security (SFS).11 Since this is not longitudinal data, Table 1 shows cross-sectional statistics over time in constant 2023 dollars for households aged 65 and older. Specifically, the table reports both the proportion of households holding various types of assets and debts as well as the median value among households with positive balances. Median total assets and median net worth are also included and are calculated across all senior households, including those with zero or negative net worth. Conditional medians for individual assets cannot be added up to obtain the totals.
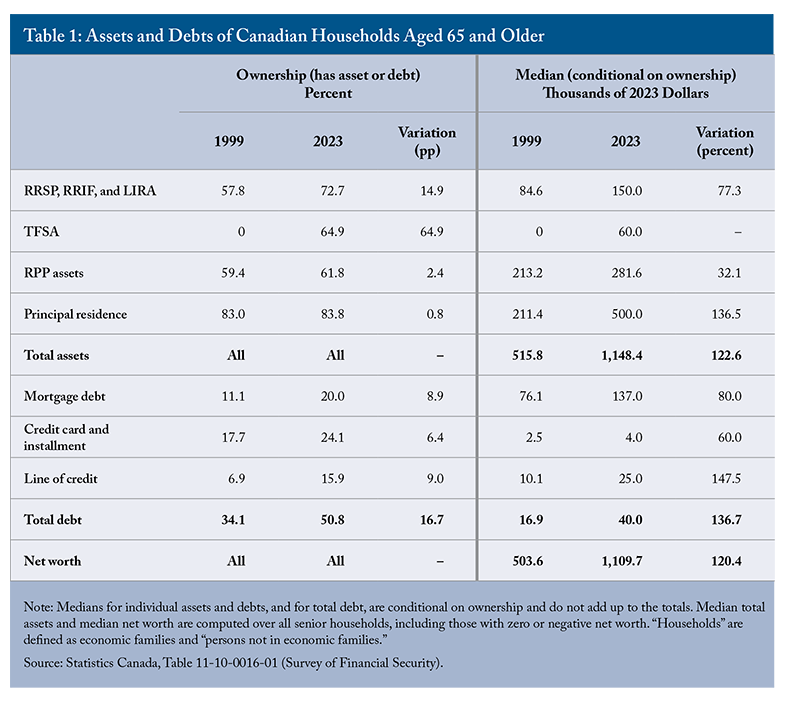
The median household net worth (assets minus debt) of those age 65+ has risen from $503,600 in 1999 to $1.1 million in 2023, or by 120 percent. This doubling over 24 years is a significant increase in the potential living standards of seniors. Of course, there is considerable dispersion, but the median senior household has a very high net worth. The share of seniors with RRSP assets rose from 57.8 percent to 72.7 percent, while the median value of those assets increased substantially, by more than 77 percent in real terms. TFSAs were introduced in 2009, and by 2023, 65 percent of households with at least one member aged 65 or older held TFSA assets, with a median value of $60,000. Importantly, while the share of households with RPP assets increased slightly over the period, the median value of those assets increased by 32 percent on average. Overall, traditional retirement savings, through pension plans and tax-favoured saving vehicles, increased substantially over time. Principal residences, held by 83 percent of senior households, also increased substantially in value: the median value among homeowners rose by 136 percent in constant dollars.12

Median debt increased as well by 136.7 percent over the period. But since debt is low relative to assets, its evolution does not significantly impact net worth. A few interesting changes occurred – for example, lines of credit, in particular home equity lines of credit, have more than doubled in prevalence and in median value – but traditional mortgage debt still accounted for the lion’s share of senior debt in 2023. Over the period, the share of households with mortgage debt nearly doubled to one in five (20 percent); households may have been able to borrow more on account of larger assets and rising income, but also lower interest rates (Bédard and Michaud 2021).

On average, seniors now have much higher net worth and financial equity, from which to finance consumption in retirement if they wish to do so. Even though counting home equity probably overstates the increase in net consumption opportunities coming from wealth, the overall portrait is quite positive for many in terms of non-government savings for retirement. However, this may not be available to some who have very few assets (Baldwin 2022). Notably, there is an important divide between homeowners and renters. The divide is stark: among families whose main earner was 55 to 64 in 2023, homeowners with an employer pension had a median net worth of $1.4 million, compared with $11,900 for renters without one (Statistics Canada 2024). Household type matters as well: seniors living alone, many of them widowed, had a median net worth of $475,900 in 2023, less than half that of senior families. Further complicating the interpretation of wealth differences is the increase in the average length of the retirement period, implying that one needs more financial wealth to sustain a given regular flow of consumption expenditures in retirement.

The Policy Challenges Ahead

To summarize the findings for policy, we must first note that the bottom income deciles rely on the public system (OAS, GIS, and CPP/QPP), while above the median, RPPs and other private retirement savings account for a much larger share. Hence, two issues warrant attention: 1) the future evolution of public pensions and its impact on the bottom deciles (and, perhaps less importantly, higher deciles due to CPP/QPP enhancement); and 2) the evolution of RPPs and other retirement savings arrangements and their impact on the replacement rates of individuals above the median. We discuss each in turn.

The Eroding Income-Replacement Role of OAS/GIS

With price indexation instead of wage indexation, the income replacement role of OAS/GIS has been slowly eroding, as indicated by Figure 2 – especially so for lower deciles, as shown in Figure 4. The 10 percent increase in OAS for those aged 75 and over introduced in 2022 partly offset this erosion for older seniors, but did not change the underlying indexation mechanism. And without further intervention, this will continue in the future, reducing OAS’s income replacement value by more than 22 percent over 20 years if real wage growth is 1 percent above inflation. The CPP/QPP expansion already underway will barely offset this decline in aggregate – roughly offsetting it for workers with earnings close to the Year’s Maximum Pensionable Earnings (YMPE), but not for lower earners, whose gains are smaller and partly clawed back through the GIS, while higher earners see a net gain (Boisclair et al. 2025a).

There are several possible options to adapt OAS, including a few known proposals. One would see OAS increase in generosity; another would see it curtailed; and a third would see it reshaped entirely. We review these proposals below as potential options or starting points for further policy discussions.

Option 1: Expand OAS for Those Aged 65-74

This idea was originally put forward in 2021 in a private member’s bill, Bill C-319, which died when the previous Parliament was dissolved. The content of the bill has moved to Bill C-261, which was first read in Parliament on February 9, 2026.13 A 2022 enhancement increased OAS by 10 percent for Canadians aged 75 and over; the current proposal would extend the same increase to Canadians aged 65-74.

We do not think this is the right approach for two reasons. First, an across-the-board increase is poorly targeted: poverty among seniors is now low relative to other age groups, and most of the cost would go to seniors who are not at risk of poverty. Second, it would not solve the underlying problem: a one-time increase restores some income replacement today, but with price indexation the erosion simply resumes, inviting further ad hoc increases. Relying on such raises on top of legislated inflation indexing leaves this important program – perhaps more than others due to its size and salience, as well as its single-government nature – at the mercy of political and public finance pressures.

Option 2: Start OAS Clawbacks at $100,000 of Family Income

A proposal from Generation Squeeze would cut OAS for better-off seniors – effectively lowering the clawback threshold by combining family incomes rather than treating them individually and/or increasing the rate compared to the current situation.14 Using the “family income” concept, contrary to individual income, which is currently the case for OAS clawback, would ensure that single or widowed individuals are not disadvantaged (the current 15 percent clawback starts at an individual income of $93,454 in 2025).

We share the premise of this proposal: any reform that refocuses OAS will, and should, ask more of better-off seniors. Our concern is rather with its design. While this would ease financial pressures on the program while protecting the poverty alleviation function for lower-income seniors, we believe this would come down to turning OAS into a “taxable GIS.” Indeed, the GIS’s very function is to ensure that seniors with little or no income other than OAS are lifted to just above some low-income threshold. It is unclear to us that duplicating this function is the best way forward. While a family-income test avoids disadvantaging single or widowed seniors, it would also end the individual character of OAS. Since its introduction as a universal benefit in 1952, OAS has provided lower-earning spouses – mostly women – with an independent source of income and could discourage couple formation later in life. Moreover, this proposal in itself is incomplete, as it does not address the erosion of income replacement above the median.

Option 3: Create a Canadian Seniors Benefit and Expand CPP/QPP

This proposal was made by one author of this paper in the Financial Post in late 2024 and in L’actualité.15 It would combine OAS and GIS – the OAS supplement – into a more streamlined “Canadian seniors benefit,” aimed solely at poverty alleviation, while only using CPP/QPP to achieve income replacement objectives. Canada has taken a similar approach elsewhere, for example with the Canada child benefit (CCB). This option has two distinct components: (a) replacing OAS and GIS with a targeted, federally funded “Canadian seniors benefit”; and (b) expanding CPP/QPP benefits, financed by higher contributions from workers and employers, to take over the income replacement function currently played by OAS. The two components fall under different jurisdictions – the first is federal, while the second requires federal-provincial agreement – but they are designed to go together: implementing the first without the second would amount to a cut in retirement income for middle-income workers.

More specifically, the idea consists in closing OAS as it currently exists, stripping it of its income replacement function – which has been in constant decline in recent and future decades – and moving its poverty alleviation function to an expanded GIS. The latter, which would become a targeted “Canadian seniors benefit,” would ensure that all seniors have an income at least equal to the low-income threshold. This is similar to what OAS and GIS currently accomplish together for lower-income seniors.

Consider an illustrative design for a single senior. The new benefit could guarantee the current combined maximum of OAS and GIS – about $22,800 a year in late 2026 – and be reduced by 40 cents for each dollar of other income. It would then be fully phased out at about $57,000 of other income between the current GIS cut-off ($23,112) and the OAS recovery threshold ($93,454). The reduction rate would thus be higher than the 15 percent OAS recovery tax but lower than the 50 percent to 75 percent GIS reduction rates, which would also improve work and saving incentives for low-income seniors. An earnings exemption similar to the current GIS one should also be preserved. Parameters for couples would need to be set separately. The first pillar would thus become a pure anti-poverty transfer program.

Such a redesign would have important distributional consequences, which hinge on a key difference between the two programs: OAS and GIS benefits depend on residence and current income, whereas CPP/QPP benefits depend on lifetime earnings. Keeping the new benefit tied to residence and current income is what protects seniors with low incomes, whatever their work history – including many with interrupted employment histories, caregivers, persons with disabilities, low lifetime earners, and immigrants with incomplete Canadian residence – since it would guarantee an income at least equal to the low-income threshold. By contrast, the income replacement function moved to CPP/QPP would accrue in proportion to lifetime earnings. Seniors whose current income places them above the range of the new benefit, but whose lifetime earnings were modest, would therefore lose OAS without an equivalent CPP/QPP gain. This is notably the case of lower-earning spouses in middle-income couples, often women, for whom OAS is currently an individual source of income; income testing on a family basis would remove it, unless the design preserves some individual entitlement.16

In any case, substantial savings would ensue for the federal government since OAS payments (excluding GIS) are planned to total nearly $68 billion in 2026/27. The actual size of the savings will depend on the specific parameter values for the redesigned “Canadian seniors benefit” and on the transition (see below), but would eventually amount to tens of billions of dollars a year. Then, a parallel increase in contributions would enhance CPP/QPP benefits to take over the income-replacement function of OAS. As a purely illustrative order of magnitude, replacing the maximum OAS pension for a worker with career earnings at the YMPE would require about 3 percentage points of additional contributions, split between employees and employers, on a fully funded basis.17This would effectively move the income replacement function of OAS “off-budget,” within a plan with strong governance, and bring it together with the rest of earnings-related income replacement in CPP/QPP. How this expansion is financed matters as much as its size. A fully funded expansion, like the one introduced in 2019, is fair across generations but takes about 40 years to mature, which, if OAS were closed at the same time, would leave middle-income workers retiring in the interim with neither OAS nor much additional CPP/QPP. A partially funded (pay-as-you-go) component would allow benefits to be paid sooner at the cost of transfers from future contributors.

Transition is the main challenge. Many workers have planned their retirement around OAS, and closing it abruptly would impose large and unforeseen losses on those who have already retired or are close to retirement – a retiree with $41,000 in income from a defined benefit pension and full CPP would lose about 15 percent of income – while a fully funded CPP/QPP enhancement would take decades to mature. The two must therefore move in step: OAS would remain in place for current retirees and cohorts close to retirement and be phased out gradually for younger cohorts as their CPP/QPP entitlements build up, with long advance notice. The CPP/QPP phase-in could also be accelerated, through two sources that can be combined: drawing on part of the assets accumulated in the base CPP and QPP and using part of the federal savings from closing OAS, for instance, to finance a partially pay-as-you-go component. Both involve transfers across generations to be weighed against the higher contributions they would imply later, and the latter would make federal savings correspondingly smaller in the short run. Beyond the transition, governments could decide whether to use the savings to lower taxes, reduce debt, or fund other priorities.

Clearly, such a major change would require careful and demanding coordination between the federal and provincial governments, at least with respect to the CPP/QPP part. Although such coordination is always a challenge in Canada, it is not unheard of. This is evidenced by the two important rounds of changes to CPP achieved in the past 30 years: in particular, the 1998 reform and the 2016 agreement to enhance the CPP; and by the contribution rate cuts announced in the federal Spring Economic Update.18 Cancelling those rate cuts could indeed be part of a broader remodelling under this option.

The Retreat of Private-Sector Pension Coverage

The landscape is changing rapidly for RPPs. Coverage in the private sector has eroded from an already low level, despite high hopes when Canada’s retirement system was established: 35 percent of private sector workers were covered in 1980, compared with fewer than one in four today (Boisclair et al. 2025a) – and only about 17 percent of core-age private-sector workers after correcting for double counting in official statistics (Dostie and Morris 2025). The quality of coverage has declined as well: in 1980, 90 percent of covered private-sector workers had a defined benefit plan, compared with 41 percent in 2023, so that fewer than one in 10 private-sector workers now has access to a DB pension (Boisclair et al. 2025a).19 As discussed, this is particularly concerning for above-median earners.

Although the primary goal of the CPP/QPP expansion currently underway was to cover workers without RPPs, this may translate into higher replacement rates for those with DB RPP coverage. Indeed, many public sector DB plans do have a so-called “integrated” structure with CPP/QPP20 – but it is too early to tell how many DB plans will have accounted for the CPP/QPP enhancement in the medium- to long-term.

However, middle- and higher-income earners without pension coverage have long been the group most at risk of inadequate income replacement. While solutions may exist to increase pension or retirement savings coverage for this target group, most are difficult or costly to implement or politically unpopular. For instance, a recent proposal in a C.D. Howe Institute Commentary (Ambachtsheer and Mazer 2026) suggests subsidizing small businesses to offer employee pensions. While this may help since cost is often a major concern for employers considering a pension plan, administrative burdens remain, and the subsidy could provide windfall gains to employers that would have offered a plan anyway. Furthermore, the very low take-up of Pooled Registered Pension Plans (PRPPs) illustrates that a stronger approach is required.

Quebec’s approach under its law on Voluntary Retirement Savings Plans (VRSPs), which requires employers to offer a basic savings plan with auto-enrolment, seems to be going in the right direction. Indeed, we have recently found that the law has resulted in increased savings in VRSPs but also in RRSPs and TFSAs (Boisclair et al. 2025b). However, enforcement is currently limited, and employer contributions remain voluntary, hampering more significant progress. Moreover, all workers are enrolled in the plans, even lower-income workers who might not benefit much or for whom an RRSP-type plan might even reduce future GIS benefits. In its most recent budget, the Quebec government has announced that it would study options to strengthen VRSPs, including a possible public VRSP managed by an independent organization, similar to the National Employment Savings Trust (NEST) in the UK.

If we are to address the income replacement gap for the target group, strengthening employer-based solutions will be needed to avoid an even larger CPP/QPP expansion than the one already underway and the one following the folding of OAS, based on option 3 above.

Conclusion

The evidence presented in this paper and elsewhere suggests that, on average, Canadian seniors have fared relatively well in recent decades and that the retirement income system has so far met its objectives in aggregate, both in overall income replacement and poverty protection. While some seniors continue to face hardship, this conclusion may surprise many and contrasts with the broader narrative of widespread financial difficulty among seniors.

Against this backdrop, the evidence also points to weaknesses that are already visible and likely to deepen:

  • public and private pensions now replace 10 percentage points less of pre-retirement income than they did two decades ago;
  • low income-replacement rates are becoming more frequent among lower-middle earners;
  • private-sector RPP coverage keeps declining; and
  • the income replacement function of OAS continues to erode and is not fully offset by the CPP/QPP expansion underway.

To date, other income sources – notably employment – have filled the gap, but they cannot be relied upon in the same way as pensions. One way forward, which we do not favour, would be to keep adjusting OAS on an ad hoc basis. Or Canada could, as we suggest, reshape OAS by folding its limited income replacement function into the CPP/QPP and merging the rest with GIS to create a “Canadian seniors benefit” that focuses solely on poverty reduction.

For income replacement above the median, private-sector RPPs and other employer-sponsored retirement savings arrangements could help bridge the growing gap, given their apparent value to workers (Dostie and Morris 2025). The enhanced CPP/QPP may also prove sufficient for this group following the current expansion and any changes that may come with the remodelling of OAS/GIS. If not, Canada could complement this approach with an “improved VRSP-like” system in which employers are encouraged or mandated to play a stronger role – as was always intended in the design of Canada’s retirement income system – or expand CPP/QPP even further still, this time above a certain level of earnings. In all scenarios, it is time to revisit Canada’s retirement income system.

For the Silo, Pierre-Carl Michaud and David Boisclair.

References

Ambachtsheer, K., and A. Mazer. 2026. Spreading the Benefits: A Targeted Tax Credit Is Needed to Expand Retirement Plan Coverage in Canada’s Private Sector. Commentary 704. Toronto: C.D. Howe Institute. https://cdhowe.org/publication/spreading-the-benefits-a-targeted-tax-credit-is-needed-to-expand-retirement-plan-coverage-in-canadas-private-sector/.

Baldwin, B. 2022. “The Evolving Wealth of Canadians: Who Is Better Fixed for Retirement? Who Is Not?” E-Brief. Toronto: C.D. Howe Institute. https://cdhowe.org/publication/evolving-wealth-canadians-who-better-fixed-retirement-who-not/.

Bédard, N., and P.-C. Michaud. 2021. “Playing with Fire? Household Debt near Retirement in Canada.” Canadian Public Policy / Analyse de politiques 47(1): 56–71. https://www.jstor.org/stable/27034142.

Boisclair, D., X. Dufour-Simard, and P.-C. Michaud. 2025a. “Retirement Incomes in Canada: Past, Present and Future.” Retirement and Savings Institute (RSI) Working Paper 19. September. https://ire.hec.ca/en/19-retirement-incomes-in-canada-past-present-and-future/.

______________. “La Loi RVER a-t-elle augmenté l’épargne des travailleurs au Québec?” Jacques-Parizeau Research Chair in Economic Policy Working Paper 5. October. https://cjp.hec.ca/en/5-la-loi-rver-a-t-elle-augmente-lepargne-des-travailleurs-au-quebec/.

Dostie, B., and T. Morris. 2025. “The Labour Market Impacts of Employer-Pension Plans.” Retirement and Savings Institute (RSI) Working Paper 18. August. https://ire.hec.ca/en/18-the-labour-market-impacts-of-employer-pension-plans/.

Financial Services Regulatory Authority of Ontario (FSRA). 2026. “Workplace Pension Membership Increases in Ontario, but Many Could Benefit from Additional Planning Steps.” News release. March. https://www.fsrao.ca/announcements/workplace-pension-membership-increases-ontario-many-could-benefit-additional-planning-steps.

Government of Canada. 2018. Canadian Poverty Reduction Strategy: What We Heard about Poverty So Far. Ottawa: Employment and Social Development Canada. https://www.canada.ca/en/employment-social-development/programs/poverty-reduction/reports/what-we-heard.html.

LaRochelle-Côté, S., J. Myles, and G. Picot. 2008. Income Security and Stability during Retirement in Canada. Analytical Studies Branch Research Paper Series 306. Statistics Canada.

Little, Bruce. 2008. Fixing the Future: How Canada’s Usually Fractious Governments Worked Together to Rescue the Canada Pension Plan. Toronto: University of Toronto Press. October.

Milligan, K. 2008. “The Evolution of Elderly Poverty in Canada.” Canadian Public Policy / Analyse de politiques 34(Supplement 1): S79–S94. https://doi.org/10.3138/CPP.34.4.S79.

Noël, Alain. 2017. “How Do We Measure Poverty?” Policy Options. November 9. https://policyoptions.irpp.org/2017/11/how-do-we-measure-poverty/.

Ostrovsky, Y., and G. Schellenberg. 2009. Pension Coverage, Retirement Status, and Earnings Replacement Rates among a Cohort of Canadian Seniors. Analytical Studies Branch Research Paper Series 321. Statistics Canada. https://www150.statcan.gc.ca/n1/en/catalogue/11F0019M2009321.

______________. 2010. A Note on Pension Coverage and Earnings Replacement Rates of Retired Men: A Closer Look at Distributions.

Schirle, T. 2013. “Senior Poverty in Canada: A Decomposition Analysis.” Canadian Public Policy / Analyse de politiques 39(4): 517–540. https://doi.org/10.3138/CPP.39.4.517.

Statistics Canada. 2024. “Survey of Financial Security, 2023.” The Daily. October 29. https://www150.statcan.gc.ca/n1/daily-quotidien/241029/dq241029a-eng.htm.

Veall, M. R. 2008. “Canadian Seniors and the Low Income Measure.” Canadian Public Policy / Analyse de politiques 34(Supplement 1): S47–S58. https://doi.org/10.3138/CPP.34.SUPPLEMENT.S47.

Wolfson, M. 2011. Projecting the Adequacy of Canadians’ Retirement Incomes. Institute for Research on Public Policy. https://irpp.org/research-studies/projecting-the-adequacy-of-canadians-retirement-incomes/.


Car Shopping. Should You Buy New Or Used? Let Us Help You Decide.

The car shopping market is presenting drivers with the same classic dilemma: should you buy new or used? But, there are modern-day considerations as several factors and current events shape this debate, including depreciation trends, interest rates and price shifts in both new and used car markets. Making the right choice requires a close look at your financial situation and ownership goals.

Our friends Zach & Ray Shefska, Co-Founders of CarEdge, offer an easy-to-understand breakdown to help consumers make this all-important decision that will impact them for years to come.

When to Buy New:

  • You plan to keep the car for 5+ years and want the latest features.
  • You qualify for low APR financing and want predictable monthly payments.
  • Manufacturer incentives significantly reduce the cost.
  • To avoid depreciation altogether, consider leasing a new car.

When to Buy Used:

  • You want to avoid rapid depreciation and pay less upfront.
  • You’re willing to shop for 3-5 year-old vehicles in good condition.
  • You don’t mind driving a car with fewer bells and whistles.
  • You’re prepared to negotiate a great used car deal.

Here are details on some of the key considerations to help you determine whether buying new, buying used, or leasing makes the most sense for you.

Financing Deals Versus Depreciation Risks

New cars are known for their steep depreciation. A new car can lose 20-30% of its value within the first two to three years of ownership. However, buying new has its advantages, too. Manufacturer incentives are sweetening the deal for buyers with attractive lease offers, low APR financing, and cash incentives that simply aren’t available for used car buyers.

Why Buy New?

  • Incentives Galore: Automakers are offering competitive promotions to attract buyers, including 0% APR financing and cash-back deals.
  • Peace of Mind: New cars come with full warranties, the latest safety features, and no concerns about wear and tear from previous owners.
  • Custom Orders: Buying new allows you to select the exact trim, color, and features you want. However, custom orders can come at an even higher price.

Drawbacks of Buying New:

  • Higher Initial Cost: Even with incentives, new cars come with higher upfront prices compared to used options.
  • Depreciation Risk: If you plan to sell your car in less than five years, you’ll likely face a significant financial loss due to depreciation.
  • If you’re considering a new car but worry about depreciation, leasing may be a better option for you. It allows you to enjoy the benefits of driving new without the financial impact of resale value losses.

Interest Rates Matter – New Cars Have Lower Rates

Interest rates are a defining factor in the new versus used car debate. While borrowing costs remain high, automakers make it easier to finance new cars by offering low APR financing. Used car loans, on the other hand, often come with higher interest rates from banks and credit unions.

Why New Cars Win on Interest Rates:

  • Lower APR Offers: Many manufacturers are advertising rates as low as 0% APR for new car buyers, helping you save thousands over the life of the loan.
  • Better Loan Terms: Lenders tend to offer more favorable terms for new cars compared to used, including longer loan periods and lower down payment requirements.

Used car loans typically come with interest rates about 5% higher than those for new vehicles. Over a five-year loan term, this can significantly increase the total cost of financing a used car. If monthly payments are a concern, financing a new car with low APR may actually make more financial sense.

However, NEVER negotiate monthly payments – always negotiate the Out-the-Door Price to avoid add-ons and ripoffs.

New Tools Make Negotiating Easier Than Ever

The days of guessing what to pay for a new car are over. Today, buyers have access to tools that provide insight into dealer pricing, invoice costs, and manufacturer incentives.

How to Save Big When Buying New:

  • Use Dealer Invoice Pricing: This allows you to see what the dealer pays for the car and giving you leverage in negotiations.
  • Keep Up With Local Market Trends: Today, any car buyer in America can see the ins and outs of their local car market for each make and model..
  • Compare Offers Across Dealers: With free online tools, you can easily master the art of negotiating. A big part of this is learning how to effectively cross-shop between dealerships. Always compare prices and incentives from multiple dealerships to ensure you’re getting the best deal.
  • Leverage Manufacturer Incentives: Research available incentives to maximize your savings before heading to the dealership. We gather the best incentives in one spot for you.

These tools make it easier than ever to negotiate confidently and secure the best deal on a new car. That said, deals can still be hard to come by without the right negotiating tools.

Why Consider Buying Used?

  • Lower Upfront Costs: Used cars are more affordable than their new counterparts, making them a better choice for budget-conscious buyers. Saving $100 or more on monthly payments over five to six years really adds up!
  • Avoid Steep Depreciation: Buying a 3-5 year-old used car allows you to avoid the steepest depreciation period, saving you thousands. If you decide to sell in a few years, you won’t feel the heavy depreciation that a new car buyer in a similar situation would experience.
  • Used Cars Are Negotiable: As competitive new car incentives remain, fewer car shoppers are heading to the used car lots. A slump in demand is good news for those willing to negotiate used car prices.

Challenges of Buying Used:

  • Higher Interest Rates: As mentioned earlier, used car loans often come with higher APRs, which can offset some of the savings. The average used car loan rate in North America is nearly 14% APR.
  • Limited Incentives: Unlike new cars, used vehicles don’t come with manufacturer promotions or warranties. However, you can get a fair deal on an extended warranty.
  • Condition Concerns: Always get a pre-purchase inspection to avoid surprises with hidden issues.
  • Despite these challenges, buying used is still the go-to option for many drivers who prioritize affordability and don’t mind sacrificing the latest features.

For many car buyers, a 3-5 year-old used car strikes the perfect balance between affordability, reliability, and long-term value. This “sweet spot” in the used car market offers significant benefits that make it a smart choice for budget-conscious drivers who don’t want to sacrifice quality or performance.

Here’s why a 3-5 year-old used car could be the ideal option for you:

  • Avoid Steep Depreciation – New cars typically lose 30-40% of their value within the first three years, making depreciation one of the biggest hidden costs of buying new. 
  • Lower Upfront Costs – Compared to buying new, 3-5 year-old used cars are significantly more affordable.
  • Modern Features Without the Premium – A car that’s 3-5 years old still comes equipped with many of the features found in today’s new models, such as advanced safety systems and driver assistance.
  • Remaining Warranty Coverage (Depending on Mileage) – A 3-5 year-old car is typically well within its prime and often covered by a portion of the manufacturer’s original powertrain warranty. If coverage is about to run out, get an Extended Warranty quote for peace of mind.
  • Better Financing Options Compared to Older Cars – While interest rates for used car loans are higher than those for new cars, lenders generally offer better rates for late-model used cars compared to older vehicles. This makes financing a 3-5 year-old car more manageable and less risky.

How to get the best of ‘both worlds’

By choosing a 3-5 year-old used car, you get the best of both worlds: modern features at a lower price, and the ability to avoid the financial pitfalls of buying new. It’s a smart compromise for car buyers looking for value and reliability. To ensure you’re making a wise investment, always research market trends, request vehicle history reports, and schedule a pre-purchase inspection before buying any used car.

Founded in 2019 by father-and-son team Ray and Zach Shefska, CarEdge is a leading platform dedicated to empowering car shoppers with free expert advice, in-depth market insights, and tools to navigate every step of the car-buying journey.

What Can Be Done About Canada’s Debt Problem?

Presenters at last year’s C.D. Howe Institute’s conference on Canada’s debt problem had some pointed advice for our federal and provincial governments:

  • Canada’s public debt should be reduced about 10 percentage points of Canada’s GDP to ensure fiscal policy can be used to cushion the effects of future economic crises. Since major crises happen frequently, prudence suggests that the target should be achieved before the decade is out.
  • Tax increases harm economic performance, so elimination of public spending that does not provide enough benefits to offset this damage should be the first step in reducing deficits and debt. This will require undertaking comprehensive value-for-money assessments to identify wasteful spending.
  • Post-conference analysis found that achieving this prudent debt target would require increasing the combined federal-provincial primary balance by 1.4 percent of GDP, or $43 billion, starting in 2025/26. This amount includes a buffer – ensuring an 80 percent probability of meeting the debt target – to account for inevitable economic downturns, other crises that raise deficits and debt, and the uncertainty posed by fluctuating interest rates on financing costs.
  • The conference was one of four on deficits and debt held in Canada over the past 40 years. A clear and consistent message from these conferences – which politicians have yet to fully absorb – is that debt has economic costs and, therefore, imposes a burden on future generations. In this Commentary, the authors report on, and offer their analysis of, the findings of the latest conference.

Introduction

Does Canada have a debt problem? The answer from a recent C.D. Howe Institute conference is a resounding “yes.” Canada’s public debt should be about 10 percentage points of GDP lower to ensure sustainability. Given that major crises, which put upward pressure on deficits and debt, happen frequently, this target should be achieved before the decade is out.

The May 2024 conference was one of four on deficits and debt held in Canada over the past 40 years. Each aimed to provide guidance to policymakers on managing deficits and debt. While a common thread was concern about the economic cost of public debt, each conference provided context-specific policy advice.

The first conference, “Deficits: How Big and How Bad?” (Conklin and Courchene 1983), occurred when debt levels were rising rapidly but still relatively low. The key policy issue then was whether fiscal consolidation or expansion to support the economy was appropriate.

In the 1994 conference, “Deficit Reduction – What Pain, What Gain?” (Robson and Scarth 1994), and the 2002 conference, “Is the Debt War Over?” (Ragan and Watson 2004), there were clear recommendations to reduce debt levels. In 1994, this was motivated by concerns over economic damage caused by debt approaching 100 percent of GDP and questions about fiscal sustainability. By 2002, although the debt ratio had fallen substantially, further debt reduction was still advocated to reduce the burden on future generations who will not benefit from the spending.

A combination of discretionary measures and sustained economic growth led to a substantial reduction in the combined federal-provincial debt ratio from 2002 until the global financial crisis of 2007-2009. The debt ratio stabilized at a relatively high level after the crisis until the pandemic. The massive increase in debt during the pandemic and subsequent government spending raised the overall federal-provincial net debt ratio to about 75 percent of GDP, nearing levels from the time of the “Debt War” conference. This surge, combined with concerns about further increases, refocused attention on debt sustainability. This concern was reflected in the May conference, “Does Canada Have a Debt Problem?”, which recommended a debt target based on the need for fiscal prudence.

The latest conference included sessions on the economic costs of debt, the sustainability of federal debt, guidance for policymakers on a prudent and fair debt target, and reforming the federal fiscal framework. However, given the one-day format, not all issues could be thoroughly addressed. This report not only summarizes the proceedings but also fills some gaps by providing additional analysis to complement the presenters’ advice.

Economic Costs of Public Debt

Interest expenses were central to the analysis by University of Calgary economist Trevor Tombe of the economic costs of public debt. Interest paid on the public debt is often considered a transfer among individuals with no real impact on the economy. However, higher interest payments for a given level of program spending necessitate higher taxes, which harm economic performance by affecting incentives to work, save and invest. If not financed by tax increases, higher interest payments will crowd out valued program spending.

When discussing the opportunity cost of interest payments – the benefits of lower tax rates or higher program spending – Tombe cited work by Dahlby and Ferede (2022). They estimate the economic cost of raising an extra dollar of tax revenue, referred to as the “marginal cost of public funds” (MCPF). The MCPF includes both the dollar taken from the private sector and the loss in output per dollar of tax revenue raised due to reduced incentives to work, save and invest. Higher taxes shrink the tax base not only because of reduced economic activity but also due to efforts to reduce taxable income without changing economic behaviour.

Dahlby and Ferede (2022) find a very high cost from raising taxes. For the corporate income tax, the federal MCPF in 2021 was approximately two.1The MCPF from raising the top federal personal income tax rate has been higher than its corporate tax counterpart since 2012, when the corporate tax rate was reduced to 15 percent. The gap increased in 2016 when the top federal marginal personal income tax rate increased to 33 percent, pushing the MCPF to about 2.9.

The federal government expects to pay $54.1 billion in public debt charges in the current fiscal year. The economic cost of these payments is substantial. If the opportunity cost of these payments is lower corporate income taxes, their economic cost would also be about $54 billion. If their opportunity cost is a lower top personal income tax rate, their economic cost would exceed $100 billion. If the contribution from corporate income and top personal income tax were equal, the economic cost would be about $75 billion.

Other costs of public debt arise from a reduction in the national savings rate, which is the sum of public and private sector savings rates. Government deficits represent public sector dissaving, so with a constant private savings rate, national savings will decline when governments run deficits. Tombe highlighted the impact of lower national savings on investment, presenting data showing a negative correlation between debt ratios and investment ratios across countries (Figure 1). He stated there is “probably” a causal relationship between higher debt ratios and lower investment ratios.

Although Tombe did not elaborate, there are reasons to be circumspect about asserting causality. One reason is that the private savings rate may rise in response to budget deficits if economic agents anticipate higher future taxes to service the debt. Households might increase savings in anticipation, partially offsetting the decline in national savings. There is evidence that expansionary fiscal policy is partially offset by increased household savings. Johnson (2004) concluded that household savings would increase by 30-50 percent of the increase in government debt. In a recent study of fiscal expansions in the Euro area from 1999 to 2019, Checherita-Westphal and Stechert (2021) found that 19 percent of a fiscal stimulus is offset by higher household savings in the short-term, rising to 41 percent in the long-term.

Another reason for being cautious about inferring causality is that in an open economy, a decline in national savings does not necessarily lead to lower domestic investment, as any shortfall can be offset by borrowing from abroad. However, interest payments on borrowed funds and the return on foreign-owned capital reduce national income. An additional cost arises because the resulting current account deterioration must be offset by higher net exports, which requires a reduction in real wages in the export sector.

To complement Tombe’s analysis, we present an estimate of the economic cost of reduced national savings. In a closed economy with constant household savings, a budget deficit leads to a dollar-for-dollar crowding out of investment. Using historical returns on capital and assuming that national savings decline by 60 percent of the deficit due to offsetting increases in household savings, the $1,372 billion in federal net debt in the current fiscal year would have an economic cost of about $90 billion.2 This calculation does not capture the impact of lower capital intensity on productivity, so it underestimates the true cost.

If foreign savings offset the decline in national savings and foreigners invest directly in Canada, they receive the return on this capital, so the gross economic cost remains the same. However, the return is subject to corporate income tax, so the net economic cost would be about 25 percent lower. If Canadian firms borrow abroad to finance domestic investment, the economic cost is the interest paid to foreigners. While gross interest payments to foreigners will be less than the return on capital unless there is a large country-risk premium, interest payments are taxed more lightly.3 Therefore, the net economic cost may not differ substantially.

An additional cost of accessing foreign savings arises because higher capital servicing charges put downward pressure on the current account balance, which must be offset by an increase in net exports. In a small economy, export and import prices are determined in world markets, so the increase in net exports requires a decline in real wages in the export sector. However, if a country’s exports have unique features, increased supply can lower export prices, adding to the economic cost of borrowing from abroad (Burgess 1996).

Calculating the economic cost of investment crowding out when foreign borrowing is possible as the net-of-tax return on capital paid to foreigners establishes a minimum cost because it excludes the reductions in real wages required to increase net exports. The minimum cost would, therefore, be 0.75 x $90 billion = $68 billion, where the $90 billion reflects the economic cost of lower investment, adjusted by a factor of 0.75 to represent corporate income taxes on the returns paid to foreign investors. The $75 billion cost associated with raising taxes to finance higher federal interest expenses does not change with the availability of foreign financing, so the overall cost of the federal debt is approximately $142 billion, or 4.7 percent of GDP in 2024/25.

A similar calculation can be performed for overall provincial debt. In 2021/22, provincial net debt amounted to $784.7 billion, with debt service charges of $30.6 billion. Using the same weighted average economic cost of taxation as for the federal government, the economic cost of provincial debt service charges was $42 billion. The cost of investment crowding out adds another $39 billion, bringing the total cost of debt at the provincial level to $81 billion, or 3.2 percent of GDP in 2021/22. Assuming provincial debt remains at the same percentage of GDP from 2021/22 to 2024/25, the overall cost of Canada’s debt is about 8 percent of GDP.

Benefits of Debt and Its Optimal Level

Tombe also discussed the benefits of public debt, noting its role in financing long-lived assets, stabilizing the economy and smoothing tax rates over time. Governments should borrow to finance investments that will benefit future generations and should finance current expenditures out of current taxes. Spending on education, health and knowledge creation raises special concerns because it benefits both current and future generations. However, since each generation must make these investments, financing them through current revenues typically aligns with the benefit principle.

Counter-cyclical fiscal policy enhances social well-being by mitigating costly deviations from full employment. Additionally, governments can reduce the harmful effects of distortionary taxes by keeping them stable. Since the efficiency cost of taxes is higher when rates are above average than when rates are below average,4 governments should set tax rates at levels sufficient to support expected spending over the cycle and allow deficits to rise and fall in response to unexpected expenditures.5

An issue absent from discussions at the conference was the role of public debt in addressing market imperfections, which can improve efficiency. One such imperfection is the lack of adequate insurance markets against individual-specific wage income losses. As a result, individuals “self-insure” by increasing savings, which is more costly than paying the premiums in a well-functioning insurance market. Public debt puts upward pressure on interest rates and provides a safe savings instrument, allowing households to reduce their savings closer to the efficient level.

Unlike the efficiency gains from using public debt to stabilize the economy and smooth tax rates, mitigating the impact of inadequate insurance markets may justify a permanent increase in public debt. With a well-functioning insurance market, the optimal public debt ratio would be negative – governments should be net savers rather than net debtors. This would allow governments to finance expenditures from interest received on assets rather than from distortionary taxes.6

Empirical issues raised by the inadequate insurance-market approach include whether correcting the market failure is sufficient to make the optimal debt ratio positive and whether the penalty for deviating from the optimal ratio is significant enough to affect the choice of a debt target. Early analyses of incomplete markets found a positive optimal debt ratio. For instance, Aiyagari and McGrattan (1998) calculated an optimal debt ratio of 66 percent of GDP for the US economy. However, Peterman and Sager (2018), using a model with many of the same features as Aiyagari and McGrattan but incorporating multiple generations with standard life cycles instead of a single generation with an infinite life span, found that net government saving is optimal in the US economy. The main reason for the different result is that individuals in a life-cycle model spend a substantial fraction of their working lives accumulating enough savings to make self-insurance possible, so the benefit from self-insurance is smaller than if infinite life spans are assumed.

These results are less relevant for Canada for two reasons. First, employment insurance and other income support measures are more generous in Canada, so self-insurance leading to excess saving is less of an issue. Second, the US analysis assumes deficits are financed entirely by domestic savings, which is a much less realistic assumption for Canada. Foreign borrowing reduces the optimal debt ratio because it lessens the upward pressure on interest rates, which diminishes the impact of public debt on “self-insurance” savings and raises the cost of debt. James and Karam (2001) modified the Aiyagari and McGrattan model to allow borrowing from abroad, which changes the optimal debt ratio from 66 percent to about -80 percent. This qualitative result – that access to foreign savings reduces the optimal debt ratio – has been confirmed by other researchers (Nakajima and Takahashi 2017; Okamoto 2024; and Cozzi 2022).

This review suggests that the inadequate-markets approach does not reverse the conclusion from standard models that the optimal debt ratio is negative, implying that welfare gains can be realized when debt levels are reduced. However, the studies reviewed indicate that the penalty for deviating from the optimal debt ratio is small. In three of the six optimal debt studies reviewed, it is possible to compare the estimated economic costs. In the Peterman/Sager and Nakajima/Takahashi studies, a one-percentage-point increase in the debt ratio reduces consumption by .003 percent. The corresponding figure in the Cozzi study is much higher, approximately .02 percent. These estimates are very low relative to the estimates presented earlier, which imply a loss of .05 percent per percentage-point increase in the debt ratio.

It seems likely that these models are substantially understating the cost of debt. The benefits would have to be understated by an even larger percentage to overturn the conclusion that governments should be creditors not debtors. Since the argument for incurring debt to improve market efficiency is weak, the debt ratio should be chosen by considering only its impact on generational fairness. However, since debt is one of several factors affecting generational transfers, debt policy may have to deviate from the benefit principle to achieve a desired balance of the well-being of current and future generations.

Sustainability Analysis

High debt also raises concerns about its prudence or sustainability: can the interest expense be financed without requiring tax increases or cuts in program spending in the future? In his presentation, Alex Laurin, the Institute’s Vice President and Director of Research, challenged the federal budget’s claim that federal public finances are sustainable (Canada 2024, 382). The federal government’s sustainability claim is based on long-term projections showing a continuously declining debt-to-GDP ratio, reaching nine percent by 2055/56. Moreover, this trend holds even with less optimistic assumptions about interest rates and economic growth.

Laurin argued that this projection is not a convincing demonstration of sustainability for three reasons:

1) Interest Rate Assumptions: In the base case, the effective interest rate on federal debt (r) remains below the growth rate of the economy (g) for 32 years, which puts continuous downward pressure on the debt ratio. This assumption is inconsistent with the historical record. Over the past 35 and 45 years ending in 2022/23, averages of r-g are positive, at 0.8 and 0.4 percentage points, respectively. Only when the averaging period is extended back to include the high-inflation period starting in the 1970s does the multi-year average turn negative.7

2) Program Spending Assumptions: While revenues are assumed to grow in line with GDP, program spending decreases by about one percentage point of GDP over the projection period, causing the primary surplus to rise and putting downward pressure on the debt ratio. A more realistic “no policy change” assumption would keep the share of program spending roughly constant, allowing an assessment of the sustainability of current spending levels.

3) Exclusion of Economic Downturns: The projection fails to explicitly include economic downturns. Over the last 60 years, Canada has experienced five recessions, each prompting discretionary temporary stimulus measures that permanently increased debt. The policy response averaged 1.09 percentage points of potential GDP for each percentage point deviation from potential GDP (Table 1).

Laurin presented an alternative debt projection, assuming that overall program spending grows in line with GDP from 2029/30 to 2055/56 and that r equals g on average over the projection period.8 With these changes, the decline in the federal debt ratio is less pronounced, reaching 29 percent in 2055/56 compared to 9 percent in the budget projection.

Economic downturns were included in the projection by simulating 1,000 random probabilistic scenarios – assuming the frequency and magnitude of recessions over the past 60 years are representative of the future. Laurin assessed debt sustainability by calculating the probability that the debt ratio remains at or falls below its initial value over the projection period.9 The simulations showed an even chance that the debt ratio will exceed its 2028/29 value late in the projection period. Under the International Monetary Fund’s classification (IMF 2022), Canada’s federal debt would be considered unsustainable.

Some conference participants suggested that Laurin’s analysis might not fully capture the risks associated with the federal fiscal position because it assesses a single r-g profile. They also emphasized the importance of including provincial and territorial governments in any sustainability analysis, as these levels are most affected by demographic aging.

For this report, Laurin modified his approach to include provincial and territorial governments’ net debt and to capture the risks of r-g deviating from its assumed zero average over the long term. He introduced variability in the interest-rate growth-rate gap based on historical data, allowing for a more comprehensive risk assessment (methods and assumptions are provided in Appendix).

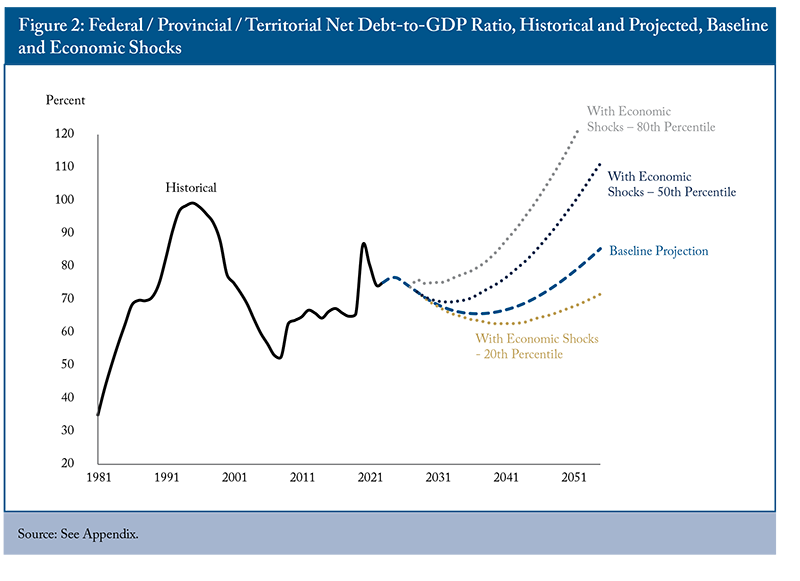
The modified analysis showed that, without any simulated shocks, the combined federal and provincial/territorial net debt-to-GDP ratio initially declines and then stabilizes until 2041/42, when rising healthcare costs due to demographic aging – and the associated interest on provincial debt – cause it to rise steadily (Figure 2, black dashed line). Introducing interest rate and recession shocks significantly alters the outlook, indicating a 50 percent chance that the debt ratio will begin its long-term rise in 2035/36, eventually surpassing 100 percent of GDP (black dotted line). There is a 20 percent chance (the 80th percentile) that the debt ratio will not decrease substantially from its current level and start a steady increase in 2033/34 (grey dotted line). Conversely, there is only a 20 percent chance (the 20th percentile) that the ratio will stay below its near-term value for the entire projection period (gold dotted line).

A Prudent and Fair Target

Prudence

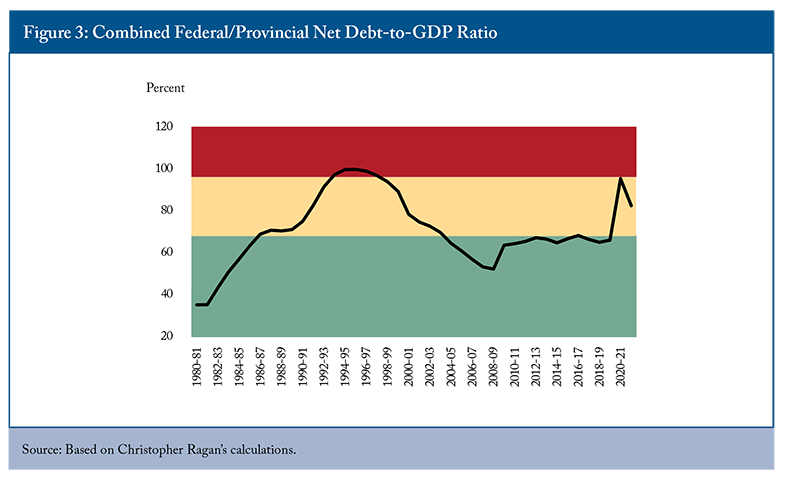
According to McGill economist Christopher Ragan, the main concern about Canada’s high public debt is that it will reduce our ability to borrow to address the next economic crisis. He analysed this issue using three zones for the debt ratio: red (top), yellow (middle) and green (bottom) (Figure 3). The red (top) zone, which represents unsustainable debt, starts roughly five percentage points below the 1995 federal-provincial debt ratio’s peak of 100 percent, when Canada entered a period of “forced austerity.” This entry point to the red (top) zone is higher than the 90 percent threshold for negative effects on growth developed by Reinhart and Rogoff (2010). However, the threshold would be lower if the interest rate on public debt (r) were higher than the rate of economic growth (g).

Ragan argued that the current combined federal-provincial debt-to-GDP ratio is in the yellow (middle) “cautionary” zone. The height of this zone is determined by the buffer required to avoid being pushed into the red (top) zone by an economic crisis. Entering the red (top) zone would mean sharply higher interest rates and lower growth.

To avoid this, Ragan set the buffer at 28 percentage points of GDP, about a quarter more than the increase in the debt ratio during the COVID-19 pandemic. Given the frequency of economic crises, he advocated returning to the green (bottom) zone by 2029/30, nine years after the end of the pandemic-induced recession. This requires reducing the federal-provincial debt ratio by about 10 percentage points.

Laurin followed up by determining the fiscal effort required to return to the green (bottom) zone with high probability. His calculations show that, starting in the next fiscal year (2025/26), the combined federal-provincial primary balance would need to increase permanently by 1.38 percent of GDP – or $42.9 billion in 2025/26.10 If implemented through spending reductions, provincial spending would have to decline by about 7 percent, or federal spending would have to fall by almost 9 percent. Note that such spending reductions would still not fully return the combined federal-provincial program spending/GDP ratio to its pre-pandemic 2018/19 value. The federal government could achieve the same effect by raising the GST to 8.5 percent. However, since most spending pressures from an aging population are on provincial governments, it would be sound policy for the federal government to transfer tax points to provincial governments (Kim and Dougherty 2020). Even with near-term fiscal adjustment, additional consolidation may be necessary in the future to prevent a rise in the debt/GDP ratio.

Ragan favoured achieving the debt target through expenditure restraint rather than raising taxes, which he thinks may have reached their limit. Restraining expenditures will be particularly challenging given medium-term pressures from an aging society, rising military and security needs, and potentially increased public investments for the transition to a green economy. Canada, therefore, needs an ongoing and thorough program review to identify low-priority spending.

Fairness

Financing current government spending with debt is generally considered fair if the debt-to-GDP ratio is constant or declining over time, implying that future generations can receive the same level of government services without facing higher tax rates. However, stable tax rates alone are insufficient to prevent intergenerational transfers. Taxes must increase to finance the interest on the debt or remain higher than they would be otherwise. If the tax increase applies to both current and future generations, tax rates would be stable but higher than they would be without the increased debt. The higher tax rates required to finance debt interest and the deficit-induced reduction in national-savings transfer part of the cost of government spending to future generations who do not benefit from the spending.

Assessing generational fairness requires understanding the extent of intergenerational transfers resulting from fiscal policy. The presentation by Parisa Mahboubi, a Senior Policy Analyst at the Institute, offered insights into this issue using generational accounts. These accounts show lifetime net taxes imposed by federal and provincial governments for each birth cohort from 1923 to 2023 and for a composite future generation consisting of all persons born after 2023. The lifetime tax burdens of the 2023 birth cohort and future generations are comparable because a complete life cycle is captured in both cases. Her analysis shows that future generations are expected to face a slightly higher lifetime net tax burden than the youngest living generation.

Preparing generational accounts requires information on lifetime taxes and transfers for each birth cohort alive today and for future generations. Projected values of taxes paid by current birth cohorts are developed based on age-specific profiles of different types of taxes,11 assuming unchanged tax policies. Spending on health, education, elderly benefits, child benefits, social assistance and GST credits vary by age, while other government expenditures are evenly distributed per capita. Per capita taxes, transfers and expenditures are assumed to grow at the same rate as productivity.

The lifetime net tax burdens for currently alive birth cohorts are calculated as the present value of projected tax payments less the present value of projected government transfers the cohort will receive. Lifetime net tax burdens of future generations are calculated using the “no free lunch” constraint: someone, sometime, must pay for all that the government spends (US Congressional Budget Office 1995). The lifetime net tax burden of future generations equals the amount of future spending not paid by currently alive generations.12

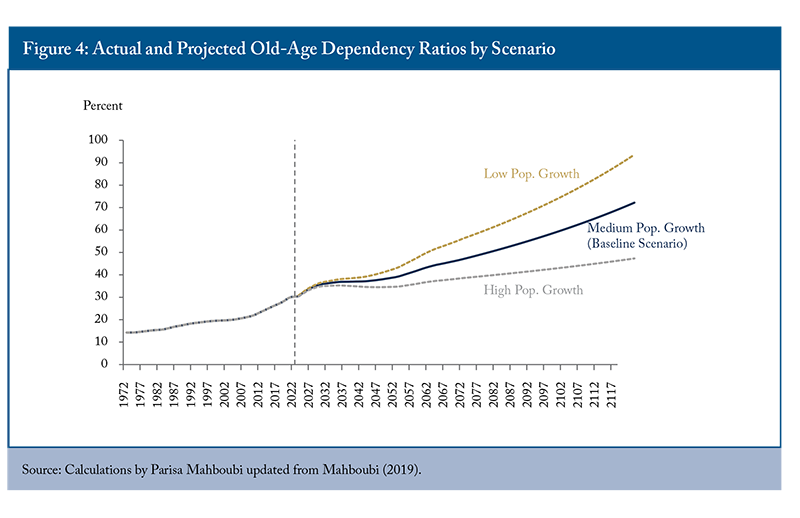
In the baseline scenario, productivity grows 0.94 percent annually, the average GDP per capita growth from 2002 to 2022. The discount rate is the average return on real return bonds over the same period, 1.3 percent.13 Statistics Canada’s medium-growth scenario14 is used for demographic projections, with population growing at an average annual rate of 0.85 percent over the 100-year projection, driven entirely by net immigration. The ratio of those over 65 to those aged 18-65 – the old-age dependency ratio – more than doubles over the projection period, rising from 30 percent to 72 percent (Figure 4).

The increase in the old-age dependency ratio drives upward trends in elderly benefits and health-related expenditures as a share of GDP. Other categories of age-specific spending remain roughly constant.

In the baseline scenario, the lifetime net tax burden of future generations (“unborn”) exceeds that of the cohort born in 2023 (“newborn”) by $23,000 per person (Figure 5). Factors influencing this result include:15

  • Fiscal Position in the Base Year: In 2023, federal and provincial tax revenues exceeded program spending by over one percent of GDP. A smaller primary surplus would have decreased the lifetime net tax burden of the newly born, increasing the burden on the unborn.
  • Population Growth: Faster population growth reduces the relative tax burden on future generations by slowing the rise in the old-age dependency ratio and reducing the per-capita burden of existing debt.
  • Healthcare Costs: If real healthcare costs increase faster than productivity growth, the recently born will pay a smaller share, leaving more for future generations.

The baseline assumptions represent the midpoint of a range of plausible values. While results are sensitive to changes in assumptions, the baseline is considered the most likely outcome. The generational accounts, therefore, suggest that fiscal policy is generationally fair.

However, other factors must be considered when assessing fairness:

  • Population Stability: If there were no net population growth, the tax burden on future generations would be much higher, even if the old-age dependency ratio did not change, because the cost of existing debt would be spread over a smaller population. This observation draws attention to the fact that future generations will be paying for services they did not receive, even with stable lifetime net taxes.
  • Income Growth: Future generations will likely be richer due to productivity growth, which could justify asking them to bear some costs of current consumption. However, parents may not wish to pass on costs to their children, even if incomes are rising over time. Population growth through immigration substantially reduces intergenerational linkages, which could encourage the current generation to increase the target size of intergenerational transfers.
  • New Spending Pressures: The generational accounts do not capture new pressures like rising military and security commitments or higher spending to achieve a net-zero emissions economy. In both cases, underspending in the past has pushed costs into the future. Pre-funding some of this spending by increasing taxes in the near term would even out contributions across generations.
  • Comparisons with Near Term Future Generations: Generational accounts compare a representative future generation with the most recent birth cohort. Comparing the tax burden of living generations with the burden on near-term future generations is also relevant.

While the generational accounts indicate that the federal-provincial fiscal stance is fair to future generations under current assumptions, it is beneficial to supplement this analysis with assessments over shorter time horizons. For example, virtually all living generations benefited from the debt-financed income stabilization and health measures implemented during the pandemic-induced recession. There is a strong fairness argument for paying down pandemic-related debt before the next generation starts working and paying taxes, which would occur over the 2035-to-2045 period (Lester 2021).

Federal and provincial Covid-related spending amounted to approximately $430 billion from 2020/21 to 2022/23.16 Federal and provincial debt was $2,092 million in 2022/23. Reducing the level of debt to $1,660 million no later than 2045/46 would be fair to generations born in 2019 and later. However, in Laurin’s prudent scenario, in which debt is sustainable with 80 percent probability, the level of debt rises continuously over the projection period. The gap between the prudent and fair level of debt is $1,200 million in 2035/36. Achieving a fair level of debt would require more fiscal consolidation than is needed to achieve sustainability.

Reforming Expenditure Management

Ragan’s debt target and the recommendation to achieve it through expenditure restraint raise two issues:

1) Building Consensus: How to build a consensus on the proposed debt target and increase the likelihood of achieving it.

2) Identifying Savings: How to identify programs that don’t provide enough value to justify raising taxes to finance them.

Economist and C.D. Howe Institute Fellow-in-Residence John Lester emphasized that achieving a political consensus on a more prudent fiscal approach requires vigorous and sustained advocacy. Part of this advocacy involves convincing governments to surrender some policy flexibility to increase the odds of achieving the target reduction in debt and reduce the risk of relapse after the next crisis.

Lester and Laurin (2023) propose a principles-based fiscal governance framework intended to reduce the bias toward deficit financing in both good times and bad. Governments should adopt guiding principles for fiscal policy, set operational rules for achieving target outcomes and transparently assess consistency with these principles.

At the conference, Lester expanded upon one element of the governance framework: a binding multi-year ceiling on non-cyclical spending. A key motivation for this proposal is the failure to adhere to spending tracks set out in budgets and fiscal updates. For example, in the federal government’s 2019 Economic and Fiscal Update, program spending was projected to decline as a share of GDP, reaching 13.8 percent by 2024/25. The spending ratio projected for 2024/25 increased in successive budgets so that in 2024-25 it will be almost 2 percentage points higher than projected in 2019.18

Binding multi-year expenditure ceilings apply in 11 OECD member countries (Moretti, Keller, and Majercak 2023).19 In the Netherlands and Switzerland, the ceilings are set out in legislation that constrains expenditure growth. Alberta has recently adopted a similar approach.20 However, in most countries, expenditure ceilings are set by the government to ensure consistency with its self-defined fiscal objectives, which may or may not include expenditure restraint. This is the general approach recommended for Canada, although the hope is that the self-defined objective will be to achieve the debt target through expenditure restraint.

The expenditure ceiling would be binding for five years, ideally developed in the first year of a new electoral mandate after a campaign outlining spending plans in detail. The ceiling would cover all categories of spending directly affected by policy decisions. It would be updated annually to account for forecasting errors in program determinants (e.g., inflation, population growth). There would be escape clauses for major economic recessions, natural disasters and war. The ceiling could include a reserve for new policy initiatives, but in the context of expenditure restraint new initiatives may need to be funded by eliminating or modifying existing programs.

Identifying the programs that should be scaled back or eliminated because they don’t provide enough benefits to justify raising taxes to finance them requires, according to Lester, an overhaul of the way the government manages its spending, particularly the performance management framework that is key to establishing value for money. Yves Giroux set the stage for this discussion by describing the federal government’s current expenditure management system.

The requirement to evaluate programs was formalized following the creation of the Office of the Comptroller General in 1978. Despite several modifications, program evaluations have not been successful in affecting strategic spending decisions. The Ministerial Task Force on Program Review (the Nielsen Task Force) from 1984 to 1986 described evaluations as “generally useless and inadequate for the work of program review” (quoted in Grady and Phidd 1993). More recently, McDavid et al. (2018, 302) conclude that evaluations do not “address questions that would be asked as cabinet decision-makers choose among programs and policies.”

Under the current evaluation policy, federal government departments have considerable flexibility in conducting evaluations. They may focus on design and delivery, program beneficiary responses or a comparison of program costs and benefits. A review of 48 evaluations prepared since 2020 in eight departments21 found that only four went beyond assessing operational efficiency and impacts on beneficiaries to examine whether the program represented value for taxpayer money. Three of these applied formal benefit-cost analysis, which is the standard for assessing regulatory proposals.22

Evaluating programs in terms of operational efficiency and beneficiary impacts helps improve programs, but if evaluations are to inform strategic spending decisions, value-for-money assessments must be mandatory. These assessments should be based on the benefit-cost framework applied to regulatory proposals.

Benefit-cost analysis of regulatory proposals – and by extension, spending programs – assesses the overall social benefits and costs of policy initiatives. The quantitative analysis attempts to determine if the economic pie is larger or smaller after government intervention. For example, economic development programs (business subsidies) are implemented with the expectation that they will increase overall real income. To assess this, benefit-cost analysis considers not only the additional investment and employment resulting from the subsidy but also the opportunity cost of workers and capital – the amount that would have been earned otherwise. The net increase in the economic pie is the incremental earnings of workers and capital less efficiency losses from raising taxes or issuing debt to finance the subsidy and resources used to administer and apply for it.

The nature of the assessment should vary by program type. Business subsidies, labour market development programs and climate change mitigation/adaptation measures have benefits and costs measurable in monetary terms. These programs could be ranked by their net social benefits, allowing comparisons within and across program categories. Programs where benefits are less than costs would be candidates for elimination or modification.

A more nuanced approach is needed when assessing social programs and other measures with a fairness goal for several reasons. Their economic impact is ambiguous, and a negative economic impact is not a sufficient reason to eliminate a program. In addition, support for an income redistribution program depends on who benefits from it. As a result, evaluations of social programs should be more descriptive than prescriptive. They should present information on the economic impacts of measures, their fiscal cost, including administration expenses, and a discussion of who benefits from the program and how they benefit. Evaluations should also assess how the program fits into other measures providing support to the target population. This information will allow elected officials and, since all evaluations would be made public, Canadians, generally, to form an evidence-based opinion on the value for money of social programs.

A thorough assessment of government programs through a value-for-money lens may not identify enough wasteful spending to achieve deficit and debt targets. If so, tax increases should be used to achieve the objectives.

Adopting and achieving the debt target will require a political commitment that currently does not exist. The task for policy analysts is to help build a consensus on a more prudent approach to fiscal policy and a revamped expenditure management system. According to Lester, this consensus should be ratified by legislation setting out general principles for sound fiscal policy, supplemented with non-legislated operational rules to guide annual policy and monitor progress. This approach would impose discipline on fiscal policy while allowing flexibility to address unexpected developments. Legislation would strengthen the consensus on fiscal prudence and help prevent backsliding by future politicians.

Conclusion

The evidence presented at the conference confirmed that Canada has a debt problem. Existing debt levels are not prudent, and they raise concerns about generational fairness. Prudence requires that Canada’s public debt be reduced by about 10 percentage points of GDP before the decade’s end. This would require increasing the combined federal-provincial primary balance by 1.4 percent of GDP, or $43 billion, starting in 2025/26.

Tax increases harm economic performance, so elimination of public spending that does not provide enough benefits to offset this damage should be the first step in reducing deficits and debt. Identifying wasteful spending will require comprehensive value-for-money assessments. Governments must not take the easy way out by implementing across-the-board spending cuts. Successful expenditure restraint will also require setting binding multi-year expenditure ceilings to prevent governments from spending revenue windfalls or from increasing spending to improve chances of electoral success.

Canada’s public debt is imposing a burden on future generations. A comparison of the lifetime tax burden on the recently born with distant future generations reveals only a small generational transfer in favour of the recently born. However, burden shifting is much larger from currently living generations to persons born shortly after the pandemic-induced recession. The $430 billion in pandemic-related debt should be paid down by the people that benefited from the income stabilization measures. Achieving this fairness objective would require more fiscal consolidation than needed to ensure sustainability of the debt. For the Silo, Alexandre Laurin/John Lester via C.D. Howe Institute.

Appendix: Assumptions and Methods for the Sustainability Analysis

References

Aiyagari, S. Rao, and Ellen R. McGrattan. 1998. “The Optimum Quantity of Debt.” Journal of Monetary Economics 42 (3): 447–69.

Ambler, Steve, and Craig Alexander. 2015. “One Percent? For Real? Insights from Modern Growth Theory about Future Investment Returns.” E-Brief. Toronto: C.D. Howe Institute. October.

Burgess, David F. 1996. “Fiscal Deficits and Intergenerational Welfare in Almost Small Open Economies.” Canadian Journal of Economics, 885–909.

Canada. 2024. “Budget 2024.” Department of Finance Canada. April.

Checherita-Westphal, Cristina D., and Marcel Stechert. 2021. “Household Saving and Fiscal Policy: Evidence for the Euro Area from a Thick Modelling Perspective.” Available at: https://papers.ssrn.com/sol3/papers.cfm?abstract_id=3992188.

Conklin, David, and Thomas Courchene. 1983. “Deficits: How Big and How Bad?” Special Research Report. Toronto: Ontario Economic Council.

Cozzi, Marco. 2022. “Has Public Debt Been Too High in Canada and the US? A Quantitative Assessment.” University of Victoria, Economics. Available at: http://www.uvic.ca/socialsciences/economics/assets/docs/discussion/ddp2007.pdf.

Dahlby, Bev, and Ergete Ferede. 2022. “What Are the Economic Costs of Raising Revenue by the Canadian Federal Government?” Fraser Institute. Available at: https://roam.macewan.ca/items/73cf71a0-209f-4634-91a7-98d019750638/full.

Grady, Patrick, and Richard W. Phidd. 1993. “Budget Envelopes, Policy Making and Accountability.” Government and Competitiveness Project, School of Policy Studies, Queen’s University. http://global-economics.ca/budgetenvelopes.pdf.

International Monetary Fund (IMF). 2022. “Staff Guidance Note on the Sovereign Risk and Debt Sustainability Framework for Market Access Countries.” 2022–039. IMF Policy Papers.

James, Steven, and Philippe Karam. 2001. “The Role of Government Debt in a World of Incomplete Financial Markets.” Department of Finance, Economic and Fiscal Policy Branch.

Jenkins, Glenn, and Chun-Yan Kuo. 2007. “The Economic Opportunity Cost of Capital for Canada-an Empirical Update.” Queen’s Economics Department Working Paper. Available at: https://www.econstor.eu/handle/10419/189409.

Johnson, David. 2004. “Does the Debt Matter?” In Is the Debt War Over, pp. 173–96. Montreal: Institute for Research on Public Policy. Available at: https://books.google.com/books?hl=en&lr=&id=s4VcGvjVX0MC&oi=fnd&pg=PA173&dq=%E2%80%9CDoes+the+debt+matter%3F%E2%80%9D+&ots=t0fNWzkyoC&sig=TIQrfQbAitqgSIDuHypw_FT6Eeo.

Kim, Junghum, and Sean Dougherty (eds.) 2020. “Adaptability, accountability and sustainability: Intergovernmental fiscal arrangements in Canada,” in Ageing and Fiscal Challenges across Levels of Government, OECD Publishing, Paris.

Lester, John. 2024. “Minding the Purse Strings: Major Reforms Needed to the Federal Government’s Expenditure Management System.” Available at: https://www.cdhowe.org/sites/default/files/2024-09/For%20advance%20release%20EMS%20E-Brief_359.pdf.

Lester, John, and Alexandre Laurin. 2023. “Ottawa Needs a New Approach to Fiscal Policy.” E-Brief 338. Toronto: C.D. Howe Institute. Available at: https://papers.ssrn.com/sol3/papers.cfm?abstract_id=4397967.

Mahboubi, Parisa. 2019. Intergenerational Fairness: Will Our Kids Live Better than We Do? Commentary 529. Toronto: C.D. Howe Institute. January.

McDavid, Jim, Astrid Brousselle, Robert P. Shepherd, and David Zussman. 2018. “Linking Evaluation and Spending Reviews: Challenges and Prospects.” Canadian Journal of Program Evaluation 32 (3): 297–304. https://doi.org/10.3138/cjpe.43176.

Modigliani, Franco. 1983. “Government Deficits, Inflation and Future Generations.” In Deficits: How Big and How Bad, pp. 55–71.

Moretti, Delphine, Anne Keller, and Marco Majercak. 2023. “Medium-Term and Top-down Budgeting in OECD Countries.” OECD Journal on Budgeting 23 (3). https://www.oecd-ilibrary.org/content/paper/39425570-en.

Nakajima, Tomoyuki, and Shuhei Takahashi. 2017. “The Optimum Quantity of Debt for Japan.” Journal of the Japanese and International Economies 46:17–26.

Okamoto, Akira. 2024. “The Optimum Quantity of Debt for an Aging Japan: Welfare and Demographic Dynamics.” The Japanese Economic Review. May. Available at: https://doi.org/10.1007/s42973-024-00156-7.

Panizza, Ugo, Richard Varghese, and Yi Huang. 2019. “Public debt and private investment.” Centre for Economic Policy Research. VOXEU Column. December 4.

Peterman, William, and Erick Sager. 2018. “Optimal Public Debt with Life Cycle Motives.” https://papers.ssrn.com/sol3/papers.cfm?abstract_id=3187698.

Ragan, Christopher, and William G. Watson. 2004. “Is the Debt War Over?: Dispatches from Canada’s Fiscal Frontline.” Vol. 45. IRPP. Available at: https://books.google.com/books?hl=en&lr=&id=s4VcGvjVX0MC&oi=fnd&pg=PP11&dq=%22Is+the+debt+war+over%3F%22&ots=t0fNWqoDsw&sig=Q1poOT4AbHtIkx_NVf5GjrcXEtc.

Reinhart, Carmen M., and Kenneth S. Rogoff. 2010. “Growth in a Time of Debt.” American Economic Review 100 (2): 573–78. https://doi.org/10.1257/aer.100.2.573.

Robson, William, and Parisa Mahboubi. 2024. Another Day Older and Deeper in Debt: The Fiscal Implications of Demographic Change for Ottawa and the Provinces. Commentary 665. Toronto: C.D. Howe Institute. August.

Robson, William, and William Scarth. 1994. Deficit Reduction – What Pain, What Gain? (Policy Study 23). Toronto: C.D. Howe Institute.

US Congressional Budget Office. 1995. “Who Pays and When? An Assessment of Generational Accounting.” Available at: https://www.cbo.gov/sites/default/files/cbofiles/attachments/Genacct.pdf.

Canada Debt Becoming Unmanageable Economists Warn

With the Canadian government’s high debt-to-GDP ratios, such as a ratio of debt to nominal GDP sitting at 68 percent in March 2023, economists warn that government debt could become unsustainably high if Ottawa fails to reduce spending, increase productivity, and re-establish business confidence.

“We’re not growing our income per capita, which means that we’re not going to get the tax revenues that we need, plus we’re getting a lot of people retiring. So the situation could end up becoming quite unmanageable if we keep our pace that we’re going,” said Jack Mintz, president’s fellow at the University of Calgary’s School of Public Policy.

The federal government has run back-to-back budget deficits since the 2008 financial recession, with government spending spiking during the COVID-19 pandemic. As a result, Canada’s debt as a percentage of nominal GDP rose from around 51 percent in 2009 to 74 percent by 2021, for example. Nominal refers to the current value for the particular year without taking inflation into account.

The two previous federal budgets have attempted to lower government spending, but the federal government will still post a $40 billion deficit in 2023–24, which they project will shrink to a $20 billion deficit by 2028–29.

The Liberal government’s response to criticism by the opposition that Canada’s debt could lead the country into a financial crisis has been that Canada has among the best debt-to-GDP ratios in the G7.

According to Mr. Mintz, while Canada’s debt situation is not as bad as it once was, it doesn’t mean that it may not impact Canada’s prosperity prospects.

Conrad Black: Budget 2024 Is an Assault on Canadian Investment

ANALYSIS: Higher Income Taxes Not Only for Wealthy in Budget 2024

Mr. Mintz points out that Canada’s debt situation is not nearly as bad as in 1996. The government’s ratio of debt to nominal GDP ratio reached 83 percent that year.

Mr. Mintz also noted that Canada continues to have a triple-A credit rating according to the world’s leading credit agencies, meaning the country’s debt is not yet seen as problematic.

“We’re still viewed as having a much better credit line compared to a number of other countries. … But at some point, the credit agencies might look at that gross debt number and start asking the question, ‘Is it starting to become unsustainable?’” he said.

Lower Productivity Hampering Debt Payments

The federal government’s ability to pay off its debt could be hampered by low productivity, according to Steve Ambler, professor emeritus of economics at Université du Québec à Montréal.

“The thing that worries me in terms of federal government debt is we are currently in a period of extremely low productivity growth and low overall growth,” he said.

In March, the Bank of Canada’s senior deputy governor Carolyn Rogers warned that Canada’s poor productivity had reached emergency levels.

Although Statistics Canada said the country’s labour productivity showed a small gain at the end of 2023, that came after six consecutive quarters of productivity decline.

The right honourable Jean Chrétien.

Mr. Ambler said an appropriate way to lower the debt-to-GDP ratio is to keep government spending from increasing while also raising productivity to increase tax revenues. He said this was the strategy of Prime Minister Jean Chrétien, whose Liberal government established a budget surplus in three years by growing the economy and keeping government spending stagnant.

To lower Canada’s debt-to-GDP ratio, Mr. Ambler said the government should focus on increasing worker productivity, allowing its resource sector to grow, and easing back on discretionary spending.

He also cited a November 2023 C.D. Howe paper showing that business investment per worker in Canada has shrunk relative to the United States since 2015. Investments such as better tools for workers would increase productivity, while productivity growth would in turn create opportunities and competitive threats that spur businesses to invest, the paper said.

“Re-establishing business confidence would be almost the number one priority, especially in the resource sector,” Mr. Ambler said, adding that a future government might also be wise to lower the feds’ “wildly extravagant subsidy programs” for the electric vehicle (EV) sector.

The Liberal government has given tens of billions of dollars in subsidies for EV manufacturing projects in Canada since 2020, saying the factories will eventually create thousands of new jobs.

‘No Cushion’ to Mitigate Debt Issue

Joseph Barbuto, director of research at the Economic Longwave Research Group, has a more pessimistic view of Canada’s debt. He says that while federal debt is at levels similar to the 1990s, the crisis will be “larger” because the government does not have the “fiscal room to mitigate the downturn.”

Mr. Barbuto said that while the Canadian government was able to help alleviate its debt issues in the 1930s and 1990s by lowering its interest rates, it does not have that same luxury in 2024. The Bank of Canada lowered its key policy rate from 1.25 percent to 0.25 percent in 2020, and was forced to raise it to 5 percent by 2023 in response to rising inflation.

“There’s no interest rate cushion on the other side. Interest rates can only fall back to zero,” Mr. Barbuto said, noting that higher interest rates make it more difficult for governments to service their debt.

“The problem with the monetary system is there’s no fiscal discipline that is pushed on governments, unlike [individuals] or corporations,” he said.

“There will be a point where because of the accumulated interest with rising interest rates, eventually it’s going to overwhelm the government and then people will not lend the government any kind of capital.”

Mr. Barbuto also expressed concern over Canada’s private debt-to-GDP ratio. Private debt refers to debt owed by private, non-financial entities such as businesses and households, as opposed to public debt owed by governments and banks. Canada’s ratio of private debt to nominal GDP sat at 217 percent in December 2023 compared to 124 percent in 1995.

Mr. Barbuto said Canada’s private debt-to-GDP ratio is higher than that of Japan’s in the 1990s, and pointed out that the Japanese economy had stagnated after the country’s asset price bubble burst in 1992.

The research director believes the Canadian economy will eventually see a debt crisis and collapse in real estate that will result in austerity measures, a shrinkage in the size of government, and the “creative destruction” of the old political and economic system. He said this would be the continuation of an economic cycle that has repeatedly happened throughout history.

“[It’s] inevitable and necessary. A debt detox or deleveraging is the same thing as a drug detox. Nobody likes it, … but it’s a necessary part of the cycle for it then to go back up,” he said.

For the Silo, Matthew Horwood/Epoch Times.