Michigan-Based Humanitarian Organization, Life for Relief and Development (LIFE), Helps Put a Book in Every Child’s Hand at Ontario School
Centuries after books first became humanity’s primary means of preserving knowledge, they continue to offer something technology alone cannot: the space to reflect, question, imagine, and think deeply. As our world is increasingly shaped by instant answers, AI-generated content, endless notifications, and shrinking attention spans, the ability to engage with long-form content and complex ideas may be more valuable than ever.
Reading researchers have repeatedly found that reading on paper often leads to stronger comprehension and retention than reading the same material digitally, particularly when students engage with longer and more complex texts. Recent systematic reviews likewise suggest that print reading supports deeper engagement and comprehension, particularly when students are working with longer or more cognitively demanding texts.
As concerns grow over academic achievement, rising screen time, and the increasing use of artificial intelligence by students, educators across North America are confronting difficult questions about how to prepare the next generation for the future.
Life for Relief and Development (LIFE) is a U.S.-based humanitarian organization that has served vulnerable communities in more than 60 countries for over three decades. They believe that books and educational support are among the most valuable tools we can give future generations.
LIFE recently delivered thousands of educational resources to Al-Taqwa School in London, Ontario. The shipment included reading and writing materials, literature anthologies, teacher editions, and textbooks for students from kindergarten through Grade 8.
According to Neil, principal of Al-Taqwa School, the school first received educational books through LIFE more than a decade ago. Those resources served students for years before a new shipment arrived. Beginning in 2016, LIFE also provided school furniture to support the school’s growing educational needs, helping create learning spaces where students could learn, collaborate, and thrive.
The longevity of those earlier donations speaks not only to the quality of the resources but also to the enduring value of educational investments that continue benefiting students long after they are delivered.
When the newest shipment arrived, teachers immediately recognized the difference it would make. For years, educators often relied on shared resources, photocopies, and creative workarounds to stretch classroom materials. The arrival of additional books meant students could finally have direct access to the materials they needed.
According to Neil, the new shipment meant there was finally “a book in every child’s hand.”
That statement carries added significance at a time when screens occupy an increasingly large role in children’s lives. Canadian health guidelines recommend no more than two hours of recreational screen time per day for school-aged children and youth, yet studies consistently show many exceed that amount by several hours. Researchers have linked excessive screen use to lower academic performance, reduced attention spans, poorer sleep quality, and decreased reading engagement.
Technology undoubtedly has a place in modern education. Digital tools provide access to information, research opportunities, and new ways of learning. However, what we are seeing in many schools is the complete replacement of books with items like Chromebooks and other screen-based devices.
The arrival of new classroom books from LIFE allowed teachers at Al-Taqwa to spend less time on screens, managing textbook shortages, and more time focusing on instruction, mentorship, and student growth.
Al-Taqwa School is concerned not only with what students learn but also with who they become. School leaders emphasize character, responsibility, leadership, and personal development alongside academic achievement. Quality educational resources support those goals by helping teachers create classroom experiences that foster curiosity, intellectual engagement, and a lifelong appreciation for learning.
Life for Relief and Development (LIFE) holds the philosophy that knowledge creates opportunity. The organization’s educational initiatives extend far beyond Ontario. In communities around the world, LIFE supports education through large book shipments, scholarships, educational supplies, building schools, and learning opportunities that help children continue their studies despite poverty, conflict, or displacement. In Gaza, for example, LIFE has supported educational spaces that have helped nearly 1,000 children continue learning despite the ongoing humanitarian crisis.
“Education is one of the greatest investments we can make in the future,” said Dr. Hany Saqr, President and CEO of LIFE. “When we place quality educational resources in the hands of children, we are doing more than supporting their studies. We are helping cultivate future leaders, innovators, educators, and problem-solvers who will shape the communities and world they inherit.”
The partnership between LIFE and Al-Taqwa School reflects Dr. Saqr’s sentiment. The first books delivered through LIFE served students for more than a decade before a new generation of resources arrived. Today, those latest materials will help another generation of learners build knowledge, develop confidence, and engage more fully with their education.
Every book placed in a student’s hands represents another opportunity to learn, imagine, question, and think for themselves about the world around them. Those opportunities ultimately shape our collective future. No matter how many technological advancements we witness, books will continue to remain among the most enduring tools for cultivating knowledge, curiosity, and critical thought.
Following weaker-than-expected U.S. and Canada jobs data while gold rebounds to its highest level in weeks, more North Americans are looking around their homes for fast sources of cash … and family jewelry is increasingly becoming the first asset they choose to sell. But, consumer advocates warn that many sellers rush into pawn shops, mail-in buyers, or hotel gold-buying events without ever learning what their jewelry is actually worth, potentially leaving hundreds or even thousands of dollars behind. With gold prices climbing again and household budgets still under pressure, knowing how to value jewelry before selling has become more important than ever.
Why more North Americans are cashing in family jewelry, the biggest resale mistakes consumers make, and how AI is helping sellers avoid pawn shop pricing traps
As inflation, rising household costs, and economic uncertainty continue squeezing family budgets, many Americans are looking around their homes for quick sources of cash. One asset is suddenly attracting renewed attention: old gold and silver jewelry. With precious metal prices near record highs, consumers are increasingly selling inherited jewelry, broken chains, forgotten rings, and unused pieces to generate extra income. But experts warn that the rush to sell is also creating opportunities for lowball offers, misleading valuations, and resale scams that can cost consumers hundreds or even thousands of dollars.
Nidhi Singhvi, Co-Founder and CEO of AI-powered jewelry valuation platform Unvault, has talked extensively about how today’s jewelry resale market works, why so many consumers unknowingly accept offers far below market value, and the simple steps sellers should take before walking into a pawn shop or mailing away valuable pieces. Using AI-powered image analysis, live precious metals pricing, and transparent valuation models, Unvault helps consumers understand what their jewelry may actually be worth before deciding whether to sell. The platform was built specifically to replace the opaque appraisal process that has traditionally dominated the resale market while giving consumers more control over their financial decisions.
According to Unvault, Americans alone may be sitting on an estimated $750 billion usd to $1 trillion usd worth of gold jewelry that is largely untracked and often significantly undervalued by its owners. Add in jewelry collections from Mexican and Canadian families and the numbers get staggering.
As gold prices have climbed, consumer interest has surged, with Unvault reporting rapid growth in jewelry assets being tracked as more people seek transparent valuations before selling.
Keep the following key points in mind when considering selling
Why are soaring gold prices prompting more North Americans to sell jewelry to cover everyday expenses?
What are the biggest red flags that suggest a buyer may be dramatically undervaluing your jewelry?
Why do pawn shop offers and resale quotes vary so widely?
How do you determine whether jewelry should be sold, insured, or held as a long-term asset?
What are the common misconceptions people have about inherited, broken, or outdated jewelry?
How can AI provide a market-based jewelry valuation in under a minute using only photos?
Why should consumers know their jewelry’s value before entering any resale negotiation?
Which types of gold and silver jewelry typically retain the strongest resale value?
What are the safest ways to sell valuable jewelry while protecting against fraud and pricing manipulation?
Research which practical advice is there for maximizing resale value without falling victim to common industry pricing tactics.
Independent Palestinian Doctors Association Leads Health Initiatives to Support Vulnerable Communities in Remote Areas
As humanitarian and healthcare challenges continue to intensify across Jerusalem and the West Bank, the Independent Palestinian Doctors Association (IPDA) is advancing a comprehensive portfolio of medical, developmental, and training initiatives aimed at strengthening healthcare services, expanding access to medical care, supporting community institutions, and investing in the professional development of healthcare workers on the ground.
The Association’s vision is rooted in delivering a comprehensive response to the growing needs of Palestinian communities through programs that combine direct medical interventions, professional training, and healthcare infrastructure support. These efforts contribute to strengthening community resilience, improving the quality of healthcare services, supporting both governmental and non-governmental healthcare sectors, and advancing Palestine’s healthcare system through medical fellowship programs and the provision of modern medical technologies and equipment.
Mobile Medical Clinic Expands Access to Healthcare in Underserved Communities
One of the Association’s flagship initiatives is its Mobile Medical Clinic Project, a fully equipped medical unit that travels throughout remote villages and marginalized communities across Jerusalem and the West Bank. The clinic provides free medical examinations, laboratory testing, and medications to patients in need.
The project aims to address critical gaps in healthcare access in underserved areas by bringing essential medical services directly to residents who face significant challenges in reaching hospitals and healthcare centers, ensuring continuous access to primary healthcare services.
In addition, the Association organizes free medical outreach days targeting the most vulnerable populations. These events provide medical consultations, diagnostic examinations, and essential treatments at no cost, helping alleviate the financial burden on low-income families while improving their access to appropriate healthcare services.
The Association also operates field medical points within displacement-affected areas, delivering primary healthcare services and emergency medical interventions to displaced individuals and vulnerable communities. These field units play a vital role in rapid emergency response efforts, particularly in areas facing difficult humanitarian conditions, by providing immediate medical assistance that helps reduce suffering and improve health outcomes.
Investing in Healthcare Professionals and Capacity Building
The Association places significant emphasis on strengthening the skills and preparedness of healthcare professionals through internationally accredited training programs designed to enhance their ability to respond effectively to emergencies and critical medical situations.
Among its most prominent programs is the Advanced Trauma Life Support (ATLS) course, which equips physicians and healthcare workers with the knowledge and skills needed to manage severe injuries and trauma cases according to internationally recognized medical protocols.
The Association also delivers Advanced Cardiovascular Life Support (ACLS) training, one of the most important specialized programs in cardiac emergency management and resuscitation. The course provides participants with the expertise required to respond rapidly and effectively to life-threatening cardiac emergencies.
Complementing these initiatives is the Basic Life Support (BLS) program, which offers practical training in first aid, cardiopulmonary resuscitation (CPR), and emergency response to cardiac arrest, respiratory failure, and loss of consciousness, thereby enhancing the capacity of healthcare providers to manage a wide range of emergency situations.
Harnessing Artificial Intelligence to Advance Palestinian Healthcare
As part of its commitment to digital transformation and technological innovation, the Association has launched a specialized training program on Artificial Intelligence applications for members of the Palestinian Medical Association. The program introduces participants to emerging AI tools and technologies that can be utilized in administrative, organizational, and professional healthcare settings, contributing to improved efficiency, resource management, and service delivery.
In parallel, the Association implements a surgical assistance program dedicated to supporting patients who are unable to afford medical treatment. Through this initiative, essential surgical procedures are provided to low-income patients, helping save lives and improve the quality of life for individuals requiring specialized medical care.
Supporting Hospitals and Expanding Access to Life-Saving Surgical Care
The Association also focuses on strengthening non-governmental hospitals by providing critical medical equipment and devices that are unavailable in some healthcare facilities. Efforts include upgrading outdated equipment, replacing non-functional devices, and enhancing the overall capacity of healthcare institutions to deliver quality medical services.
Additionally, the Association contributes to funding free surgical procedures and post-operative medical follow-up programs for eligible patients, ensuring that vulnerable individuals receive the care they need regardless of their financial circumstances.
Its programs further extend to supporting ambulance and emergency medical services in areas affected by ongoing tensions and field developments. By strengthening emergency response teams and providing essential operational support, the Association helps ensure faster access to injured individuals and timely delivery of emergency medical care, ultimately reducing health risks associated with delayed treatment.
The trend of Canadians going into more debt is a significant concern, driven by rising living costs and financial obligations such as mortgages, student loans, and consumer debt. Recent statistics reveal that total household debt in Canada surpassed $3 billion in September 2024, with the average Canadian now carrying approximately $41,500 in household debt, excluding mortgages. This trend has been steadily rising for years,
This ratio reached 173.08% in 2021. Secured debt, such as mortgages or car loans, is a major contributor to household debt, while unsecured debt, including credit cards, relies on the borrower’s creditworthiness.
The cost of living is catching up to a large chunk of Canadians, with almost one in four taking on new debt in the last year. The Financial Consumer Agency of Canada found that more than half of Canadians are struggling to pay bills, and the OSB reported that 4.2 out of every 1,000 adult Canadians filed for insolvency in 2024, the highest rate since 2019. This accumulation of debt is attributed to spending consistently outstripping income for some time now.
Global News To manage debt, Canadians are advised to consider debt consolidation, a debt management plan, or a consumer proposal. These options can help reduce the amount paid if the interest rates and terms of a consolidation loan from a bank are better than those of the individual creditors.
Canada’s household saving picture is splitting in two. Since 2021, the top fifth has lifted its average net saving to over $75,000 a year, while the lowest has sunk deeper into dissaving, spending nearly $39,000 more than its disposable income. The middle and second fifths have also slipped further into the red. Higher earners are pulling away as lower earners draw down savings and borrow to keep spending. For more on the health of Canada’s economy, see this C.D. Howe Institute memo.
Note: Negative values denote dissaving (consumption exceeds disposable income). Quintiles averaged the following income: Lowest quintile $33,000, second quintile $62,000, third quintile $88,000, fourth quintile $120,000, fifth quintile $219,000.
Source: Statistics Canada, Distributions of Household Economic Accounts (Table 36-10-0587-01). Figures are average net saving per household.
Connecting donors with the urgent humanitarian needs of displaced families living in tents across Gaza.
The city of Baltimore, Maryland, recently hosted the 51st annual convention of the Islamic Circle of North America (ICNA) in collaboration with the Muslim American Society (MAS), attracting nearly 25,000 attendees from around the world. This year’s convention expanded significantly, featuring a large exhibition hall that brought together hundreds of exhibitors, sponsors, community organizations, and charitable institutions.
Humanitarian and relief organizations, particularly those supporting displaced families living in Gaza’s tent camps, played a central role throughout the event. Beyond showcasing their projects, the convention serves as one of the largest annual platforms in North America for fundraising, partnership development, and direct engagement with Muslim communities.
A Platform Connecting Humanitarian Action with Community Engagement
Speaking about Life for Relief and Development’s participation in the convention, Vicki Roob, Director of International Programs, emphasized that the event is among the most significant annual Islamic gatherings in the United States and North America. It serves as a strategic platform that brings together humanitarian, charitable, and community-focused initiatives while providing valuable opportunities for direct engagement with diverse segments of American and Muslim communities.
Roob explained that the organization’s participation reflects its commitment to maintaining a strong presence at events that unite thousands of individuals passionate about humanitarian and charitable work. Each year, the convention attracts tens of thousands of attendees from across the United States and Canada, including community leaders, activists, volunteers, donors, charitable organizations, and humanitarian agencies. This environment offers a valuable opportunity to showcase Life’s mission, programs, and global humanitarian projects.
She added that visitors demonstrated significant interest in global humanitarian issues, particularly communities affected by conflict, disasters, and the ongoing displacement crisis in Gaza. This provided an important opportunity to highlight the growing needs of vulnerable populations and mobilize additional support for those most affected.
Life: A Trusted Bridge Between Donors and Those in Need
Omar Mamdouh, Director of Executive Projects, explained that the organization used the convention to spotlight a wide range of humanitarian programs and initiatives, including food security projects, assistance for vulnerable families, orphan sponsorship programs, and water, health, and education initiatives. Special attention was also given to Life’s emergency relief efforts in countries facing escalating humanitarian crises, particularly its support for displaced families living in Gaza’s tent camps and the delivery of humanitarian aid throughout the Gaza Strip.
Mamdouh noted that one of the convention’s most important benefits is the opportunity to connect directly with donors and demonstrate the impact of their contributions. The organization provided attendees with a comprehensive overview of living conditions inside Gaza’s displacement camps, including the severe shortages of essential supplies, the challenges faced by displaced children, the effects of extreme weather conditions, and the broader housing and shelter crisis affecting families throughout the region.
To help donors better understand these realities, Life displayed one of its newly developed shelter tents used in Gaza. Whereas previous tents measured 4 by 4 meters, the updated model measures 4 by 6 meters and includes a dedicated bathroom space to provide greater privacy, particularly for women. Visitors were also shown a model of daily life inside the tents, along with improvements and modifications made in response to feedback from displaced residents.
The exhibition further highlighted Life’s humanitarian projects around the world, its partnerships with universities to raise awareness about global humanitarian challenges, and samples of food assistance, including canned meat products distributed to beneficiaries.
Mamdouh emphasized that face-to-face engagement with donors provides an invaluable opportunity to share success stories and demonstrate tangible results made possible through their generosity, strengthening public confidence in sustainable and organized humanitarian work.
Engaging Youth and Channeling Their Efforts Toward Good
According to Khalil Meek, Director of Development, the convention also serves as an important platform for promoting a culture of giving and volunteerism. Life actively seeks to recruit new volunteers and involve them in its humanitarian mission while introducing young people and families to opportunities for community engagement and charitable service both within the United States and internationally.
He further noted that participation in the convention enables the organization to establish partnerships and collaborative relationships with other humanitarian and charitable organizations, facilitating the exchange of expertise and best practices that ultimately enhance the effectiveness and reach of humanitarian programs and joint initiatives.
Life’s Gaza Tents Featured in Al Jazeera Coverage
The organization’s activities during the convention received coverage from Al Jazeera, as Life’s exhibition booth attracted significant interest and engagement from participants. Many visitors took part in solidarity activities and wrote messages of support expressing compassion for communities affected by humanitarian crises.
Palestine maintained a strong presence throughout the convention. Participants were invited to write messages of solidarity on a tent that is scheduled to be sent to Gaza through Life for Relief and Development. This initiative builds upon the organization’s shelter support projects launched since the beginning of the war, including nine displacement camps established across northern, central, and southern Gaza.
These camps feature durable, standards-compliant tents that have provided shelter for approximately 46,000 displaced individuals. Designed for easy assembly and relocation to accommodate repeated displacement, the tents are also fire-resistant, helping protect civilian lives. Each tent is equipped with bedding and blankets, while every camp includes a medical clinic, sanitation facilities, solar energy systems, and insulation materials designed to protect residents from winter rains and extreme summer heat.
Life: Ranked Among the World’s Leading Humanitarian Organizations
Life for Relief and Development has been operating in more than 60 countries for over 33 years through a network of 16 international offices. The organization holds Special Consultative Status with the United Nations Economic and Social Council (ECOSOC).
According to Charity Navigator, Life ranks third globally among leading humanitarian organizations, fifth among organizations supporting displaced Palestinians, and fifth among organizations combating poverty worldwide. The organization also received a perfect 100% rating for 2026. In addition, it has been recognized by the United States Agency for International Development (USAID) and named by Impactful Ninja as one of the leading humanitarian organizations in the United States.
Life for Relief and Development was also awarded the Dubai Humanitarian Award for Best Partnership in recognition of its Gaza shelter camp initiative.
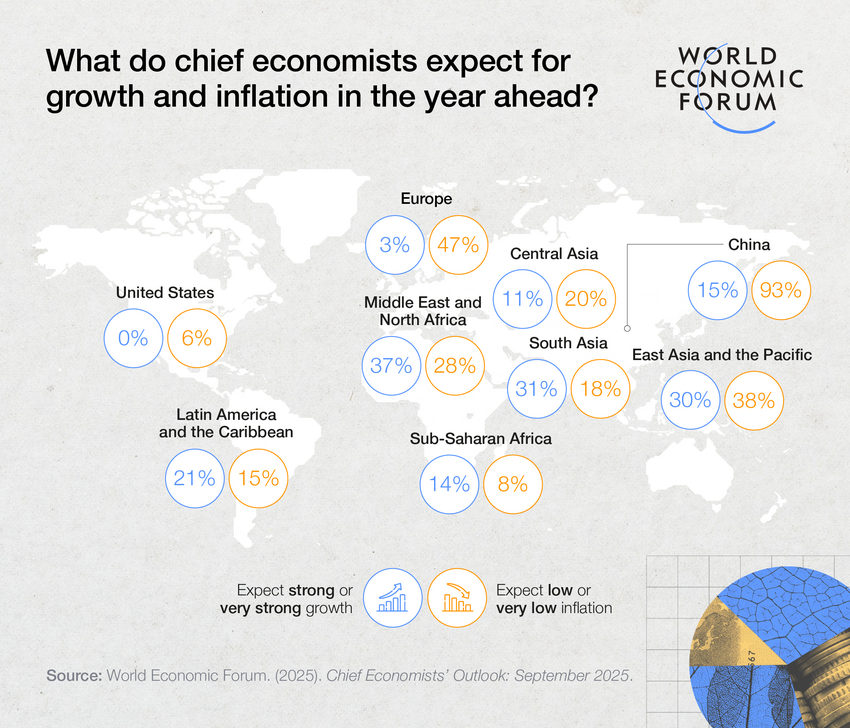
Fragmentation is already costing the global economy $213–$307 billion annually, while adding 0.2–0.3 percentage points to global inflation.
Fragmentation is spreading beyond geopolitical rivals to traditionally allied economies, including the EU, Canada, Japan and South Korea.
Emerging markets are likely to be hit the hardest by these shocks as countries outside the major geopolitical blocs face an estimated 10.7% hit to GDP growth versus 6.4% globally, even as regional initiatives offer new solutions.
New York, USA, June 2026 – Geoeconomic fragmentation imposing an annual cost of $213–$307 billion usd/ $296- $426 billion cad on the global economy, according to a new World Economic Forum report release today. Driven by geopolitical tensions, economic security concerns and shifting trade relationships across major economies, fragmentation accelerated through 2025 and 2026 and is increasingly affecting trade, finance and investment systems.
Deepening Divides: The Cost of a More Fragmented Financial System — published in collaboration with Oliver Wyman, a Marsh business, and the second in the Forum’s fragmentation series — finds that these pressures are playing out through escalating tariffs, investment restrictions and retaliatory measures.
The report finds that the growing use of economic statecraft in 2025 and 2026 marked a turning point for global trade and finance. While the first report focused primarily on fragmentation risks between geopolitical rivals, the latest findings suggest a broader structural shift is underway. Tariffs and investment restrictions are increasingly affecting traditionally aligned economies, including the US, the EU, Canada, Japan and South Korea, raising costs for businesses and increasing uncertainty for cross-border trade and investment.
“The global financial system has faced increasing pressures from geopolitical and economic fragmentation,” says Matthew Blake, Managing Director and Head of the Centre for Financial and Monetary Systems World Economic Forum. “Despite these pressures, the financial system has remained resilient. Markets have continued to provide real-time feedback on evolving policies while policy-makers have generally avoided actions that could erode confidence in the international financial system. As fragmentation persists, preserving the trust and stability that underpin global finance will be critical to supporting long-term growth and prosperity.”
The economic costs are rising As fragmentation becomes more embedded across markets and financial systems and barriers rise even among allies, the risks of escalation and long-term economic disruption increase. If current trends accelerate into more severe fragmentation scenarios, global losses could reach as much as $6.9 trillion usd, or 6.4% of global GDP, according to the report’s modelling, an economic impact larger than every economy in the world except the US and China.
Ultimately, fragmentation impacts both businesses and households. Current fragmentation policies are estimated to add 0.2–0.3 percentage points to global inflation, eroding purchasing power across most economies. The sharpest real wage impacts are seen in the United States, where real wages are estimated to be 0.33% lower for low-skilled workers, 0.49% lower for medium-skilled workers and 0.66% lower for high-skilled workers, with similar purchasing-power pressures visible in other major economies.
“In conversations with business leaders around the world, the message is remarkably consistent: What businesses need most right now is predictability, and they are not getting it,” says Daniel Tannebaum, Partner and Global Leader, Anti-Financial Crime Practice, Oliver Wyman, a Marsh business. “Without clearer guardrails around tariffs, sanctions and other economic measures, the risks to investment, growth and financial stability will continue to mount.”
Emerging markets face the sharpest exposure Emerging markets and developing economies (EMDEs) are likely to be the hardest hit by the impacts of growing financial fragmentation. In the most extreme fragmentation scenario, countries outside the major geopolitical blocs, most of which are EMDEs, could face output losses of 10.7%, compared to a global decline of 6.4%.
Structural factors like shallower capital markets make EMDEs more dependent on international capital flows and more vulnerable to the negative impacts of a less integrated financial system.
Africa exemplifies both the risks and potential resilience pathways. The continent’s exposure to external capital flows means a more fragmented system would make development financing more expensive and less predictable. At the same time, regional integration – through initiatives like the African Continental Free Trade Area (AfCFTA) and payment systems such as Pan-African Payment and Settlement System (PAPSS) – offers pathways to build resilience in Africa, which also stands to benefit from such secular trends as population growth and an abundance of critical raw materials.
While fragmentation is unlikely to reverse in the near term, it can be managed. The report identifies five actions policy-makers can take to mitigate fragmentation:
Policymakers can limit the damage
Establish shared guardrails to protect the financial system from fragmentation, emphasizing principles like safeguarding the rule of law and independent monetary policy, limiting the seizure of sovereign assets, and protecting the integrity of government data.
Align on rules to guide the use of economic statecraft policies that advance national security and resilience objectives without undermining global growth.
Ensure policy predictability to sustain investment flows and allow for the continued functioning of cross-border capital and financial markets.
Maintain interoperability across payment and digital currency systems and prepare businesses for a more fragmented geoeconomic operating environment.
Advance regional integration initiatives such as the AfCFTA and PAPSSP, as well as support the development of domestic and regional capital markets, including the European Savings and Investments Union.
Together, these measures can help preserve financial stability and resilience even as the global economy becomes more fragmented.
Report methodology
The report updates the Forum’s 2025 fragmentation analysis to reflect policy and market developments across 2025 and early 2026. Its quantitative modelling estimates the economic impact of current trade and financial policies and examines multiple escalation scenarios across output, inflation, trade flows and wages.
The analysis also incorporates updated assumptions on tariffs, countermeasures, pass-through rates and restrictions on services trade, alongside qualitative insights from business leaders, policy-makers and financial-sector experts, including regional perspectives from Africa.
About the Annual Meeting of the New Champions 2026
The 17th Annual Meeting of the New Champions will take place from 23 to 25 June 2026 in Dalian, People’s Republic of China, under the theme “Innovating at Scale”. The meeting will bring together 1,500 cross-sector leaders to explore how innovation and emerging technologies can unlock new growth models and drive positive economic momentum in a fast-shifting global landscape.
The United States is taking coordinated action to sever the Iranian regime’s access to the revenue streams that fuel its regional aggression and global terrorism.
The Department of State is sanctioning numerous entities, individuals, and vessels that form the backbone of Iran’s illicit oil economy, directly targeting the financial lifelines of the Islamic Revolutionary Guard Corps (IRGC) and Iran’s military apparatus.
As part of this action, State is designating eight entities and identifying eight vessels as blocked property for their transportation of Iranian petroleum, or petrochemical products, and also designating three entities and an individual in connection with trade in Iranian-origin petrochemical products.
Concurrently, the Department of the Treasury is sanctioning key players in an oil sales network that has moved tens of millions of barrels of Iranian oil worth billions of dollars. These Hong Kong-based entities have facilitated the storage, transport, and sale of this oil, directly funding the IRGC, Iran’s Armed Forces General Staff, and its military apparatus. This network represents a critical node in Iran’s ability to generate revenue for destabilizing activities across the Middle East.
The United States will not hesitate to take action against anyone, anywhere, funding the Iranian government’s ability to attack its neighbors and its own people. Any entity cooperating with Iran’s illicit oil trade or trading Iranian energy products faces the risk of exposure to U.S. sanctions.
Additionally, the Rewards for Justice (RFJ) program is offering a reward of up to $15 million usd/ $20.7 million cad for information leading to the disruption of the financial mechanisms of Iran’s IRGC and its various branches. More information is available on the RFJ website.
Today’s actions are being taken pursuant to Executive Order (E.O.) 13224, as amended, and Executive Order (E.O.) 13846. All Department of Treasury targets are being designated pursuant to E.O. 13224, as amended, which targets terrorist groups and their supporters. All Department of State targets are being sanctioned pursuant to Executive Order (E.O.) 13846, which authorizes and reimposes certain sanctions with respect to Iran. These actions continue the robust sanctions campaign targeting Iranian oil sales in support of Economic Fury and the President’s National Security Presidential Memorandum 2 (NSPM-2), instituting a campaign of maximum economic pressure on Iran.
For more information on this action, please see the Department of the Treasury’s press release Press Releaseand the Department of State’s Fact Sheet.
Life for Relief and Development calls for increased global support as rising living costs and food insecurity intensify humanitarian needs worldwide
World’s Most Vulnerable Is An Increasing Demographic
As the costs of food, fuel, housing, healthcare, and necessities continue to climb across the globe. Humanitarian organizations are warning that the world’s most vulnerable populations are facing increasingly devastating consequences. In 2024, more than 295 million people across 53 countries experienced acute hunger, marking the sixth consecutive year global food insecurity has worsened. That number has since risen to 343 million. Families already living in poverty are now being pushed further into crisis, forced to make impossible decisions between food, medicine, education, and shelter.
Surging Inflation
According to international economic and humanitarian reports, surging inflation, supply chain disruptions, ongoing conflicts, climate-related disasters, and economic instability have significantly increased the cost of living worldwide. While these rising pressures are affecting households everywhere, the burden falls disproportionately on low-income communities and developing nations, where millions are already struggling to meet basic daily needs.
Life for Relief and Development (LIFE), a global humanitarian organization dedicated to providing aid regardless of race, gender, religion, or cultural background, is witnessing firsthand the growing impact economic pressures have on crisis-affected communities across the Middle East, Africa, Asia, Eastern Europe, and beyond.
Limited Resources
“In many of the communities we serve, families were already surviving on very limited resources,” said Dr. Hany Saqr, CEO of LIFE. “Now, with food prices soaring and essential goods becoming increasingly unaffordable, many parents are struggling simply to feed their children. What may feel like inflation in one part of the world can become a matter of survival in another.”
LIFE’s humanitarian teams continue to respond through emergency food assistance, orphan support programs, healthcare initiatives, clean water projects, seasonal aid distributions, and long-term development efforts aimed at helping families regain stability and self-sufficiency. Working in more than 60 countries, LIFE has helped deliver $667 million usd/ $922.4 million cad in humanitarian assistance over the past three decades, supporting vulnerable communities affected by conflict, hunger, displacement, poverty, and disaster.
“Humanitarian aid is no longer just about responding to emergencies after they happen,” Dr. Saqr added. “For millions of families, assistance is what prevents a difficult situation from becoming a catastrophe.”
In addition to its ongoing humanitarian initiatives, LIFE will perform Udhiyah/Qurbani distributions this year in 32 countries. Through the annual program, fresh meat will be distributed to families experiencing difficulty during Eid al-Adha. Last year, the initiative helped combat food insecurity for nearly 200,000 people worldwide, including families in Gaza who received canned meat distributions due to ongoing access restrictions. LIFE says the program not only helps provide nutritious meals but also allows vulnerable families to participate in Eid with dignity.
Growing Challenges
As the world continues to face growing economic and humanitarian challenges, compassion, shared responsibility, and collective action can play a significant role in shaping a more just and hopeful future. Life for Relief and Development believes that meaningful change begins when people choose not to turn away from suffering but instead work together to help create a more humane, equitable, and sustainable world while opening pathways toward greater stability and opportunity for future generations.
Since its creation in 1987, the Office of the Superintendent of Financial Institutions (OSFI) has served as Canada’s federal micro-prudential regulator, operating under a single-head governance model that was suitable at the time but has not undergone a major review in nearly three decades.
Particularly following the 2008 financial crisis, OSFI’s activities have expanded in response to a more complex and rapidly evolving environment in which Canadian financial institutions operate. Meanwhile, governance practices across the financial sector have modernized, leaving OSFI’s structure increasingly out of step with its domestic and international peers.
To modernize OSFI’s governance, policymakers should mandate regular parliamentary oversight and introduce a multi-member model, such as a board of directors supported by advisory committees. These changes would strengthen transparency, accountability, and diversity of perspectives, ensuring that OSFI remains a credible and responsive regulator.
OSFI would also benefit from a periodic review of its governance framework. A formal review cycle, at least once every decade, would help keep its governance model current, effective, and aligned with its expanding responsibilities.
Introduction
Canada’s financial system faces a brave new world of risks, from geopolitical fragmentation and cyber threats to climate-related shocks, that place new demands on its regulators. But the governance structure of the Office of the Superintendent of Financial Institutions (OSFI), the country’s federal prudential regulator, has remained largely unchanged for decades.
OSFI was established in 1987 to ensure the safety and soundness of the Canadian financial system, based on recommendations from the Estey Commission. It was formed by consolidating the Department of Insurance and the Office of the Inspector General of Banks.
A Superintendent, supported by deputies and staff, holds sole responsibility for prudential regulation and supervision. While OSFI is an independent agency, it is accountable to Parliament through the minister of finance. Its internal governance includes a Departmental Audit Committee (DAC), which advises on risk management, control, and governance frameworks, and an internal audit team that reports to the Superintendent.
This structure differs meaningfully from those of comparable domestic and international regulators. And there are reasons to ask whether its governance structure remains appropriate for today’s environment.
We start with the premise that, since 1987, governance practices, financial services, the risk environment, and OSFI’s mandate and activities have all evolved significantly. Yet the model underpinning OSFI’s structure (see Box 1) has not undergone a major review since the MacKay Task Force in 1998, nearly 30 years ago.
Historically, Canada’s financial system included five main groups: chartered banks, trust and loan companies, the co-operative credit movement, life insurance companies, and securities dealers. These pillars began to dissolve shortly after the formation of OSFI with the 1987 and 1992 revisions to the Bank Act, as large banks acquired trust and loan companies and securities dealers. Recently, some credit unions have become federally regulated.
Today, Canada’s financial sector faces a convergence of risks that challenge traditional prudential supervision and place new demands on regulatory governance. Beyond post-financial crisis concerns about capital adequacy and credit risk, the current landscape includes geopolitical tensions that could disrupt cross-border resolution and capital flows (Zelmer 2025), increasingly sophisticated cyber threats (including state-linked attacks [OSFI 2025]), and escalating physical and transition risks from climate change (IMF 2025a). While OSFI has strengthened its supervisory frameworks in areas such as cyber resilience and climate risk, these pressures highlight the importance of a governance structure capable of navigating complex trade-offs between stability, competitiveness, resilience, and public confidence.
OSFI’s responsibilities have also expanded. Since 2012, it has overseen the insurance activities of the Canada Mortgage and Housing Corporation (CMHC). In 2016, it introduced a mortgage stress test, increasing its direct impact on individual Canadians. More recently, the passage of Bill C-47 in 2023 requires OSFI to examine whether federally regulated financial institutions have adequate policies and procedures related to integrity and security.
Compared with its peers, OSFI’s governance model is unusual. Many comparable regulators operate with boards (OECD 2010). The OECD (2014) identifies several advantages of multi-member governing bodies: they are less susceptible to regulatory capture than a single decision-maker; they better balance judgment in complex, principles-based regulatory environments; and they provide collective support for strategic oversight. All three apply to OSFI. While its track record reflects strong leadership, distributing authority would reduce institutional vulnerability by design, rather than relying on any one individual. A multi-member body would also provide a structured forum for debating complex trade-offs and challenging internal decision-making as OSFI confronts emerging risks such as AI and cyber threats.
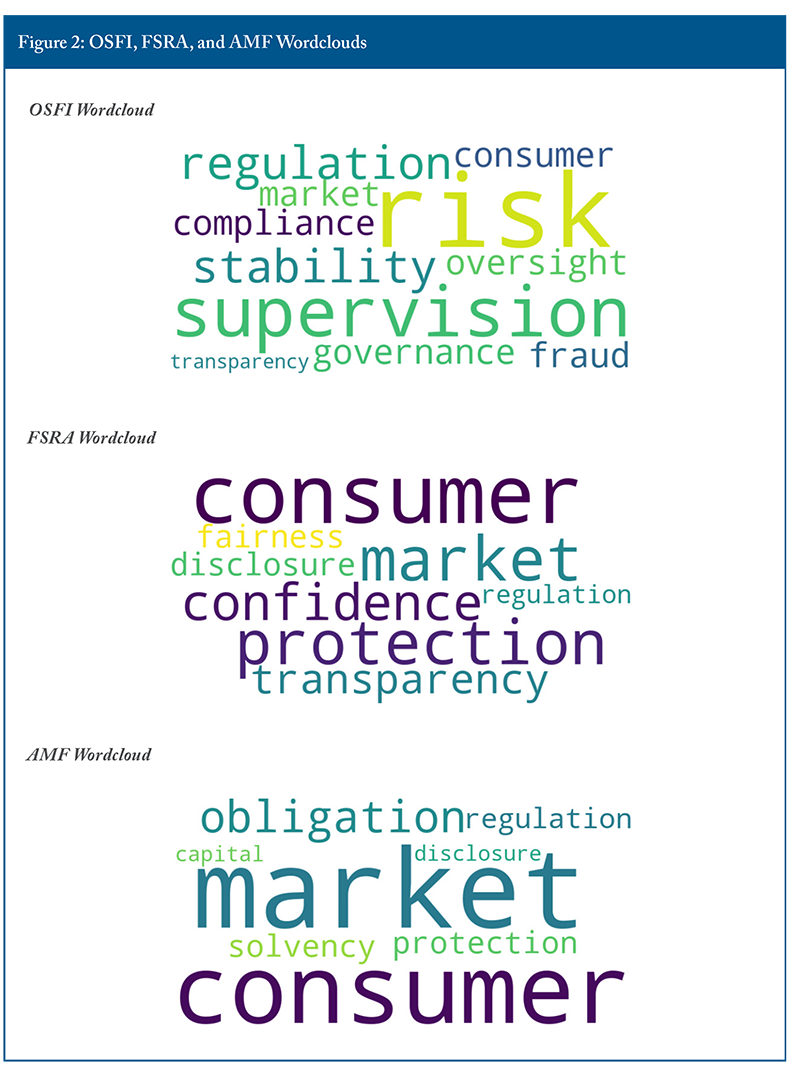
International counterparts following such practices include the UK’s Prudential Regulation Authority and Australia’s Prudential Regulation Authority. Domestically, newer regulators such as the Financial Services Regulatory Authority of Ontario (FSRA), along with securities regulators like the Ontario Securities Commission (OSC), have adopted board governance structures.
Given the evolving financial landscape, a shift from a single-head model to a multi-member structure is warranted. Regulating the financial system requires a balancing act that collective decision-making provides by offering a diversity of opinions, expertise, and perceptions. As OSFI’s activities expand into areas such as cybersecurity and financial institution governance, it also requires new subject-matter expertise to develop compliance and enforcement capabilities in new areas.
We therefore recommend that OSFI transition to a multi-member governance structure, including a board of directors and advisory councils. This would strengthen independence, enhance transparency and accountability, and align OSFI with best practices in regulatory governance.
OSFI’s governance model should also undergo periodic review – something that has not occurred since the MacKay Task Force nearly three decades ago (see Box 2). This absence has left the framework misaligned with international best practices. Conducting a formal review at least once every 10 years would ensure that the model remains current and fit for purpose in fulfilling OSFI’s mandate and Canadians’ expectations.
OSFI Expanded Responsibilities and Activities
Since the 2007-08 global financial crisis, OSFI’s mandate and responsibilities (Figure 2) have broadened significantly in response to rising systemic risks and a more complex financial landscape. As noted, OSFI oversees CMHC, particularly its commercial activities in the mortgage insurance sector – an area critical to housing market dynamics and, by extension, to household debt and consumption patterns.
OSFI has also taken a more proactive role in setting regulatory expectations. Since 2016, it has accelerated the issuance of guidelines on governance, capital adequacy, and insurance practices of federally regulated financial institutions (FRFIs). In some cases, these guidelines go beyond traditional supervisory functions and increasingly influence Canadians’ everyday financial experiences.
One prominent example is the Minimum Qualifying Rate (MQR) or “mortgage stress test” introduced by OSFI in 2018. It requires lenders to verify income and apply a minimum qualifying rate to uninsured mortgages. The stress test is designed to evaluate the solvency of mortgage holders under adverse interest rate conditions, reduce systemic risk in the housing market, and support sound financial management of financial institutions. While it strengthens system resilience, this approach may limit household credit availability and affect Canadians’ capacity to purchase homes.1
More recently, the passage of Bill C-47 by the federal government in 2023 further expanded OSFI’s authority. It allows OSFI to assess whether FRFIs have adequate integrity and security policies and procedures. This change reflects the shift toward a broader conception of financial stability. As a result, the Superintendent’s responsibilities have grown in both complexity and impact.
Although OSFI has developed the in-house expertise2 to manage its expanded functions, its evolving role would benefit from greater external input.3 Incorporating diverse perspectives would strengthen its ability to challenge prevailing internal perspectives and ensure that its regulatory approach remains well-informed, while anchored in its prudential mandate.
The Pros and Cons
Before making the case for transitioning OSFI to a multi-member model, it’s useful to set out the advantages and limits of each governance model. Regulators generally use three models. The first is a multi-member body that sets strategic direction and operational policy, while delegating regulatory decisions to a chief executive officer. The second is a commission model, also multi-member, in which a collective makes most substantive decisions. The third is a single-head model, where one individual holds primary decision-making authority.
The Organisation for Economic Co-operation and Development (OECD 2014) provides the established international framework for evaluating regulatory governance, including the choice between single-member and multi-member governance structures for independent regulators. It identifies when a multi-member governance model adds value, outlines the design considerations, and offers a framework for applying these factors to a specific regulator. Table 1 summarizes the main advantages and disadvantages of a multi-member body.
When a multi-member body adds value
The OECD (2014) identifies five factors in determining whether a multi-member governing body adds value.
Potential consequences of regulatory decisions: A collective is less susceptible to regulatory capture4 than an individual and benefits from a wider range of perspectives.
Need for diverse judgment: In complex or principles-based regulation, collective decision-making better balances judgment factors and minimizes the risks of varying judgments.
Degree of strategic guidance and oversight required: This is especially important when developing new regulations and deploying resources because a multi-member model provides the necessary collective support for strategic considerations.
Maintaining regulatory consistency over time: A group can better maintain consistency by providing “corporate memory” in decisions that rely heavily on judgment.
Decision-making independence: Boards are generally less susceptible to political or industry influence than a single decision-maker.5
What the single-head model offers that a multi-member model risks losing
By identifying when multi-member governance adds value, the OECD framework implicitly identifies the conditions under which a single-head model is better suited.
One of the clearest advantages of the single-head model is that responsibility is unambiguous. At OSFI, the Superintendent is directly accountable to the minister of finance, Parliament, and the public. Having a board does not automatically improve accountability. It can, if poorly designed, diffuse it.
The single-head model also enables faster, more decisive action. It avoids the delays of consensus-building and supports rapid responses to emerging risks or mandate changes. It can also minimize the risk of policy conflict that may arise when multiple board members hold divergent views.
These are not trivial considerations. As a microprudential regulator, OSFI must often respond rapidly to emerging risks and take swift decisions on a case-by-case basis. The ability to act without delay is valuable. A poorly designed multi-member body could slow responsiveness and introduce the kind of internal disagreement that undermines regulatory certainty. The OECD (2014) acknowledges this risk, noting that where a regulator has a high volume of time-sensitive decisions, the full governing body may need to delegate extensively.
The tension between models is genuine.
The OECD framework does not prescribe a single model but asks whether, on an honest assessment of the five criteria, the case for collective governance has been met. As the following sections argue, OSFI’s expanded mandate, the more complex risk environment, and the breadth of judgement now required shift that balance toward a multi-member model, provided the design risks are carefully managed.
The Evolving Risk Environment: A Case for Enhanced Governance
As this section demonstrates, Canada’s financial sector faces an unprecedented convergence of risks – geopolitical instability, cyber threats, climate change, and complex capital regulation trade-offs – that has expanded well beyond post-financial crisis concerns and fundamentally challenges traditional regulatory approaches. This shift raises the question of whether OSFI needs a new governance approach.
The answer is yes. As these risks grow in scope and complexity, OSFI’s governance structure should evolve accordingly. While the current model concentrates decision-making authority in a single Superintendent, a board could bring together experts in geopolitics, cybersecurity, climate science, international finance, and domestic economic policy to inform OSFI’s strategic direction. It would provide a forum for debating complex trade-offs, such as balancing financial stability with economic growth or weighing international regulatory coordination against domestic competitive concerns, in a more transparent and accountable manner. Most importantly, it would enhance OSFI’s legitimacy and public confidence in its decision-making during periods of intense scrutiny.
Geopolitical Risk and Cross-Border Vulnerabilities
Rising geopolitical tensions present fundamental challenges to Canada’s internationally active financial institutions. As Zelmer (2025) notes, weakening cross-border cooperation, particularly involving the United States, could make it harder to manage the recovery or orderly resolution of internationally active Canadian financial institutions during periods of distress. Foreign regulators may ring-fence assets within their jurisdictions, limiting Canadian authorities’ access to the capital and liquidity needed to protect domestic depositors and creditors. This risk is especially significant because Canada’s six major banks have substantial operations and exposures in the United States and other foreign markets.
These emerging and potentially politicized risks highlight the value of a board in providing independent, collective support for OSFI’s strategic direction.
Cyber Risk and Technological Threats
Cyber threats targeting financial institutions have increased in frequency and sophistication. In 2023, 26 percent of finance and insurance firms experienced cybersecurity incidents, compared with 16 percent across the private sector.6 Furthermore, the threat of cyberattacks remains high in Canada (IMF 2025b), and money laundering and fraud attempts from criminals and state-linked actors are becoming more advanced and difficult to detect (OSFI 2025). These activities will likely intensify with advances in AI and digitalization.
OSFI has acknowledged that foreign actors may target Canadian institutions for financial gains and geopolitical purposes (OSFI 2025). Repeated incidents in the financial sector could erode confidence and threaten its stability, causing spillovers to the rest of the economy.7
A 2025 IMF Financial Sector Assessment Program review of Canada found that while OSFI’s cyber risk supervisory framework is strong, gaps remained in coordination with federal and provincial authorities, and that OSFI’s integrated mandate enables it to detect advanced cyber threats beyond conventional risks (IMF 2025b). Given the complexity of these risks, a well-designed board with the right expertise could offer appropriate support in developing a strategic plan to mitigate these risks.
Climate Risks
Climate change presents both transition and physical risks to Canada’s financial system, with broader macroeconomic effects. It can reduce GDP (Dahlhaus 2025), increase inflation volatility (Duprey and Fernandes 2025), and negatively affect employment (Duprey et al. 2024). The 2016 Fort McMurray wildfire alone caused an estimated $9.9 billion in damages and reduced quarterly GDP by 0.4 percent (Statistics Canada 2024). These risks are expected to intensify, with projections indicating more frequent and severe weather conditions and longer wildfire seasons across much of Canada (IMF 2025a).
OSFI’s Guideline B-15 sets out expectations for FRFIs’ management of climate-related risks.8 However, the IMF’s recent assessment of climate risk in Canada’s financial sector recommends that OSFI strengthen its climate risk supervision through better data, coordination, and stress testing (IMF 2025a). A board with relevant expertise could help guide OSFI’s strategic response, while an advisory committee could support technical policy development in this area.
Domestic Regulatory Complexity: Basel III and Capital Requirements
Implementing Basel III reforms has created significant domestic challenges. In 2024-2025, OSFI faced intense public scrutiny over its approach to implementing the Basel III standardized capital floor (Zelmer 2024), with Superintendent Peter Routledge noting that the intensity of attention was new to OSFI and provided an opportunity to communicate more clearly to Canadians (OSFI 2024). The Superintendent noted that some observers argued that OSFI’s decision would have “a consequential and negative impact on economic growth, arguing that dramatically rising capital requirements would slow lending and then economic growth” (OSFI 2024).
OSFI’s decision to indefinitely defer increases to the Basel III standardized capital floor level reflected concerns about competitive balance in the international banking system, as uncertainty remained about when other jurisdictions would fully implement Basel III.9 These are precisely the kinds of complex, multi-dimensional trade-offs that a board, equipped with expertise in international finance, economics, and competition policy, could be designed to support and challenge. A structured deliberative process within a governing board could provide a forum to assess these issues transparently and reduce perceptions of reactive or politically influenced decision-making.
The General Case for Multi-Member Governance at OSFI
The previous sections have shown that, across multiple dimensions of OSFI’s expanded mandate and activities, a multi-member governance structure could create net benefits over the current single-head model. This section shows how OSFI’s governance structure is out of step with comparable regulators domestically and internationally and draws lessons for reform.
International Comparison of the Governance Structures of Financial Institutions’ Regulatory Supervisors
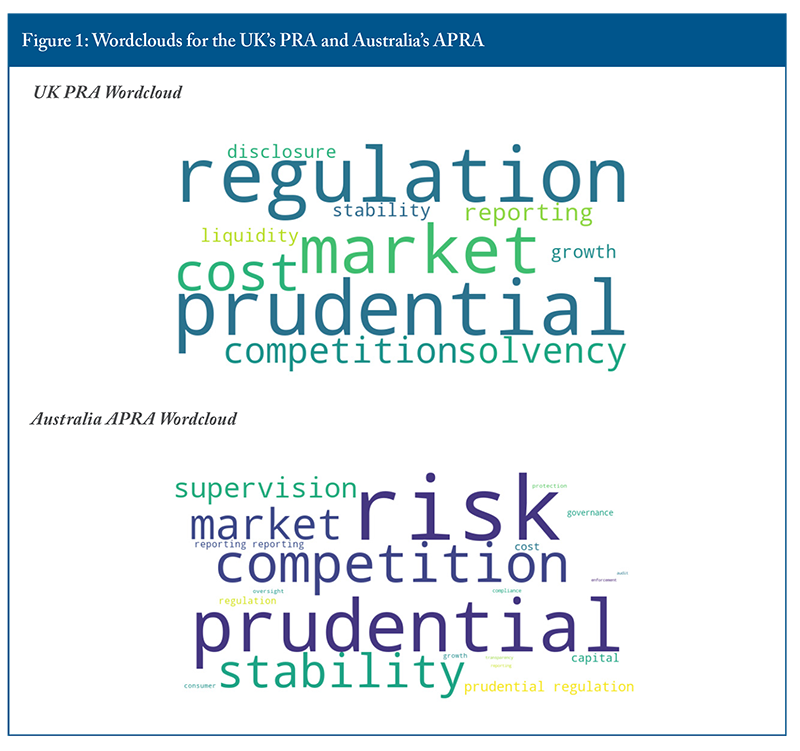
We compare OSFI’s governance structure with the Australian Prudential Regulatory Authority (APRA), the UK’s Prudential Regulatory Authority (PRA), and Switzerland’s Financial Market Supervisory Authority (FINMA). All have similar mandates: they regulate financial institutions but are not responsible for promoting consumer protection.10
APRA uses a commission model that supports collective decision-making and incorporates a range of perspectives, thereby reducing dependence on any single leader. Its executive board of three to five government-appointed members, including the CEO as chair, manages operations and sets strategy. However, the responsibility for balancing immediate operational demands with long-term strategic priorities ultimately remains concentrated in a single authority. A clearer separation of these roles might yield a more effective balance. Consequently, this governance approach remains vulnerable to some of the same challenges faced by the single-head model. Furthermore, a lack of external views may hinder strategic decisions, given that the members are all employees and thus not independent of APRA.
Switzerland’s FINMA represents a cleaner governance board model and is widely seen as best practice (OECD 2014). An independent board of seven to nine expert members from academia and industry sets the strategic oversight and long-term planning, and oversees an executive team led by a CEO. No FINMA employees or ministry of finance officials sit on the board, ensuring independence. Its architecture creates a clear distinction between strategic and operational management. The board enhances the executive team’s accountability, and its composition strikes the right balance of multidisciplinary expertise between market practitioners and academics. Bringing expertise from law, finance, economics, and insurance helps align long-term strategy with evolving risks. However, safeguards are needed to prevent decision-making delays and mitigate potential biases.11
The PRA in the UK functions uniquely as part of the country’s central bank, and the Bank of England (BoE) employs the PRA staff. As a microprudential regulator, the PRA focuses on ensuring individual financial institutions are well capitalized and avoid excessive risk-taking, but through the lens of the effects those firms can have on system stability.12
Its structure is similar to the APRA’s in that it’s also governed by a commission, the Prudential Regulation Committee (PRC). At least six external expert members appointed by the government sit on the PRC, which makes it more independent.13 External members bring both market experience and academic insight, balancing practical relevance with historical and policy context. However, the presence of the BoE Governor on the board of both institutions, though a deliberate institutional choice given the PRA’s mandate orientation toward the systemic effects of firm-level risk, may raise questions about accountability and the separation of firm-level and system-level considerations in a crisis.
While OSFI’s single-head governance model offers advantages, experience across comparable jurisdictions reinforces the view that a multi-member governance structure is the most adequate for financial sector regulators. Diverse expertise and collective judgment improve decision-making and help regulators meet increasingly complex mandates. Given OSFI’s similar responsibilities, industry context, and evolving risk environment, these international experiences offer practical lessons for transitioning to a multi-member structure.
The Evolution of Provincial Financial Regulators
Recent Canadian reforms also support this shift. In 2022, the Ontario government revised the governance structure of the OSC (see Figure 3)14 to embrace evolving governance best practices as recommended by the Ontario Capital Markets Modernization Taskforce. The Taskforce determined that the OSC’s previous single-headed leadership structure hindered strategic oversight and operational execution, thereby limiting the organization’s overall effectiveness. It separated the Chair and CEO roles and established a board of directors (Capital Markets Modernization Taskforce 2021). Under this new model, the CEO oversees day-to-day regulatory operations, while the board sets strategic direction and governance.
Prior to that, Ontario adopted modern governance standards when it created FSRA in 2019, replacing FSCO and DICO with an agency led by an independent board and a separate CEO responsible for day-to-day management (FSRA 2025). The board sets strategic direction, oversees governance, and monitors the regulator’s performance against its mandate. The Chair of the Board serves as the primary liaison with the responsible ministry. The board has 12 members (up to 11 independent permitted plus the CEO), all with financial sector experience.15
The Canada Deposit Insurance Corporation as Institutional Comparator
The case for external board governance at OSFI is not limited to international and provincial precedents. The Canada Deposit Insurance Corporation (CDIC), which is part of Canada’s federal financial safety net, has a similar institutional structure.
CDIC operates with a board of directors, handles institution-specific supervisory data of comparable sensitivity to OSFI’s, and carries a mandate – deposit insurance, financial system stability, and resolution authority – that is functionally interdependent with OSFI’s prudential supervision role.
CDIC’s board comprises 12 members: six ex officio public sector directors drawn from the Department of Finance, the Bank of Canada, OSFI, and FCAC; and six private sector directors appointed by the Governor in Council for terms of up to four years. The CDIC Act16 bars current federal public servants, members of Parliament, and anyone affiliated with a federal or provincial financial institution from sitting on the board as private sector director. This exclusion addresses conflicts of interest while preserving access to relevant expertise. This demonstrates that statutory design can resolve the tension between independence and sectoral knowledge without foreclosing either.
The board’s mandate extends beyond administrative oversight to include strategic direction and decision-making authority over interventions in member institutions. These decisions are sensitive and time-critical, and often cited as incompatible with OSFI’s operating environment. CDIC’s experience suggests otherwise: a board can exercise strategic authority without displacing management.
Confidentiality concerns are also manageable. CDIC’s board routinely handles granular information on member institutions, subject to the conflict-of-interest rules and confidentiality obligations set out in the CDIC Act and the FAA. The practical management of confidential supervisory information within a board governance structure can be an established operating condition. There is no clear reason why similar arrangements could not function at OSFI, which is subject to comparable statutory confidentiality provisions and operates within the same inter-agency information-sharing framework.
The Office of the Auditor General of Canada has validated this model,17 finding CDIC’s governance sound and its board effective. This is further evidence that board governance of a federal financial body operating in a confidential supervisory environment is institutionally sustainable and withstands rigorous independent scrutiny over time.
In addition, the OSFI Superintendent already sits on CDIC’s board as an ex officio member, participating in board governance. The Superintendent is therefore already a participant in board-level governance of a federal financial institution operating under the same confidentiality constraints.
Taken together, the CDIC model helps in making the case for an OSFI board and shows that confidentiality constraints don’t render external governance impractical and need not compromise operational independence. The relevant question for reform is not feasibility, but how to define the boundary between board oversight and the Superintendent’s authority to preserve supervisory independence. We turn to that question next.
OSFI’s Next Review
The preceding sections have shown that board governance can coexist with operational independence across a range of international and domestic institutional comparators. The next question relates to design – how to structure such a board and allocate authority among the board, the Superintendent, and the minister.
OSFI’s mandate and governance structure have not been reviewed since 1998. This lack of periodic reviews is itself a structural gap. Comparable financial regulators in Canada and abroad undergo regular assessments of their mandate, governance, and accountability. OSFI has not. A review is warranted not because of weak performance, but because its governance framework has not been evaluated against current institutional standards, peers, or international norms in nearly 30 years.
A review focused on board governance should address, at minimum:
What public policy outcomes should OSFI deliver?
What operational, legislative, or regulatory changes would improve its effectiveness in the face of changing market realities?
Would a new governance model strengthen or weaken political oversight needed to keep legislation and enforcement up to date?
How would alternative governance structures affect the risk of stakeholder regulatory capture?
How can governance design account for Canada’s unique federal/provincial division of financial sector regulatory responsibilities and ensure desired regulatory outcomes can be effectively achieved?
How should statute define the boundary between board strategic oversight and the Superintendent’s authority?
What appointment criteria and processes would ensure board independence without limiting access to relevant financial sector expertise?
How should the board be accountable to Parliament, and how would this differ from the Superintendent’s reporting obligations?
What, if any, role should the board play in the use of macroprudential tools such as the Domestic Stability Buffer?
How should the accountability relationship between the Superintendent and the minister of finance be preserved or clarified in the context of a multi-member governance structure?
The next section addresses some of these questions and sets out a proposed governance architecture that draws on the institutional comparators examined and the design lessons from the MacKay Taskforce.
A Roadmap to Improve OSFI’s Governance
We now turn to how OSFI can improve its governance structure by incorporating diverse perspectives and enhancing its credibility with stakeholders. Effective governance frameworks for government agencies must safeguard against undue political or industry influence.
While OSFI maintains a professional relationship with regulated institutions, there is no evidence of regulatory capture within the Canadian financial system (IMF 2014). Nonetheless, a board structure could further strengthen OSFI’s independence by reducing vulnerability to such influence. Collective governance bodies are less susceptible to capture than individual decision-makers and can enhance institutional credibility (OECD 2014; Jabotinsky and Siems 2017). This is not to suggest that any Superintendent has been susceptible to such influence. Rather, distributed authority and diverse membership provide a durable safeguard that does not depend on any one individual.
Given OSFI’s expanding mandate and activities, the board could provide strategic oversight and support, while reinforcing institutional memory and consistency. It would allow the Superintendent to focus more on day-to-day operations while contributing to long-term strategy.
To achieve this, we recommend two changes: an independent board of directors to provide strategic oversight and expertise; and advisory councils to supplement OSFI’s knowledge in emerging risk domains such as cybersecurity and artificial intelligence.
1. Board of Directors
The board would:
Approve strategic direction, policies, culture, and risk appetite, and provide independent advice to the Superintendent.
Be accountable to Parliament and subject to its oversight and scrutiny.
Periodically review OSFI’s policy effectiveness (e.g., the MQR stress test or the Domestic Stability Buffer).
Approve the budget, review OSFI’s Annual Risk Outlook, and provide a challenge function.
Execute decisions on prudential tools such as the MQR or the Domestic Stability Buffer.
Structure of the Board
To provide OSFI with diversity of expertise and perspective, the board of directors should:
Exclude members from FISC and regulated industries to maintain independence.19
Draw members from academia, former regulators (including those from other jurisdictions), risk specialists, and former industry practitioners.20
Include an independent chair and five to nine members with multidisciplinary expertise. The Superintendent should serve as a member, and a government representative (e.g., deputy minister of finance) could serve ex officio.21
Use three-year renewable terms with staggered appointments to ensure continuity.22
This structure differs fundamentally from the existing DAC. The DAC is an advisory body within OSFI that provides independent advice and recommendations to the Superintendent on risk management, internal controls, and governance frameworks. The DAC is composed of a majority of external members drawn from outside the federal public administration, with relevant experience in private and public sector financial reporting. Members are selected by the Superintendent and approved by the Treasury Board. At least one member must hold a professional accounting designation. The Superintendent sits as an ex officio member.
The proposed board of directors differs from the DAC in many respects (Table 2). Where the DAC looks backward to verify that established processes were followed, the board looks forward to challenge whether OSFI is pursuing the right strategic priorities. Where the DAC reports to the Superintendent, the board exercises independent oversight over the Superintendent. And where the DAC has no parliamentary accountability function, the board would serve as a formal mechanism linking OSFI’s governance to parliamentary scrutiny, which is a function that currently does not exist.
The distinction is substantive, not incremental: the DAC strengthens process integrity, while the board would strengthen the legitimacy of OSFI’s direction. Both are necessary, but one cannot substitute for the other.
2. Advisory Committees
Financial regulators commonly use advisory committees to access industry expertise and incorporate market perspectives into policymaking. For example, the OSC is supported by seven distinct third-party advisory committees to provide input on new policies, assess regulatory impacts, and communicate stakeholder concerns.23 These committees focus on specific technical or sectoral topics and provide advice to staff, drawing on both market participants and regulators.
Internationally, the UK’s PRA uses the Practitioner Panel to represent the interests of industry practitioners to fulfill a statutory duty. This independent panel provides expert input on the PRA’s policies and constructive challenge and advice to ensure that practitioner perspectives are reflected in regulatory decision-making. It meets about six times a year with PRA leadership and has contributed feedback on a range of policy issues, including the implementation of Basel 3.1.
While it is true that financial services regulators already incorporate the views of market participants and stakeholders into their regulatory rules through public consultations, they control these processes by setting the agenda and framing the questions. This approach is episodic and tied to specific rule-making initiatives.
Advisory committees would:
Provide OSFI with a diversity of expertise and perspectives on risk-related issues, particularly in emerging areas where in-house capacity may be limited (e.g., cybersecurity).24
Challenge OSFI’s policy responses on issues such as technology, security, and integrity risks.
Transparency around such bodies would contribute to the credibility of OSFI’s policy responses. Publishing the membership of each group and any recommendations that the body may provide to OSFI would further enhance credibility.
Advisory committees would not:
Engage in federally regulated financial institution work, preserving confidentiality.25
Manage OSFI’s operations, including staffing, budgeting, and internal structure.
Review OSFI decisions and actions for specific institutions.
Participate in OSFI-specific decisions regarding systemic prudential tools such as the MQR or the Domestic Stability Buffer.
Structure of the Advisory Committees
Advisory committees should:
Be independent.
Include members from academia, regulatory bodies (including other jurisdictions), risk specialists, and selected industry practitioners.26
Have an independent chair and at least five expert members with multidisciplinary backgrounds.
Be reviewed periodically to ensure expertise remains aligned with emerging risks, informed by sources such as OSFI’s Annual Risk Outlook and the IMF’s Global Financial Stability Report.
Be time-limited where appropriate (e.g., three-year terms or until a specific policy issue is addressed), reflecting their specific topic of focus.27
While an independent board and advisory committees will minimize the risk of industry influence through normal course operations, it would not, on its own, address the issue of accountability.
Since OSFI derives its authority from Parliament, we recommend that Parliament play an active role in overseeing OSFI. One option would be to legally require OSFI to regularly appear before the House of Commons Standing Committee on Finance (FINA) and the Senate Standing Committee on Banking, Commerce, and the Economy (BANC). To our knowledge, the Superintendent last appeared before BANC in October 2025 and before FINA in 2024.
Regular appearances have proven effective for other institutions, such as the Bank of Canada, by strengthening transparency without compromising independence or responsiveness to emerging risks. Although not legally required to do so, the Bank of Canada appears before Parliament at least twice a year (Binette and Tchebotarev 2019). In 2024, the Standing Senate Committee on Banking, Commerce, and the Economy released a report on the conduct of monetary policy in Canada, in which it recommended formalizing this practice to strengthen accountability and transparency (Senate 2024).
In addition to stronger governance and parliamentary oversight, OSFI would benefit from a structured periodic review of its governance framework, similar to the IMF’s Financial Sector Assessment Program but focused on the regulator itself. In its nearly four decades of existence, the MacKay Task Force has been the only review of OSFI’s governance, and that was nearly 30 years ago. Establishing a formal review cycle, at least once every decade, would ensure that OSFI’s governance remains current, aligned with international best practices, and capable of supporting an increasingly complex financial sector.
Conclusion
The OSFI Act states that its purpose “…is to ensure that financial institutions and pension plans are regulated by an office of the Government of Canada so as to contribute to public confidence in the Canadian financial system.” Since its creation in 1987, OSFI has played an important role in upholding that confidence. Yet the environment in which Canadian financial institutions operate has changed dramatically and continues to evolve due to forces such as digitalization, artificial intelligence, climate-related risks, and geopolitical uncertainty.
Modernizing OSFI’s governance is both timely and necessary. We recommend moving from a single-head model to a multi-member structure, including a board of directors and advisory councils, to broaden the perspectives informing policy decisions. Further, enhancing transparency and accountability through regular appearances before Parliament would reinforce OSFI’s contribution to public confidence in the financial system.
OSFI should also adopt a formal review cycle (at least once every 10 years) to ensure its governance remains aligned with best practices and responsive to emerging risks. Publishing regular updates, conducting consultations, and providing plain-language summaries of board decisions and advisory committee recommendations would further enhance transparency.
Together, these reforms will help OSFI remain a credible and adaptive regulator.
The authors extend gratitude to Hande Bilhan, Glen Hodgson, Phil Howell, Jeremy Kronick, Victoria Mainprize, Peter MacKenzie, Parisa Mahboubi, and several anonymous referees for valuable comments and suggestions.
Jamey Hubbs currently serves on the board of Laurentian Bank. The authors retain responsibility for any errors, and the views expressed in this paper do not reflect those of their past or current affiliations.
Binette, André, and Dmitri Tchebotarev. 2019. “Canada’s Monetary Policy Report: If Text Could Speak, What Would It Say?” Staff Analytical Note/Note analytique du personnel 2019-5. Bank of Canada.
Dahlhaus, T., T. Duprey, and C. Johnston. 2025. “Estimating the impacts on GDP of natural disasters in Canada.” Staff Analytical Note 2025-5. Bank of Canada.
Duprey, T. and V. Fernandes. 2025. “Natural disasters and inflation in Canada.” Staff Analytical Note 2025-8. Bank of Canada.
Duprey, T., S. Jo, and G. Vallée. 2024. “Let’s get physical: Impacts of climate change physical risks on provincial employment.” Staff Working Paper 2024-32. Bank of Canada.
Hartley, Jonathan, and Paixão Nuno. 2024. “Mortgage stress tests and household financial resilience under monetary policy tightening.” Staff Analytical Note 2024-25. Bank of Canada. November.
International Monetary Fund. 2025a. “Canada: Financial Sector Assessment Program—Technical Note on Climate Risks Analysis.” IMF Staff Country Reports 2025/234. https://doi.org/10.5089/9798229021920.002.
______________. 2025b. “Canada: Financial Sector Assessment Program—Technical Note on Cyber Resilience of the Financial Sector.” IMF Staff Country Reports 2025/231. https://doi.org/10.5089/9798229021586.002.
Jabotinsky, Hadar Yoana, and Mathias Siems. 2017. “How to Regulate the Regulators: Applying Principles of Good Corporate Governance to Financial Regulatory Institutions.” European Corporate Governance Institute (ECGI) Law Working Paper No. 354/2017. http://dx.doi.org/10.2139/ssrn.2978112.
Untold millions are sitting on unrecognized cash as most people have jewelry tucked away in a drawer and no clear idea what it’s actually worth … or how to rapidly and safely monetize it. From broken chains and inherited rings to forgotten gold bracelets tucked away in drawers, women and men are realizing that items once viewed as purely sentimental may carry significant financial value at a time when gold prices remain historically elevated and household budgets are tightening..
How To Turn That Stash Into Cash
For years, the only options to turn unwanted jewelry into cash have been those pawn shops as well as local buyers, or resale channels where pricing feels inconsistent and the process lacks transparency and third-party validation. That uncertainty has stopped many consumers from ever trying, leaving potentially valuable items sitting unused. AI is changing that with online tools that now give consumers a fast, transparent way to understand what they have so they can make informed financial decisions.
Today, by simply uploading a photo of a gold necklace, ring or other piece of every day jewelry, users can receive an instant valuation range based on real market data, along with the option to track or sell their items through a more structured process.
“A growing number of households are now reassessing what they already own,” said Nidhi Singhvi, Co-Founder of Unvault , a fintech platform designed to ease and expedite the appraisal and sale of gold jewelry to function as readily monetizable liquid assets. “Jewelry, often dismissed as sentimental rather than financial, is emerging as a hidden source of liquidity. Yet most consumers have no clear understanding of what their pieces are actually worth.”
Unvault is addressing this gap by using AI and live market data to deliver near instant valuations from a simple photo upload, often within 60 seconds. The platform has already processed more than 75,000 valuations and tracks over $50M usd/ $68.5M cad in user assets.
– Gold prices near record highs fueling resale interest (World Gold Council)
– Retail jewelry markups can reach up to 5X intrinsic value
Building Blocks of the Global Economy Are Changing
The architecture of the global economy is undergoing a profound structural redefinition. What once existed as parallel and independent industries—diplomacy, luxury, artificial intelligence, and space exploration—has begun to converge into a single, interdependent system of influence. This transformation represents more than technological progress; it signals the emergence of a new civilizational framework: the Global Innovation Era.
At its foundation, this era is defined by integration over isolation, ecosystems over sectors, and strategic alignment over fragmented competition. Power is no longer concentrated solely within governments or multinational corporations. Instead, it is distributed across highly interconnected global networks that span continents, disciplines, and spheres of influence.
A New Global Lattice
From Russia’s engineering depth to the United States’ leadership in technological innovation, from Australia’s research capabilities to Dubai’s infrastructural ambition, from Monaco’s concentration of capital and luxury to the Caribbean’s strategic positioning in global lifestyle and investment markets—a new global lattice is taking shape. This system is not accidental. It is being deliberately constructed by a new generation of leaders who understand that the future belongs to those capable of connecting what was never designed to be connected.
Redefining Diplomacy: From Statecraft to System Leadership
Diplomacy in the 21st century has evolved beyond traditional political negotiation into a multidimensional instrument of global coordination. It has become a form of system leadership—the deliberate construction of trust frameworks that enable cooperation across governments, industries, and cultures.
Today, diplomacy operates across multiple strategic layers:
Economic diplomacy shaping cross-border capital and investment flows
Technological diplomacy governing artificial intelligence, data ecosystems, and cybersecurity
Cultural diplomacy influencing global perception, identity, and soft power
Environmental diplomacy aligning international sustainability strategies
Educational diplomacy building intellectual capital and global talent pipelines
In this expanded capacity, diplomacy is no longer reactive—it is generative. It establishes the conditions necessary for innovation ecosystems to emerge, scale, and sustain. Without it, global integration fragments into inefficiency and instability.
Luxury as a Strategic Engine of Influence
Luxury is no longer simply a sector of consumption—it is a strategic engine of global influence. It operates as a high-level signaling system that defines aspiration, sets standards, and increasingly prototypes the future of human experience.
Across haute couture, fine jewelry, ultra-prime real estate, private aviation, yachting, and bespoke services, luxury functions as a controlled environment for innovation. Emerging technologies—particularly artificial intelligence—are first deployed in these high-value ecosystems, where personalization, precision, and exclusivity are paramount.
Luxury now serves as:
A driver of experiential and design innovation
A curator of global cultural capital
A bridge between heritage and technological advancement
A platform for integrating advanced technologies into human-centered environments
Its influence extends far beyond its economic footprint. By shaping perception, it indirectly shapes global demand, behavior, and market direction.
Artificial Intelligence: The Cognitive Infrastructure of the Global Economy
Artificial intelligence has become the defining infrastructure of modern civilization. It is not a supplementary tool—it is the cognitive layer upon which global systems are increasingly built.
AI is transforming:
Decision-making, shifting from reactive processes to predictive intelligence
Operations, transitioning from manual systems to autonomous networks
Value creation, moving from resource-based models to data-driven economies
Its applications are systemic:
Global supply chains that optimize themselves in real time
Financial ecosystems that anticipate volatility and opportunity
Creative industries enhanced by generative intelligence
Communication systems that eliminate linguistic and geographic barriers
Security frameworks capable of responding to complex, evolving threats
In this context, AI becomes the invisible architecture of the global innovation ecosystem—quietly orchestrating complexity at scale.
Space: The Expansion of Economic and Strategic Territory
Space is no longer a symbolic frontier—it is an active extension of the global economy. Its commercialization introduces a new dimension of infrastructure, connectivity, and geopolitical relevance.
This expansion includes:
Satellite networks enabling global communication and digital infrastructure
Earth observation technologies transforming environmental and resource management
The rise of space tourism as a new frontier in ultra-luxury markets
Advanced research in microgravity environments
Navigation, defense, and security systems with global strategic implications
Space represents the vertical expansion of economic activity—where technological ambition, geopolitical influence, and commercial opportunity intersect at the highest level.
The End of Silos: The Emergence of Integrated Global Ecosystems
The defining characteristic of the Global Innovation Era is not isolated advancement, but systemic integration.
A single initiative today may require:
Diplomatic coordination across multiple jurisdictions
AI-driven operational intelligence
Luxury-level experience design
Space-based infrastructure support
This convergence marks the نهاية (arabic: nihayat english: the end) of siloed thinking. The most significant breakthroughs no longer occur within industries—they occur at their intersections.
The result is a new paradigm: the ecosystem as the primary unit of value creation.
Within these ecosystems:
Investors, engineers, diplomats, and creatives operate within unified networks
Knowledge flows seamlessly across domains
Innovation accelerates through collaboration rather than competition
This is not incremental evolution. It is a fundamental reconfiguration of how the global economy functions.
The Rise of the Multidisciplinary Global Leader
At the center of this transformation is a new leadership archetype—one defined not by specialization alone, but by synthesis.
These leaders:
Build influence through global networks rather than hierarchical structures
Navigate fluidly between public and private sectors
Combine technological expertise with geopolitical awareness
Design ventures with immediate international scalability
Leverage digital infrastructure to operate without geographic limitation
They understand a critical reality: in a connected world, proximity is no longer physical—it is strategic.
Their advantage lies not in isolated knowledge, but in their ability to connect knowledge across systems.
Global Nodes of Influence
The emerging global ecosystem is anchored in interconnected regions, each contributing unique strategic value:
Russia contributes engineering excellence and scientific depth
The United States leads in technological innovation and capital markets
Australia connects research and sustainability with Asia-Pacific growth
Dubai exemplifies large-scale infrastructure and global business integration
Monaco represents concentrated financial power and luxury influence
The Caribbean offers strategic positioning in tourism, investment, and maritime economies
Together, these regions form a distributed but unified network. Their collaboration defines the speed, direction, and scale of global innovation.
Merit in the Age of Global Connectivity
One of the defining shifts of this era is the redefinition of opportunity. While structural barriers remain, access to global platforms, knowledge, and networks has expanded significantly.
However, access alone is no longer a differentiator. Execution is.
Success now requires:
Intellectual rigor
Strategic clarity
Adaptability in complex environments
Long-term discipline and resilience
Potential may be universal—but meaningful achievement remains highly selective.
Founder Spotlight: Aleksandra Sokolova and the First Royal Global Ecosystem
At the forefront of this transformation stands Aleksandra Sokolova, founder of the Royal Global Ecosystem—the first integrated global platform of its kind.
This ecosystem represents a pioneering model that unites diplomacy, global luxury, artificial intelligence, space innovation, and international collaboration within a single strategic framework. It is not a conceptual alignment, but a structured, operational system designed to function across sectors and borders simultaneously.
Within this ecosystem:
Diplomacy enables trust, access, and international partnerships
Artificial intelligence drives efficiency, scalability, and intelligent systems
Luxury defines experience, positioning, and global influence
Space innovation expands infrastructure, connectivity, and future opportunity
The Royal Global Ecosystem establishes a new category of global architecture—one in which industries no longer operate independently, but as interconnected components of a larger system.
Aleksandra Sokolova’s role reflects the emergence of a new class of leadership: system architects. These are individuals who do not simply operate within existing frameworks, but design entirely new ones.
Her work demonstrates a defining principle of the modern era: the future is not inherited—it is engineered.
Conclusion: The Age of Global System Architects
The world is entering an era defined by complexity, interdependence, and accelerated transformation. Linear strategies and isolated thinking are no longer sufficient.
What defines success now is the ability to:
Think systemically across industries
Operate globally across borders
Build integrated structures that connect people, technologies, and markets
The next chapter of global development will not be led by those who react to change—but by those who design the systems through which change occurs.
In the Global Innovation Era, the ultimate advantage belongs to the architects—those who see the entire system and possess the vision, discipline, and capability to build it.
April, 2026 – Without bold action, combined federal and provincial net debt is projected to approach 82 percent of GDP by 2028/29 – far above pre-pandemic levels. Canada is drifting toward a fiscal crisis. Yet policymakers, prone to fiscal gimmicks like the recent debt-financed fuel tax suspension, appear unwilling to act, according to a new C.D. Howe Institute report.
In “Fiscal Fantasy: Believe It or Not, Fiscal Reality Has Not Gone Away,” authors Don Drummond, William B.P. Robson, and Alexandre Laurin call for a decisive shift in the federal government’s spring fiscal update. They urge governments to move away from the current trajectory and toward balanced budgets, restrained spending, and tax reforms that encourage investment rather than burden future generations.
“Aggregating across nine provinces, projected total expenses for 2026/27 are $45 billion higher than in their 2024 budgets, with Quebec showing the smallest increase and Alberta and New Brunswick the largest,” says Don Drummond, Fellow-in-Residence at the C.D. Howe Institute. “We’re living in a fiscal fantasy. It’s time to come back to reality.”
The report notes that, with the economy operating close to capacity, ratios of government debt to GDP should be falling. It points out that slower population growth, declining immigration, weak productivity, and an ageing population will weigh on revenues and increase spending demands, and highlights worsening global conditions, including geopolitical tensions in the Middle East and Iran, which are raising inflation risks and increasing risk premiums on debt worldwide.
“Governments claim we have room for fiscal expansion because our debt burden is lower than that of many other countries, but we have huge unfunded liabilities, and high debt everywhere creates vulnerability for everyone,” says William B.P. Robson, Fellow-in-Residence and President Emeritus.
The authors also warn that younger Canadians will bear the burden of rising debt levels. Tax burdens are already high by both historical and international standards. They call for a more disciplined approach in the federal government’s spring fiscal update, including a realistic assessment of economic and fiscal conditions, a clear path to balanced budgets, firm spending restraint targets, and tax reforms that shift the burden away from income toward consumption while encouraging investment.
“These measures will likely face political resistance, but without bold action, we risk the prosperity and productivity of our nation for future generations,” says Alexandre Laurin, Vice-President and Director of Research at the C.D. Howe Institute.
Canada can no longer pride itself on its fiscal discipline. With the economy operating near capacity and growth in productive capacity weak, governments continue to run deficits and project rising debt ratios, undermining growth and living standards rather than supporting them.
Government projections understate the risks. Weak productivity, low business investment, and demographic pressures will hold back growth and revenues, while ageing, healthcare, and defence will push spending higher. Even modest changes in growth or interest rates could materially worsen the fiscal picture.
Restoring discipline will take a real change in direction. Governments must rein in spending, set a credible path to balance, and pursue reforms that boost investment and productivity, including shifting the tax mix away from income towards less distortionary taxes. The federal government must lead the way in its upcoming Spring Economic Update.
Introduction: Fiscal Fantasy and Fiscal Reality
Many Canadians may still have an image of Canada as a country aware that governments cannot spend and borrow without limit. They should not. The Globe and Mail columnist Gary Mason recently wrote about the “death of fiscal sanity in Canada” (Mason 2026). He pointed to the almost-doubling of the federal government’s net debt over the past decade, with the November 2025 budget projecting yet more, and budgets in British Columbia and Alberta that forecast relentless borrowing. He said we all know a crisis will hit but appear unwilling to act to prevent it.
Since Mason’s article, New Brunswick released a budget that shows a steep rise in its debt burden over the next four years. Quebec released a budget that showed a return to balance by 2029/30 – but that result, required by provincial law, depends on an unrealistically buoyant economy and major unidentified savings. Ontario released a budget that, notwithstanding its own inexplicably robust economic projections, features a higher debt ratio by the end of the decade. Prince Edward Island released a budget that prefigures a jump in its debt ratio. The federal government has also announced a fuel tax suspension – a multi-billion-dollar boondoggle that will add to its already excessive debt. All jurisdictions project deficits for 2025/26, with seven of them projecting deficits of at least 1.5 percent of GDP (Table 1).
At the same time, war in Iran and the broader Middle East is hurting prospects for world growth and raising inflation fears and debt risk premiums everywhere.
Many Canadians now seem to discount the fiscal constraints our federal and provincial governments had to confront in the 1990s. But, as science fiction novelist Philip K. Dick famously remarked, “Reality is that which, when you stop believing in it, doesn’t go away.”
Fiscal excess has already undermined economic growth and living standards. Without bold action to reduce the burden of public debt, government-fuelled consumption will continue to cut into the saving and investment needed to raise our incomes and purchasing power – and increase the risk of a borrowing crisis to boot. The federal government’s upcoming fiscal update needs to outline a change of direction – a profound and credible one.
Some Fiscal History
Canada has alternated between periods of fiscal discipline and fantasy. The immediate post-World War II period was disciplined. As military spending fell – from wartime peaks of four-fifths of all federal spending – the government ran substantial surpluses during the 1950s, and the war-swollen debt-to-GDP ratio plummeted.
The mood shifted in the late 1960s, ushering in a quarter-century of fiscal fantasy. The federal government’s budget deficits averaged 5.5 percent of GDP from 1975/76 to 1995/96, large enough to raise its net debt1 from less than one-fifth to two-thirds of GDP. Provinces and territories also increased borrowing, pushing their aggregate net debt to nearly one-third of GDP by the late 1990s. Combined federal and provincial net debt approached the size of the entire economy.
From 1961 to 1973, output per hour worked in the business sector roared ahead at an annual average pace of 3.5 percent. The rate then dropped: average growth was 1.8 percent from 1973 to 1981, 1.5 percent from 1981 to 1989, and 1.8 percent from 1989 to 2000.
In the 1970s and 1980s, fiscal policymakers did not – and arguably refused to – recognize the reality of slower productivity growth. Many attributed the economy’s disappointing performance to inadequate aggregate demand and argued that stimulative government spending financed by deficits was not a problem, since renewed growth would shrink the debt relative to the economy. Budgets in the 1980s typically projected growth in the economy and revenue that was too high and future debt burdens that were too low.
By the mid-1990s, however, reality bit. The relentless pressure of interest payments on annual budgets and evidence of dwindling appetite for Canadian sovereign debt from potential lenders forced a re-evaluation of the reality of fiscal policy. Provinces cut spending and borrowing, and so did the federal government. Budgets began to project surpluses, and the surpluses were achieved. Debt ratios and interest burdens fell, setting the stage for tax reforms into the 2000s.
The Current Need to Recognize Reality
Continuing Slow Growth of Productive Capacity
Today’s rhetoric echoes claims by finance ministers and other political leaders from the 1970s and 1980s that slow growth is cyclical rather than structural, and that a weak economy justifies spending and borrowing at levels that, if maintained, would be unsustainable. Meanwhile, rapid spending growth has become the norm. From 2018/19 to 2024/25, federal program spending rose 7.3 percent on an annual average basis.2 Program spending by all provincial and territorial governments rose at an average annual rate of 6.6 percent, with British Columbia at 8.7 percent – well ahead of population growth and inflation and far exceeding earlier budget projections.
Yet growth, undermined by low business investment and stagnating productivity, remains feeble. The Bank of Canada’s latest estimate of the “output gap” (the shortfall of aggregate demand against aggregate supply) is just 0.8 percent of GDP, and the unemployment rate is close to its longer-run historical average. Prospects for a resurgence in GDP and government revenue are poor. If the economy is operating close to capacity, budgets should be close to balance, and debt-to-GDP ratios should be falling.
The Burden of High Debt
But debt ratios are not falling. They are rising (Table 2). By 2028/29, the combined federal and provincial net-debt ratio will approach 82 percent – far higher than before the COVID-19 pandemic.
The 2025 federal budget projected that the ratio of federal debt3 to GDP would still exceed 37.2 percent in 30 years. This projection exemplifies current lack of concern about large debts and fantasy about addressing them. Even slight changes to the growth or interest rate assumptions over that timeframe would produce a rise.4 A recent sustainability analysis of combined federal, provincial, and territorial net debt shows a rising long-term baseline, with a 50 percent probability of a sharp increase once economic shocks and interest rate risks are taken into account (Lester and Laurin 2025). With war and interest rates rising because of inflation fears and higher borrowing to finance military expenditures, these shocks and risks are now closer to reality.
Fiscal Profligacy Elsewhere is Cold Comfort
The federal government has often argued that Canada can keep borrowing because its debt burden is lower than that of many other countries. This argument has many flaws.
International comparisons of gross debt are not nearly as favourable to Canada as they appear. Assets in the Canada and Quebec Pension Plans (CPP/QPP), which largely explain the gap between gross and net debt, are not available for any other purpose than to pay future CPP/QPP liabilities – liabilities that are not measured in the international comparisons. They are not assets of the Canadian or Quebec governments.
Being in better shape than fiscal basket cases around the world is very cold comfort. Even before the outbreak of war and the resulting rise in fuel prices and downgraded projections of growth and fiscal balances, concerns over debt burdens in Japan, the United States, and many European countries were already putting upward pressure on bond yields.
Fiscal balances can deteriorate fast, as Canada’s own history shows. Borrowers and credit rating agencies are as alert to economic and political risks as they have ever been.
Perhaps most conclusively, it is unconscionable to burden future generations for current consumption that they – living with an economy suffering from decades of deficient saving and private investment – will not enjoy.
We Need More Realism in Budgeting
Projections in 2026 budgets released so far show chronic deficits and rising debt for years (Table 3). Nova Scotia, New Brunswick, British Columbia, Alberta, and Prince Edward Island had small deficits or even surpluses into the 2020s, but now all project sharply higher debt burdens. Quebec’s projected decline rests on shaky numbers, and Ontario projects a higher one. If the definition of insanity is doing the same thing over again while expecting a different result, Gary Mason’s comment about the death of fiscal sanity is spot on. We are repeating the excesses of the 1980s and early 1990s, and we are suffering the consequences.
Table 4 compares projected total expenses for 2026/27 in 2026 budgets (and the federal government’s budget last fall) to projected expenses for that year in previous budgets. All show overshoots from previous projections. Quebec’s 3.1 percent overshoot is the smallest, while Alberta and New Brunswick’s overshoots exceed 10 percent. Across the nine provinces, projected 2026/27 expenses are $45.5 billion, or 7.1 percent, higher than they were in 2024. These overshoots reflect policy decisions: higher program spending and deficits that drive up interest payments.
What are the chances of lucky breaks – faster economic growth or other circumstances that would improve fiscal outcomes relative to projections?
Governments talk about their spending as “investment” that will boost growth. But the issue is whether the government or the private sector is better placed to make investments that will yield an economic return. When the economy is at capacity, higher government spending and borrowing reduce the resources available for private sector investment (Robson and Bafale 2025).
Demography will not help in the short run. Canada’s population declined in 2025, largely because of a sharp reduction in immigration. Lower immigration in the future, combined with a continuation of Canada’s slow pace of productivity growth, will hold back growth of GDP and government revenues. Population ageing will further lower revenue growth as a lower portion of the population will be of working age and paying full taxes.
Table 5 compares real GDP growth projections in the 2025 federal budget with supply-driven estimates based on new immigration targets and post-2000 trends of labour productivity and hours worked.
From 2030 to 2056, the 2025 Budget projects average annual growth of real GDP of 1.5 percent. Our supply-driven estimate is only 1.2 percent. By 2056, output is more than 10 percent lower under our scenario than in the Budget.
Looking back, budgets missed the productivity slowdown of the 1970s. They may now be missing a break to still lower growth. Output at the lower levels shown in Table 5 would raise the net debt-to-GDP ratio substantially and understate the amount of fiscal restraint required to restore fiscal stability.
Neither will demography help in the long run. The C.D. Howe Institute has analyzed in detail how population ageing will pressure public finances in Canada (Robson and Mahboubi 2024).
In addition to the downward pressure on the tax base mentioned above, it will push spending up. Federal spending on Old Age Security and the Guaranteed Income Supplement is presently 2.6 percent of GDP. By 2030, it will be around 3 percent (Canada 2023). Ageing is also adding about 1 percentage point annually to healthcare spending growth and will continue to strain the largest area of provincial spending.5 Over the next 50 years, provincial health spending could rise by 5 percentage points of GDP (Robson and Mahboubi 2024).
Last but certainly not least, satisfying Canada’s recent pledge to raise core defence spending to 3.5 percent of GDP will require increasing defence spending from around $35.4 billion in 2024/25 to $84.7 billion by 2029/30, and to $147.4 billion by 2034/35 (Busby and Dahir 2026).
Sensible Fiscal Policy
Stop Burdening Canadian Youth
Canada’s youth will struggle to cope with the high federal and provincial debt burdens being passed forward to them. They may face additional pressures from environmental stresses, geopolitical conflict, and technologically enabled crime and terrorism.
If productivity growth continues at its post-2000 pace, economic and wage growth will remain modest. Meanwhile, tax burdens are already quite high by historical standards.
Boost Economic Growth
Canada needs stronger productivity growth. A prime culprit in weak Canadian labour productivity is low business investment. Investment in machinery and equipment per worker is almost three times higher in the United States than in Canada (Robson and Bafale 2025). If firms did not invest when access to the US market was relatively open, something very enticing must be offered to encourage them to invest now that that access is in question. Fiscal policy needs to address this challenge.
Canada relies much more heavily on corporate and personal income taxes than most countries. Those taxes do much more economic harm than broad-based consumption taxes. Mintz et al. (2026) proposed a revenue-neutral “big bang” overhaul and simplification of Canada’s tax system that could raise Canada’s GDP by 2.5 percent over the long run.
The Federal Government Must Change Direction
The federal government’s upcoming Spring Economic Update must prefigure a change in direction: much lower spending in non-priority areas that ballooned over the past decade to make room for higher defence spending, while reducing borrowing and preparing the groundwork for lower income taxes. Specifically, it should:
Present a realistic baseline for economic and fiscal prospects, most likely showing weaker growth and higher deficits and debt than in the 2025 Budget.
Focus relentlessly on future challenges rather than self-congratulations over past actions.
Set a clear track toward budget balance over a politically relevant period – say, four years – with credible measures to achieve it.
Establish spending restraint targets based on mid-to-late 2010s levels, before spending growth exploded, rather than against future projections from today’s over-elevated base, supported by rigorous value-for-money reviews and independent oversight (Lester 2025).
Prepare for major tax reform that would incentivize investment, such as those in a recent C.D. Howe Institute paper outlining lower corporate income tax rates and base broadening, and deferral of taxation until profits are distributed (Mintz et al. 2026), while shifting the tax mix from income to consumption.
Time for Bold Action
The federal government must acknowledge that Canada’s twin economic crises – stagnant investment and productivity, and US trade aggression – require bold action, including measures that will meet some political resistance. It needs to build public support for lower spending, balancing budgets, and tax reform.
All Canadian governments need to more clearly communicate the country’s economic and fiscal challenges and engage taxpayers in a productive debate on course corrections. Canadians need to emerge from their fiscal fantasy and face reality.
The authors extend gratitude to Nicholas Dahir, Brian Ernewein, Yves Giroux, Jeremy Kronick, John Lester, Peter MacKenzie, and several anonymous referees for valuable comments and suggestions. The authors retain responsibility for any errors and the views expressed.
Canada. 2023. Actuarial Report (18th) on the Old Age Security Program as at 31 December 2021. Ottawa: Office of the Superintendent of Financial Institutions, Office of the Chief Actuary.
Canada. 2025. Budget 2025. Department of Finance Canada. November.
Mason, Gary. 2026. “The Death of Fiscal Sanity in Canada.” The Globe and Mail. March 3.
Mintz, Jack, Alexandre Laurin, and Nicholas Dahir. 2026. “Big Bang” Tax Reform: Unleashing Growth in the Canadian Economy. Commentary 707. Toronto: C.D. Howe Institute.
Sharpe, Andrew, and John Tsang. 2018. “The Stylized Facts about Slower Productivity Growth in Canada.” International Productivity Monitor 35 (Fall): 52–72. Centre for the Study of Living Standards.
LIFE Expands Emergency Relief Efforts as Displacement Nears One Million Amid Worsening Humanitarian Crisis
According to Lebanese statistics for this month, more than 2,167 people have been killed, including 178 children and 262 women, in addition to over 7,061 injured, among them more than 600 injured children and 1,000 women, reflecting a clear and significant increase in the number of civilian casualties.
This escalation has led to the displacement of more than 1.2 million people within Lebanon, including approximately 370,000 displaced children, representing nearly 20% of the country’s population. Families have fled southern regions and the southern suburbs of, Mount Lebanon, and northern Lebanon, creating enormous pressure on cities and areas considered relatively safer, such as Beirut, Sidon, and Tripoli.
Displacement Crisis in Lebanon Leaves Over a Million Without Shelters
Many displaced people are currently living in schools, shelters, and unprepared buildings amid a severe shortage of humanitarian assistance, while other families have taken refuge in improvised structures or even in vehicles due to the significant lack of available accommodation. Additionally, the most vulnerable groups, such as the elderly, people with disabilities, and refugees, face further difficulties in accessing shelter and assistance, in a context marked by attacks on civilian areas and residential homes, damage to infrastructure, and the shelling of ambulances and humanitarian aid facilities.
At the same time, the healthcare sector is under extreme pressure, with the risk that essential medicines and medical supplies—such as insulin, antibiotics, and surgical equipment—may soon run out due to the rising number of injured individuals and the growing demand for medical services. This is compounded by the shortage of fuel needed to operate electricity generators, a result of the chronic power crisis, which threatens hospitals’ ability to continue functioning, especially amid the severe shortage of life-saving medications.
The best meal Charity Initiative
On the living conditions front, the food crisis is worsening significantly, as hundreds of thousands of people face difficulties securing their basic needs due to rising prices, declining purchasing power, and the continued collapse of the local currency. Moreover, international aid has declined due to funding shortages, leading to increased poverty levels and food insecurity, along with water shortages and rising fuel prices, further intensifying the suffering of both residents and displaced populations.
Amid all these developments, the Lebanese economy continues to deteriorate, with rising unemployment rates and the suspension of numerous commercial and economic activities, pushing more families into poverty and increasing reliance on humanitarian aid. Meanwhile, international warnings are growing about the possibility of further deterioration in the coming months if military escalation continues and international support declines.
Life for Relief and Development has initiated an emergency response program in Lebanon, alongside its ongoing “Khair Wajbah” (Best Meal) campaign aimed at strengthening food security. The organization first began its humanitarian work in Lebanon in 2006, following the outbreak of war, when approximately a quarter of the population was displaced internally. During that period, and amid the widespread use of landmines and cluster munitions, Life concentrated its efforts on providing urgent relief and temporary shelter for affected families.
Education, Psychosocial Support, and Orphan Care
Samer Kassab, Coordinator of Life’s office in northern Lebanon, states:
“For emergency relief, Life distributed comprehensive food baskets—each containing around 20 kilograms of essential staples—to 525 families in southern Lebanon (Tyre), including displaced households in Palestinian camps, as well as another 525 families in Tripoli and Akkar. The team also organized a collective iftar for 200 families and delivered hot meals to 400 displaced households.
At the end of Ramadan and during Eid, the ‘Khair Wajbah’ initiative provided meals to 1,222 families across northern Lebanon. In parallel, Life organized an orphan-focused event where monthly financial support and Eid clothing were distributed, along with meals, gifts, sweets, and toys, contributing to both material relief and psychological well-being for children and their families.
Seasonal assistance programs were also implemented, including the distribution of winter clothing and essential supplies to vulnerable camp residents to ensure protection during harsh weather conditions.”
In addition, the organization has supported Lebanon’s education sector by facilitating the return of primary and middle school students to classrooms, rehabilitating damaged schools, and offering scholarships for university students—helping invest in long-term educational development for future generations.
Integrated Support for Vulnerable Populations
Engineer Mohammed Al-Sharif, Coordinator of Life’s Lebanon office, outlines recent humanitarian conditions:
“Our programs currently reach more than 103,000 displaced individuals across the country, 70% of whom are women and children. Over half of children under two years old are experiencing severe food deprivation, while nearly 80% of families require urgent humanitarian assistance.”
Approximately 1.17 million people are facing acute food insecurity, including 55,000 in emergency-level conditions. Camps and shelters continue to suffer from shortages of clean water, adequate nutrition, and sanitation services, significantly increasing the risk of disease outbreaks. The situation has further deteriorated due to expired medications, ongoing power outages, and fuel shortages.
Over the past three years, Life has strengthened its healthcare response by supplying hospitals with medicines, medical equipment, ambulances, and emergency relief materials, while also implementing sustained programs for displaced communities and refugees. Special attention has also been directed toward elderly individuals and people with disabilities.
Strengthening the Health Sector: A Core Priority
He further adds:
“As part of this month’s emergency response, Life has assisted 2,400 families by distributing ready-to-eat food packages, hot meals, emergency shelter kits (including mattresses and blankets), multipurpose cash assistance, hygiene kits, dignity kits for women, and essential supplies for children such as milk and diapers. Access to mobile medical services has also been ensured.”
Over the past year, Life has provided comprehensive medical support to six major hospitals across Lebanon, supplying essential medications, medical equipment, operating room tools, and emergency response materials.
The organization has also delivered medical equipment to L’Ecoute NGO in the southern suburbs of Beirut, which serves people with disabilities, and to Arcenciel in Beirut, supporting marginalized communities. Additional equipment was supplied to medical laboratories and to the Asile Maronite des Vieillards center in Mount Lebanon.”
New Report Charts Key Strategies and Trade-Offs for Long-Term Growth The World Economic Forum report outlines key “no-regret” strategies and unresolved dilemmas shaping economic growth in the long-term.
The new economy will be shaped by accelerating AI adoption, geostrategic competition, high public and private debt, and environmental and demographic challenges. Energy costs and political instability currently prevent accelerating growth, while the expansion of IT services, advanced manufacturing, health and leisure will drive output in the future. Read more about the Future of Growth Initiative.
Geneva, Switzerland, April 2026 – As the growth strategies that powered the global economy over the past three decades lose relevance, a new World Economic Forum report calls for a renewed blueprint to navigate a rapidly evolving landscape shaped by AI, geostrategic competition, rising debt and inequality, and mounting environmental and demographic pressures. The report draws on two years of dialogue with nearly 200 global business leaders, policy-makers and experts, and a survey of more than 11,000 executives worldwide.
Four Areas Of Economic Policy
Across four major areas of economic policy, Growth in the New Economy: Towards a Blueprint identifies key “no-regret” strategies and open dilemmas for governments and businesses that will define economic policy in the coming decade:
Technology, productivity and human capital: Sustained growth in the new economy will depend on strengthening productivity and human capital as technology and knowledge become central to value creation. Governments and businesses must navigate between different approaches to translating innovation into new sources of growth and ensuring its benefits are widely shared, pursuing coordinated or competition-led approaches to harness technology and prioritize redistribution or mobility-based strategies for economic inclusion.
Global cooperation and domestic capacity: Leveraging comparative advantage and diversification remain “no-regret” strategies that may enable expansion of economic opportunity and resilience. Yet, governments and businesses will need to balance global engagement with stronger domestic capacity, navigating between self-reliance and global integration strategies.
Business environment and the role of government: In the new economy, reinforcing the fundamentals of economic policy – including credible institutions, high-quality infrastructure and macroeconomic stability – and strengthening multistakeholder alignment continue to be winning strategies. The role of government in economic transformation can range from minimal to more expansive, while policy-makers face hard choices to manage debt levels, shifting between greater fiscal prudence and forms of financial repression.
Sustainability and economic policy: Focusing on the economic and societal benefits of green transition strategies is essential to unlocking long-term prosperity and resilience. Critical dilemmas around how to manage the costs and trade-offs of greener growth persist, with decision-makers navigating a range of investment-led and cost-led strategies.”
The current context demands bold choices and trade-offs from government and businesses. Investing in productivity, talent and reinforcing the fundamentals of economic policy are clear winning strategies that hold across every country and income level,” said Attilio Di Battista, Head of Economic Growth and Transformation, World Economic Forum. “Yet, leaders will need to navigate complex dilemmas while managing record levels of debt and inequalities, rising geostrategic competition, a persisting climate crisis and the fastest technological shift in a generation.”
Shifting engines of global growth
Amid disruptions brought by the current conflict in the Middle East, the report points to long-term shifts in the composition and drivers of economic growth. Middle-income economies are expected to account for nearly two-thirds of global GDP growth through 2030. Regionally, Asia will continue to be the main driver of growth, accounting for more than 50% of global growth. Despite registering the fastest growth rates, low-income economies are projected to contribute just 1% of global growth over the same period.
Information technology services, advanced manufacturing, health and healthcare, and accommodation and leisure sectors are expected to drive growth over the next five years, with Asia, Europe and North America as key hotspots. Latin America and the Caribbean will see opportunities in the agriculture, mining and metals sectors.
Opportunities and challenges
Based on the results of the recent survey of 11,000 business leaders, the report highlights high energy costs and policy instability as the two barriers that are constraining an acceleration of economic growth across various geographies and income levels.
Other barriers vary by country income level. In high-income economies, skill shortages and rigid regulations are seen as the top barriers, while in low-income economies, limited access to finance and inadequate infrastructure were top concerns.
In the long-term, frontier technologies and the green and energy transition are identified as trends that will drive growth and investment, while high debt, societal polarization and climate change are seen as potential headwinds across regions and income levels.
Demographic shifts and geoeconomic fragmentation are expected to create divergent growth trajectories, with ageing populations slowing growth in Eastern Asia and Europe, and younger populations supporting growth in the Middle East and North Africa, and Sub-Saharan Africa. Geoeconomic fragmentation is seen as a drag on growth in most countries, though executives expect South-East Asia to benefit from shifting supply chains and trade patterns.
In addition, domestic corporate investment and foreign demand are seen as the main drivers of growth over the next five years. Domestic investment is especially important in low- and middle-income economies, while advanced economies look to foreign markets. Domestic consumption and public spending are expected to play a smaller role due to high public debt and stagnant real incomes.
About Growth in the New Economy: Towards a Blueprint The report draws on two years of dialogues held as part of the World Economic Forum’s Future of Growth Initiative, with policy-makers, business leaders and economists convening in Davos-Klosters, Dubai, New York, Riyadh, Tianjin and Washington DC between 2024 and 2026, and integrates inputs from the Global Future Councils on the Future of Growth and the Business of Economic Growth. It also consolidates insights from more than 11,000 business leaders in 118 countries participating in the World Economic Forum Executive Opinion Survey 2025. Read the full report here.
Throughout 2026, the Future of Growth Dialogue Series will continue exploring the emerging frontiers of the new economy, as well as new sources and pathways to growth, productivity and innovation. The Future of Growth Initiative is complemented by the World Economic Forum’s Scenarios for the Global Economy Dialogue Series, leveraging foresight to explore scenarios for the future of growth and their implications for strategy, investment decisions and resilience across industries.
New Analysis Identifies 50+ Investible Opportunities Delivering Financial Returns
More than 50 investible opportunities, across 13 sectors, that are already generating revenue or cost savings for industry and investors have been identified by new World Economic Forum research.
Though more than half of global GDP is highly or moderately dependent on nature, capital continues to flow disproportionately towards nature-negative activities, leading to potential systemic risks and undervalued business opportunities.
From precision agriculture and sustainable cement to battery recycling and industrial water management, growing numbers of investment opportunities can both protect nature and deliver returns for investors.
Geneva, Switzerland, March 2026 – More than 50 investible opportunities could turn capital flows into lucrative nature-positive business practices and contribute up to $10.1 trillion in annual business revenues and cost savings by 2030, according to a new World Economic Forum report just launched.
The report, 50 Investible Opportunities for a New Nature Economy, developed in collaboration with Oliver Wyman, also highlights how nature risk and capital flow misalignment represents a growing systemic economic risk and a significant missed commercial opportunity for business.
This comes at a time when global capital flows remain deeply misaligned. According to the United National Environment Programme (UNEP), an estimated $7.3 trillion continues to be invested annually in activities that degrade ecosystems, compared to roughly $220 billion invested in nature-based solutions. The report’s 50 investible opportunities offer revenue-generating and cost-saving approaches to close this gap.
Who Is Falling Behind?
Similar to the Paris Agreement for climate targets, the international community is falling behind on biodiversity targets. Renewed action and novel strategies are needed to meet goals of halting and reversing nature loss by 2030.
“We need to transition towards an economic system that delivers prosperity within planetary boundaries,” said Sebastian Buckup, Managing Director, World Economic Forum. “Industries, including the financial sector, will pursue this not just as an act of corporate social responsibility or impact investing but because it makes good business sense to do so.”
As companies face increasing exposure to water scarcity, soil degradation, pollution and tightening environmental regulation, nature-related risks are no longer abstract sustainability concerns but material financial issues affecting long-term profitability.
Drawing on analysis of approximately 250 business activities, the report identifies 50+ investment-ready opportunities across 13 high-impact sectors to support halting and reversing nature loss by 2030. From precision agriculture and sustainable concrete to battery recycling and industrial water management, these solutions reduce pressure on land, water and resources while generating revenue growth, cost savings and risk mitigation.
Case Study: Sustainable Cement and Concrete Blends
For example, the report looks at sustainable concrete blends as an investible opportunity. These blends reduce reliance on newly quarried raw materials by substituting a portion with recycled industrial byproducts or recovered construction materials. They provide similar structural performance to traditional concrete while helping companies meet regulatory standards and growing market demand for low-impact building solutions.
These blends also have an array of nature benefits, including reducing new quarrying, lowering pollution and reducing the energy intensity needed for new concrete.
While these products are commercially viable today and can often be integrated into existing production facilities with moderate capital investment, many sustainable blends retail at a higher price than conventional concrete, as the latter benefits from established logistics, economies of scale and similar factors that lower costs. As economies of scale are built and business models are derisked, sustainable concrete offers an opportunity for investors to put capital towards a business-ready, nature-positive solution that can generate returns.
“At its core, this is a capital allocation challenge,” said Derek Baraldi, Head of Sustainable Finance, World Economic Forum. “Financial institutions and businesses that integrate nature into strategy today are not just managing risk but positioning themselves for competitive advantage.”
The Role of Capital and Financial Institutions
Financial institutions can help scale these solutions by providing the capital companies need to invest in new production processes and facilities. They can also reduce risk through tools such as sustainability-linked loans, guarantees or blended financing, helping innovative materials reach the market faster.
To support financial institutions looking to invest in nature-positive solutions, the report outlines five priority actions for financial institutions to mobilize capital into nature-positive opportunities. By strengthening internal “nature fluency”, innovating financial products, building coalitions, improving data use and leveraging nature transition conversations to surface investible opportunities, financiers can build a robust pipeline of nature-positive opportunities to deliver both mainstream and sustainable finance.
Business depends on reliable water supplies, fertile soils, biomass and ecosystem services such as pollination and flood protection. Industry successes are already delivering value while supporting nature-positive goals, such as industrial water management to tackle water shortages and precision agriculture techniques that save farmers input costs while reducing fertilizer run-off into waterways. Realigning capital flows with nature-positive investments that protect biodiversity and offer financial returns is essential to safeguarding the natural systems which underpin the global economy.
More about Nature-Positive Transitions
The World Economic Forum’s Nature-Positive Transitions report series explores transformative pathways to halt and reverse nature loss by 2030. Focusing on critical sectors, the series highlights the dual impacts and dependencies of these industries on nature, alongside the priority actions businesses can take to avoid and reduce negative impacts, mitigate nature-related risks, build resilience and unlock opportunities across value chains. Nine sectors have been involved: technology, automotive, cement and concrete, chemicals, household and personal care products, mining and metals, ports and offshore wind.
The World Economic Forum provides a global, impartial, not-for-profit platform and insights to support meaningful connections between political, business, academic, civil society and other leaders. (www.weforum.org).
Retirement is exciting to think about. After decades of work, the idea of having more control over your time… that’s something people look forward to, right? Many spend their working lives waiting until the day they retire – so if that’s you, you aren’t alone.
No matter how you imagine spending your retirement – traveling, spending more time with your family, or just enjoying a slower pace of life – it is a rewarding stage of life. But before you take the leap, there are a few important things worth putting in place.
A little bit of preparation now makes the years ahead much less stressful.
Create a Retirement Budget
You’ll have spent years earning a salary. One of the biggest changes you’ll go through after retiring is relying on savings and retirement income. Because of this, you must have a clear picture of your finances. That’s essential.
Even more so as Canadians now believe they require $1.7 million to retire. This is an increase from $1.54 million in 2025. So yes, having a budget is a must.
Begin with an estimate of what your monthly income will be. This might include pensions, investment income, retirement savings, or government benefits. Once you know what is coming in on a monthly basis, take a look at what typically goes out.
Many expenses will stay the same. Living expenses – groceries, mortgage or rent, utilities, and the like – don’t disappear when you stop working. At the same time, retirement also brings new spending. You might be one of the many retirees who travel more, take up new hobbies, or spend more time dining out.
Put everything on paper. This helps you understand whether your income comfortably supports your lifestyle. It’ll be easier to make adjustments before you retire if you notice a gap.
Some people do find it helpful to speak with financial professionals who focus primarily on retirement planning. Firms – like Aleph Retirement Planners – work with individuals who want a long-term plan. Such forward planning helps manage income and expenses after leaving the workforce.
Plan for Long-Term Care
Another important part of retirement planning? Health. Most people hope to stay active and independent as they age, but it’s wise to consider what might happen if extra care is needed.
You might think it silly to consider this now. It isn’t. You need to be prepared, especially when there are numerous options. Long-term care takes different forms. Some people need occasional help at home, while others may eventually require assisted living. Depending on where you live, these services could be costly.
Think about these possibilities early. This gives you more options. You might explore long-term care insurance. Others might choose to set aside a portion of their savings specifically for future care needs.
Speak with family members, too. Discuss their preferences, if they have any. Sure, these conversations likely won’t be easy, but they do prevent confusion later on. Your wishes will be understood and followed.
Update Your Will and Power of Attorney
Retirement is a good time to review legal documents as well. There’s a chance your circumstances will have changed since you first created a will, particularly if you made it many years ago.
Maybe you’ve welcomed grandchildren. Perhaps you’ve purchased property. You might have experienced another major life change. Updating your will ensures your assets are distributed the way you intend.
Equally important is a power of attorney. This document allows someone you trust to handle financial or medical decisions on your behalf if you’re unable to do so. Again, you might not think this is necessary – but it might be. Without it, loved ones may need to go through complex legal processes just to step in and help you.
Review these documents periodically. Doing so keeps everything up to date and avoids unnecessary problems later.
To conclude, retirement is a life transition. A major one. It doesn’t need to overwhelm you, though. If you want to approach this next chapter with confidence, then you need to consider the above steps. This way, retirement becomes a time to enjoy everything you’ve worked hard for.
Post-Ceasefire, Gaza Families Face Prolonged Hardship as LIFE Continues Delivering Life-Saving Humanitarian Aid
Despite the perception that ceasefires offer meaningful relief, conditions on the ground in Gaza demonstrate that humanitarian emergencies do not end when active conflict pauses. For civilians, the period following a ceasefire is often marked by continued displacement, damaged infrastructure, shortages of food and clean water, and limited access to essential services.
Life for Relief and Development (LIFE), a global humanitarian organization, has maintained an active presence throughout these periods, remaining one of the few international NGOs authorized to deliver aid inside Gaza. LIFE continues to respond to urgent, life-saving needs while navigating significant challenges.
Ceasefires Without Recovery
While ceasefires may reduce immediate violence, they do not restore stability. Families in Gaza frequently return to homes that are damaged or destroyed, seek refuge in overcrowded shelters, or reside in temporary tents without adequate protection. Water networks remain compromised, food availability is inconsistent, fuel shortages persist, and access restrictions continue to impede the flow of humanitarian aid.
Field reports from LIFE-supported operations indicate that displacement remains widespread, with families moving repeatedly in search of safety, food, and water. Even during ceasefires, civilians continue to face severe challenges, including:
Limited access to clean drinking water due to damaged infrastructure
Inconsistent food supplies and a lack of functional cooking facilities
Exposure to harsh weather conditions in makeshift shelters
Elevated public health risks stemming from overcrowding and poor sanitation
These conditions underscore the reality that a ceasefire does not equate to recovery or safety.
LIFE’s Ongoing Humanitarian Response in Gaza
Despite restricted access and operational risks, LIFE has sustained a multi-sector humanitarian response aimed at meeting immediate survival needs and preserving human dignity. Through coordinated interventions across North, Central, and South Gaza, LIFE-supported programs have provided:
Emergency food assistance through hot meals, family food packs, and large-scale food convoys
Clean drinking water via tanker deliveries and the rehabilitation of damaged municipal water wells
Emergency shelter materials, including tents and weather-resistant covers for displaced families
Winter relief, such as warm clothing and footwear for children and vulnerable individuals
Infant nutrition support to address critical shortages for families with young children
These interventions have reached hundreds of thousands of individuals across multiple phases of emergency response, including periods identified as ceasefires—during which needs remained acute.
Operating Under Constant Constraint
Providing aid in Gaza requires continuous adaptation. LIFE-supported teams have had to navigate border delays, limited fuel supplies, communication disruptions, and security-related restrictions. Daily adjustments ensure that relief reaches the most vulnerable populations, including displaced families, children, older adults, and households with no access to essential services.
By maintaining operations both during and after ceasefires, LIFE helps bridge the gap between temporary pauses in hostilities and the ongoing humanitarian needs that continue long after media attention subsides.
One beneficiary, Neama, a 38-year-old mother of four who has been displaced multiple times, described the uncertainty that continued beyond the ceasefire. Her family faced overcrowded shelters, a lack of cooking facilities, and severe food scarcity. Through LIFE-supported hot meal distributions, her family received freshly prepared meals over several days.
“The hot food meant more than nutrition,” she shared. “It restored dignity and gave my children a sense of normal life again, even in the middle of everything.”
Humanitarian Needs Beyond the Headlines
A ceasefire does not end the humanitarian crisis for families in Gaza. Many continue to face shortages of food, water, shelter, and basic services, with recovery dependent on sustained humanitarian support rather than temporary pauses in conflict.
“A ceasefire may pause active fighting, but it does not pause human need,” said Dr. Hany Saqr, CEO of Life for Relief and Development (LIFE). “Families in Gaza continue to experience daily challenges accessing food, water, shelter, and essential services. Our responsibility as a humanitarian organization is to remain present, impartial, and responsive, ensuring that assistance reaches civilians when they need it most, regardless of circumstances.”
For the Silo, Tasneem Elridi.
About Life for Relief and Development (LIFE)
Life for Relief and Development, headquartered in Southfield, Michigan, is a global humanitarian relief and development organization committed to assisting individuals regardless of race, gender, religion, or cultural background. LIFE is a registered 501(c)(3) nonprofit organization and holds Consultative Status with the United Nations Economic and Social Council (ECOSOC).
The landscape of North American wealth is on the brink of a historic shift. Current research estimates that between $75 trillion usd and $125 trillion usd ($102.5 trillion cad and $170.8 trillion cad) will change hands over the next two decades in American alone as assets pass from the baby boomer generation to younger heirs. This unprecedented movement of capital, now widely referred to as the Great Wealth Transfer, is set to redefine family finances, generational relationships, and the future of estate planning across North America.
While the transfer represents an extraordinary opportunity for Millennials and Gen Xers, it also carries significant legal and emotional risks. Attorney Don Ford, a Board-Certified expert in Estate Planning and Probate Law with Ford + Bergner LLP, warns that without thoughtful preparation, the same wealth intended to provide security can just as easily fracture families and ignite costly disputes.
A Scale Never Seen Before
“The scale of this transfer is unlike anything we have seen before,” explains Ford, Managing Partner at Ford + Bergner LLP—a Texas-based boutique firm specializing in estate planning, probate, and guardianship. “And when large sums of money move quickly through families that are unprepared, conflict becomes far more likely.”
Why This Is Happening Now
Several forces have converged to accelerate this moment.
Americans are living longer, allowing assets to compound over extended periods. Many individuals entering their later years benefited from decades of sustained market growth, dramatically increasing the value of retirement accounts, real estate holdings, and privately owned businesses. Together, longevity and market performance have produced estates that are often far larger and more complex than families anticipate.
Yet wealth has grown faster than planning.
“Many estate plans are static while wealth is dynamic,” Ford notes. “People create documents years earlier and assume they will still work, even though their family structure, asset values, and risks have changed.”
Why Planning Is an Act of Care
Estate planning is often misunderstood as a tax exercise or paperwork requirement. In reality, it functions as a roadmap that protects families, preserves intent, and prevents conflict.
Effective planning allows families to address challenges before they escalate. Trust structures can provide what Ford describes as “training wheels” for heirs who are not yet equipped to manage significant portfolios. Clear language can reduce ambiguity in blended families, ensuring spouses and children from prior marriages are treated according to the individual’s wishes rather than default statutes.
Business continuity is another frequent flashpoint. Without an agreed-upon succession plan, profitable family enterprises can be forced into liquidation simply because heirs cannot agree on control or direction.
“Planning is not about control from the grave,” Ford says. “It is about clarity while you are still here.”
The Rising Tide of Probate Litigation
As wealth transfers accelerate, probate courts in America are bracing for an increase in estate-related litigation and similar situations are set to occur in Canada and Mexico. According to Ford, several recurring issues are already driving disputes.
Cognitive decline and undue influence are among the most common triggers. As older adults reach their eighties and nineties, dementia and other impairments become more prevalent. Late-life changes to wills or trusts are frequently challenged by heirs who believe a loved one was pressured or lacked capacity.
Blended family dynamics also play a major role. Modern families often include second marriages, stepchildren, and competing expectations. When individuals die without updated documents, intestacy laws can produce outcomes no one intended, fueling resentment and lawsuits.
Ambiguous or outdated estate plans remain another risk factor. DIY documents and boilerplate language often fail under scrutiny, leaving courts to interpret vague instructions. Fiduciary disputes are equally common when executors or trustees are accused of mismanagement, lack of transparency, or favoritism.
Family-owned businesses present some of the most complex conflicts. When multiple heirs disagree over leadership, equity, or control, litigation can become the only path forward, sometimes ending in forced sale.
“The tragedy is that most of these disputes are preventable,” Ford emphasizes. “They arise not from greed, but from silence, assumptions, and documents that were never meant to handle modern family realities.”
The Bottom Line
The Great Wealth Transfer is not merely a financial event. It is a social and legal reckoning that will test families’ communication, planning, and preparedness. As trillions of dollars move between generations, proactive estate planning has become less about wealth preservation and more about relationship preservation.
For families willing to plan with intention, the transfer can strengthen legacies rather than divide them. For those who do not, the cost may be far higher than they ever expected.
As the blessed month of Ramadan approaches—bringing with it the values of mercy and solidarity—this year arrives amid a profoundly harsh humanitarian reality across vast regions of the Arab world.
Among the scattered tents of displacement that have become refuge for the uprooted, and in homes reduced to rubble—leaving behind only ruins, grief, and the names of the missing—some fasting individuals will observe Ramadan at meager tables, continuing their daily struggle to secure the simplest iftar meal after long hours of fasting. Others will fast without knowing how they will obtain their next meal.
Millions of Meals and Thousands of Beneficiaries
Humanitarian initiatives multiply each year, yet their impact varies. Some alleviate hardship, while others fall short of addressing the depth and complexity of ongoing crises.
For 33 years, LIFE for Relief and Development has mobilized its efforts to fulfill its humanitarian mission during the holy month of Ramadan by implementing relief programs focused on meeting the basic needs of the poorest and most vulnerable families. Through the distribution of food parcels and the organization of communal and individual iftar meals, LIFE’s assistance reaches hundreds of thousands of families in need worldwide.
LIFE teams were present in 37 of the 60 countries where the organization operates sustainable development and relief projects. During Ramadan 2025, nearly 6 million meals were distributed through 16,000 nutritionally balanced food baskets. Additionally, 51,000 freshly prepared hot meals were provided, benefiting approximately 97,000 fasting individuals in need.
Gaza: A Communal Iftar Amid the Rubble
Gaza stood at the forefront of LIFE’s efforts. Amid the devastating landscape and the remnants of war, displaced families recall memories of past Ramadans—when loved ones gathered around one table and smiles preceded the meal. Though those scenes now seem distant, LIFE continues to revive the spirit of solidarity, instilling a glimmer of mercy and hope in hearts exhausted by crisis.
LIFE worked to provide food security for 2,883 families—sufficient to sustain them for three months—alongside organizing communal iftar gatherings open to anyone in need. Despite being held atop the rubble, these gatherings brought moments of joy to attendees.
In addition, Eid celebrations were organized for orphans, benefiting 7,660 orphaned families, including 1,200 families at a special Gaza orphan event. Iftar and suhoor meals were also distributed at Al-Aqsa Mosque.
Confronting Famine in Sudan
From Sudan, we spoke with Ms. Rima Bakir, LIFE’s Projects Coordinator in Sudan, who described the scale of suffering:
“Ramadan will arrive for many children in Sudan not with joy, but with hunger and deprivation. They will welcome the month with empty stomachs, fear, exhaustion, and severe food shortages.
Pregnant and nursing women suffer from malnutrition and increasing health risks, while widows bear a doubled burden in securing food for their children after losing the family breadwinner amid rising living costs. They are living through daily hardship and a continuous struggle for survival.
Over the past year, we tracked displaced families in Kassala, where we provided suhoor and iftar meals to 845 families affected by the war. We also distributed nutritionally integrated food baskets weighing approximately 30 kilograms to support children’s healthy growth, in addition to providing clothing for orphans.”
Targeting the Poorest and Most Remote Communities
Regarding this year’s anticipated activities, Omar Mamdouh, Director of Projects, stated:
“We will intensify our teams’ efforts in the poorest areas facing potential famine, according to United Nations reports. We plan to support vulnerable families and displaced populations in crisis zones by strengthening social solidarity and spreading joy through food assistance projects, organizing iftar gatherings, and distributing hot meals and food baskets in remote areas often beyond the reach of charitable organizations.
Before Eid, we will also implement orphan sponsorship initiatives by providing Eid clothing, gifts, and financial and food assistance. We will distribute zakat and charitable donations to the most deserving beneficiaries, in addition to facilitating fidya and kaffarah contributions.”
Ranked Third Among the Best Organizations Fighting Poverty and Hunger
Vicky Robb, Director of International Programs, added:
“We will expand our food assistance projects in developing countries, particularly in displacement camps where children are suffering—such as those along the Pakistan-Afghanistan border, in war-affected regions of Sudan and parts of Africa, and in countries facing silent poverty in Southeast Asia.
LIFE distinguishes itself by strategically targeting areas inaccessible to most relief organizations—whether due to the severity of war, as currently in Gaza, Sudan, and Lebanon. Our teams have delivered Ramadan meals and food baskets on foot. In Bangladesh, they navigated deadly floods by boat to reach the hungry. In Afghanistan, despite mud and extremely difficult terrain, food was transported on horseback. In Tanzania, our teams left their own families for days to reach remote communities where hunger persists and infants cry silently from malnutrition. They relied on multiple forms of transportation to ensure aid reached beneficiaries before the start of the holy month.”
Moral Hazard – A situation where one party assumes greater risk because it understands that another will remedy the harmful effects.
While the hundreds of billions of dollars in U.S. foreign assistance spent over the years have dramatically improved many people’s lives and livelihoods around the world, too often the United States’ approach to foreign assistance failed to advance U.S. interests, failed to spur systematic development, and enabled and perpetuated dependence and corruption by leaders in recipient countries. Since 1991, the United States has provided more than $200 billion in foreign assistance to Africa, yet the African Union reports that African countries lose an estimated $88 billion each year through tax evasion, money laundering, and corruption. Too often, what is needed for economic growth and development is not more money, but sound reforms that incentivize enduring private investment and growth.
Instead of insisting on mutual accountability to use U.S. assistance to address the causes of poverty and underdevelopment, too often we funded outputs to allay the symptoms. In so doing, we failed both the American taxpayer and the citizens of developing countries who looked to their governments and ours to help create the conditions to realize a better future.
For decades, the United States did not have a consistent policy as to even whether assistance was charity or a foreign policy tool. We did not require a committed partner, a coherent business plan, equity collateral at risk, or funding subject to performance-based disbursements. We infantilized recipient governments instead of having candid discussions on mutual performance expectations. Too often our approach to developing countries – frequently perpetuated by the excuses of those same governments – reflected the soft bigotry of low expectations. We excused away the lack of political will as “capacity constraints,” dismissed it with “we shouldn’t expect too much,” and did not challenge them when governments acted in contrast to their professed commitments.
Too often, we were content to confuse governments’ commitments for actions. We misinterpreted our access to leaders as influence with those leaders. We mischaracterized aid projects’ outputs as outcomes and program objectives as results. We misconstrued governments’ permission for us to expend aid as evidence that they shared a commitment to advance professed objectives. Perhaps worst, we failed to acknowledge when leaders of aid recipient countries demonstrated over and over through their actions that they prioritized their personal interests over, and at the expense of, the interests of their own country and citizens. Virtually never did we withhold assistance funds because host governments failed to deliver on their commitments, instead we responded by providing even more aid “because they have needs.” By trying to save people from bearing the brunt of the bad governance and corruption of their leaders, we helped perpetuate that very same corruption and bad governance.
Quite simply, we violated the central maxim of international development: the donor cannot want development more than the recipient. By doing so, we fueled moral hazard. From the pure greed of Malawi’s “Cashgate” scandal under Joyce Banda to the systematic kleptocracies of Bangladesh or South Sudan, by back filling health and social service needs recklessly created by bad governance, we have enabled and underwritten government corruption. In the worst cases, such as the predatory abuses of Mali’s Ibrahim Keita or Guinea’s Alpha Conde against their own populations, corruption and the failure to deliver basic public services needs led to military coups and incursions by terrorist organizations.
American foreign assistance is not charity but a tool to advance American diplomacy, security, and prosperity.
To accomplish these goals, we must focus our assistance and insist on administering it with host-government buy-in and mutual accountability for outcomes. This, in turn, will leave space for market driven growth that will also help close off the means by which malign international actors exploit developing economies and workers. We should not be dissuaded by detractors who will attempt to vilify a more transactional approach as “neocolonialism.” Quite the opposite is true. By insisting on systematic reforms that spur transparent and accountable growth and allow governments to retain funds to support their people, the United States can do more to catalyze actual economic development and the upliftment of developing countries’ societies – and advance tangible U.S. interests – better than we have in recent decades. It is the dependency-oriented, NGO-driven old model of development that is fundamentally colonial in mindset – refusing to respect development nation sovereignty, determinism, or agency.
Operationalizing this approach involves adopting investment-oriented goals, requirements, and incentives:
A Serious Host Nation: Secretary Rubio has been clear, “Americans should not fund failed governments in faraway lands…we will favor those nations that have demonstrated both the ability and the willingness to help themselves.” If a government is not already taking steps to stem corruption and grow the economy when its own funds are at stake, we should have no expectation that they will be better stewards of U.S. funds. Without an aligned host-government, we should focus our resources elsewhere.
The Right Focus: Our purpose is not to give money away, but to catalyze systemic reforms that enable sustainable growth and opportunities for the U.S. and recipient country. Neither governments nor donors create growth; instead, our roles are to foster conditions for the private sector to invest, create jobs, spur growth, and pay taxes to fund public services. Hence, U.S. foreign assistance should focus on curbing corruption and overcoming and remediating binding constraints to growth to lay the foundation for a transparent, level, and accountable business enabling environment.
Confidence in The Business Plan: Most developing countries have national development plans, but too often they are unresourced and unprioritized works of fantasy, and seldom do governments enforce accountability for their actual implementation. What President Trump explained in clearly delineating America’s national interests in this year’s National Security Strategy is equally true of developing countries: when everything is supposedly a priority, nothing really can be. We should help sincere host governments develop focused, realistic strategies based on core sectors and targeting key constraints that are founded on candid analysis and include specific, tailored tactics.
Skin in the Game: If a country is not going to put its own resources behind an effort, it is either not really a priority, they are not really serious, or they don’t have confidence in their plan. Few investors would engage where the owner hasn’t put collateral down or his own equity at risk. Why should foreign assistance not require the same? Here, the Millennium Challenge Corporation (MCC) has demonstrated two key best practices that ensure buy-in. The first is a requirement for co-financing by the host government. The second is conditions precedent: tangible reform actions a host government takes before funding even begins, to enable the success of the project outcomes.
The Right Resources: Again, our purpose is not to give assistance away, and the history of both corruption and assistance has shown that money is not what is most lacking to spur development. So, building on an analysis of binding constraints to growth and a business plan that we have confidence in, it is incumbent on the United States and the recipient government to craft a bespoke package of technical assistance interventions to inform and enable the reforms needed. This should not be an approach of letting a thousand flowers bloom, and it must not be built around the question of “how can we help?” Instead, we must start with the questions “what are the outcomes we want to achieve in the American interest and what needs to happen to realize them?” and build an assistance program around that.
Have a Contract: Unlike the Development Objective Agreements (DOAGs) of USAID that bound the U.S. to fund sectors but seldom included host governments’ performance commitments, the MCC model again provides a best practice. Explicitly detailing shared objectives and commitments by both governments – typically ratified by the legislature to carry the force of law – reduces uncertainty and improves accountability by enshrining the binding obligations of both parties.
Performance-Based Funding: Too often, once development projects were approved, donors’ focus turned inward to implementation, achieving outputs, and keeping funds flowing even if receiving governments actively undermined them. Gradually, funding agencies have begun shifting to performance-based disbursements. By requiring a host government to demonstrate – through its actions, not merely its rhetoric – that it remains politically and financially committed to achieve professed objectives, we ensure that U.S. assistance achieves greater impacts.
Under President Trump and Secretary Rubio’s leadership, we have the opportunity and courage to acknowledge our mistakes, to embrace candid lessons learned, and to do better. America’s generosity in doing business with those who help themselves remains as strong as ever. We are not turning away from less developed nations, instead now is the time to lean in to lend a useful hand to those who are sincere and treat them as mature stakeholders. In engaging valued, sincere nations, nothing should be imposed, hidden, given as ultimatums, or come at the partner’s expense; we are not China. Foreign assistance that delivers for the American people and our partners must be founded on sincere, voluntary, and transparent engagement. But it must be backed by tangible action and, if a recipient nation proves through their actions that they are not committed to our professed shared objectives, our allegiance must first be to the American people to be stewards of their resources.
Having dedicated my life and career to Africa and the developing world, I am invigorated by the massive potential these nations possess, and I have witnessed how the United States can help turn that potential into a reality that benefits both nations. By restructuring our approach to foreign assistance and engaging developing countries based on national interest, we can help curb the corruption that deprives families of the hope of that better future. We can deliver lasting and systematic growth alongside recipient countries. And, we can deliver tangible value for the American people through a more secure and prosperous world.
For the Silo, U.S. Ambassador Michael C. Gonzales.
Michael C. Gonzales is the U.S. Ambassador to the Republic of Zambia and the U.S. Special Representative to the Common Market of Eastern and Southern Africa (COMESA). He has held senior posts throughout Africa and Asia over his career.
A truism in real estate is that the best time to sell is during the spring and summer months.
You have more buyers, prices and valuations are higher, and your home simply looks better under the bright summer sun than during the drab winter gloom. But what if you really need to sell your home now?
If you have a fence, then it’s the first thing that people encounter as they walk to your home. It should give a good first impression, so you need to fix damages if there are any. You can also consider repainting it to make it look new.
Don’t forget to make sure that the latch works perfectly too. It should close easily enough without any sort of fussy process.
Prune your trees.
The trees near your home shouldn’t block the buyer’s view of your house. Instead, the trees should have silhouettes that frame the house to make it look much better. It’s best to prune your trees during their dormant periods when they don’t have leaves. This makes it easier for you to see the shape and structure of the tree.
Remove the damaged and diseased branches first. Then get rid of the branches that hang low enough to obscure your house and hang over walkways. Finally, thin the crown to improve the air circulation and the amount of light.
Plant snow flowers.
You can plant early narcissi and snowdrops in your garden, along with a few clumps at the edges of your walkways. These can add some color to your home amidst all that white snow.
You can also plant hardy hellebores that thrive during the winter months, such as the Ashwood Neon, the Walberton’s Rosemary or even the stinking hellebore (H. foetidus).
Attract more birds near your home.
Having plenty of birds around is great during the winter. The place seems alive, and you get plenty of colors. You can do this simply by putting up a bird feeder on your property. You can also plant shrubs in your garden that are known to attract birds. These include bayberry, snowberry, and burning bush.
Touch up the house number.
Your house number is important because you want your potential buyers to find your home more easily. Sadly, plenty of homes have rather illegible house numbers.
Even those that are noticeable can seem outdated or downright unattractive. You can improve its look in various ways so that it becomes appealing and also prominent.
Keep the house clean.
One problem during the winter is that plenty of people track in mud after walking around in the snow and sludge. Often doormats aren’t just up to the job of getting rid of all that gooey mess.
However, you can arrange for boots to be removed first before people enter the home. If that’s not possible, you can at least buy and set up an effective boot scraper that can help your doormat get rid of the mess.
Use your Christmas lights.
Put them up early, and leave them up until February if you have to. These lights can really make your home look better.
Use plenty of Christmas décor for more color as well.
Wash your windows.
You need to get rid of the grime in your windows, which prevents the sunlight from getting into your home.
Amid escalating crises in the Middle East and the developing world, Life for Relief and Development (LIFE) has been recognized as the third-best global humanitarian organization by Charity Navigator. The organization also secured fifth place for its humanitarian work in Palestine, and fifth place worldwide in the fight against poverty. These achievements earned LIFE a 100% rating, an endorsement from the U.S. Agency for International Development (USAID), as well as recognition by Impactful Ninja as one of the top humanitarian organizations in North America. LIFE was further honored with the Humanitarian Partnership Award for its collaborative initiatives.
Sustainable Programs and Comprehensive Seasonal Projects
Vicki Roob, Administrative Director at LIFE, explained that the organization was founded more than 33 years ago in the United States and works across more than 60 countries through 14 international offices.
Over the years, LIFE has distributed more than $624 million usd/ $859 million cad in humanitarian aid, supporting programs in food security, clean water, temporary shelter, healthcare, education, community development, family assistance, refugee support, and emergency relief during wars and natural disasters. Currently, the organization supports more than 13,100 orphans worldwide, providing essential care, nutrition, housing, and education, while also organizing annual Global Orphan Festivals filled with games, gifts, and entertainment to ensure children feel valued and supported.
Tent Camps That Saved Thousands of Lives in Conflict Zones
According to Dr. Abdulwahab Alawneh, Regional Director for Jordan and Palestine, LIFE implemented its “LIFE Organized Camps” project in Gaza, establishing nine camps across the north, center, and south of the Strip. Built with fire-resistant and durable materials, these camps provided shelter for 46,000 displaced people, featuring easily dismantled tents to accommodate recurring displacement. Each tent was equipped with bedding and essentials, alongside medical facilities, solar panels serving 7,000 individuals, and protective insulation for 3,000 residents against extreme weather. Clay ovens benefited 3,500 people, while 23 sanitation units were constructed.so LIFE Assisted 1.3 million Displaced People in general in GAZA.
Adding: “we’ve been proactively preparing to facilitate the delivery of urgent relief—shelter, food, water, medicine, and personal necessities—into Gaza. Our team on the ground has already begun implementing LIFE’s ninth camp project after tents arrived and installation began. We are now working to shelter 15,000 newly displaced families still exposed to the cold as winter approaches.
These are waterproof, cold- and humidity-resistant tents that also provide insulation against heat in summer. Made from PVC material, they have protected more than 29,000 families from fires during nighttime bombings in past years.
Using all borders to Gaza
We faced tough challenges but managed them through our extensive experience. We are not newcomers to Gaza’s relief field. We worked through approval requirements for specific items—like tent specifications—while some organizations struggled to get their tents through the crossings. Tents vary in size and function: family tents, medical point tents, hospital tents, and educational tents.
We are now awaiting approval for mobile housing units. However, shelter items like mattresses and blankets have been entering through Egypt on LIFE’s trucks without obstacles, while food parcels are transported through Jordan.
“For food items previously restricted for NGOs, we purchase them at discounted rates from local traders and distribute them to those most in need. We spared no effort to reach them—using animals or walking long distances on foot when necessary.
We also supply water—each truck carries 15,000 liters per camp, enough for 500 families for a week—alongside baby formula, infant supplies, medical kits, and medicines. We ensure field monitoring of activities, including eight camps already constructed, and we share updates regularly on social media in multiple languages.”
Emergency Relief and Orphan Care at the Forefront
In the past year alone, LIFE allocated approximately $1.1 million usd/ $1.51 million cad in emergency relief to families displaced by conflicts and natural disasters, including earthquake survivors in Afghanistan, Morocco, Nepal, Syria, and Turkey; war-displaced populations in Gaza, Sudan, Syria, and Lebanon; wildfire victims in Bangladesh; flood-affected communities in Afghanistan and Libya; and cyclone-hit regions in Myanmar.
Additionally, $6.4 million usd/ $8.81 million cad was invested in healthcare programs and medical supplies, $4.5 million usd/ $6.2 million cad in educational projects, and $2.1 million usd/ $2.89 million cad in in-kind aid shipments. Orphan support remained a priority, with more than $3.8 million usd/ $5.23 million cad dedicated to orphan sponsorship, education, and healthcare.
Seasonal projects also played a significant role: nearly $1.7 million usd/ $2.34 million cad was spent on Ramadan and Eid initiatives, with more than 11 million meals distributed across 36 countries during Ramadan alone. Over 272,620 individuals in 38 countries benefited from Qurbani (sacrifice) distributions. LIFE also allocated $1.4 million usd/ $1.93 million cad toward emergency food relief and constructed 122 water wells worldwide.
Our friends at The InvestorsObserver research team have looked into how gold affordability has changed over years when compared to American wages. Parallels can be drawn between Canada wages and gold affordability.
They found that despite steady rises in US dollar salaries, the average American’s purchasing power, when measured in ounces of gold, has plummeted by 77% since 1998.
Gold-adjusted income shows the real purchasing power.
Interestingly, by 2012, even the most prosperous states had wage levels equal to poverty thresholds from just 15 years earlier, revealing the erosion of real wealth, and a plummet to what used to be perceived as poverty level.
Every Thanksgiving, thousands of our friends below the border strive to make sure everyone has a meal. If it’s the third Thursday in November you can count on a lot of generous giving.
Most take part in the holiday’s rituals, including traveling to spend time with family and counting life’s blessings, and 19% also donate to charities to help others eat well around the holiday, according to a recent poll. It is a time of year that many Americans volunteer at food banks, churches or service organizations in order to help prepare meals or provide ingredients to those without enough.
Volunteers with Operation Turkey, a national nonprofit based in Austin, Texas, cook and deliver thousands of Thanksgiving meals complete with turkey, stuffing, gravy, vegetables and a slice of pie.
After 25 years, the all-volunteer organization has expanded to about 20 cities and now operates in states beyond Texas, including North Carolina and Pennsylvania. “It’s inspiring and humbling watching our local community rally together to make a difference for their neighbors,” says Josh Ortiz , an Operation Turkey volunteer in Dallas. “It all matters and makes a difference.”
Many Americans want to help others while also getting in a little exercise before the big meal. (The average American consumes 4,500 calories on Thanksgiving, according to the Calorie Control Council). Thus, turkey trots — events where people run or walk to raise money for charities — are held in cities and towns across the country. Turkey trots make Thanksgiving “the biggest U.S. running day of the year,” according to the website RunSignup.com.
How about Canadian Thanksgiving Calories?
Ohio Turkey Trot
The 5K Turkey Trot in Granville, Ohio, drew 1,900 runners in 2024 and raised $130,000 usd/ $183,300 cad for a local food bank. Michelann Scheetz, of St. Luke’s Church, which organizes the annual event, says a team of volunteers works to pull off the Thanksgiving Day tradition that started in 2005. America’s Trot for Hunger, held in Washington, is now in its 24th year and draws thousands.
Jessica McCrorie, who served as a teen ambassador for the national nonprofit Feeding America, said she saw Thanksgiving bring out her own and others’ spirit of generosity. While volunteering with Island Harvest, McCrorie helped the nonprofit in Melville, New York, collect 30 turkeys and hundreds of dollars in donations at a grocery store.
“I feel like people may have felt more generous and connected to the issue of hunger because the Thanksgiving holiday is a time for family and friends to come together and share a meal,” she told Feeding America .
In the second year of our regulatory scorecard paper, results continue to show the need for a more balanced approach to financial oversight, one that explicitly incorporates innovation and competition alongside traditional stability and consumer protection goals.
Newly issued and updated regulatory documents did not change previous results.
The imbalance reflects the mandates of Canadian regulators, which stand in contrast to those of their UK, Australian, and US peers, where innovation and competition are more explicitly recognized.
The study highlights deficiencies in the implementation and communication of cost-benefit analyses. Compliance costs are increasingly embedded across most of the financial sector workforce, with the share of labour costs and revenues devoted to compliance rising steadily, significantly exceeding international counterparts, and falling disproportionately on smaller firms.
If left unaddressed, these asymmetric and rising compliance costs risk diverting skilled labour and capital away from core business functions, undermining productivity, innovation, and the overall competitiveness of Canada’s financial sector.
Modernizing the mandates of Canadian regulators to explicitly recognize the tradeoffs between stability, investor protection, and economic dynamism is an economic imperative.
1. Introduction
Canada continues to face a well-documented struggle with weak productivity growth, poor business investment, and sluggish economic expansion.1 There is also a quantifiable link in Canada between growing regulatory burdens, including financial sector regulation and weaker growth.2 The challenge, therefore, is not whether to regulate, but how: regulators must find a balance between safeguarding financial stability and enabling economic dynamism. Achieving such a balance could be especially consequential in Canada, where both growth and competitiveness remain fragile.
Against this backdrop, a crucial question is whether Canadian financial regulators operate within a sound and structured framework that ensures the implementation of truly necessary rules and regulations. To provide an answer, this paper builds on the work of Bourque and Caracciolo (2024)3 which employed two complementary types of analysis – one theoretical, one empirical – to shed light on the strengths and the weaknesses of Canada’s regulatory landscape.
The theoretical analysis established the foundation for evaluating regulatory effectiveness by defining the core principles that should guide financial regulators in building a sound and efficient regulatory framework.4 It identified three essential steps that should underpin any regulation-making process: (1) thoroughly identifying the problem; (2) conducting a comprehensive cost-benefit analysis to weigh the implications of potential regulations; and (3) clearly articulating objectives to ensure predictability and consistency.
The empirical analysis involved a two-stage quantitative and qualitative textual analysis. The first stage consisted of an international comparison, where the performance of Canada’s primary federal financial regulator – the Office of the Superintendent of Financial Institutions (OSFI) – was benchmarked against two international counterparts: the United Kingdom’s Prudential Regulation Authority (PRA) and the Australian Prudential Regulation Authority (APRA). This comparative analysis helped contextualize OSFI’s regulatory approach in relation to best practices observed in other financially comparable jurisdictions.
The second stage dug deeper into the Canadian financial regulatory landscape, evaluating the regulations of the main federal and provincial bodies against the principles identified in the theoretical framework. To do this, Bourque and Caracciolo (2024) developed a comprehensive scorecard that assessed core regulatory documents to determine the extent to which Canadian regulators adhered to these principles.
The findings showed that although Canadian regulators have generally succeeded in crafting well-structured regulations, their approach often falls short of adhering – on aggregate – to the core principles outlined in the framework. This leads to a lack of predictability and a more reactive, rather than proactive, set of rules and regulations. In this environment, rules are introduced in response to emerging challenges rather than through proactive, forward-looking planning. Further, there is a notable lack of systematic and substantive use of cost-benefit analysis, both in the development of regulations and in communicating their expected impact.
The scorecard allowed for an investigation into the priorities of Canadian regulators. Most of the current regulations in Canada place financial stability and consumer protection as their primary goals. These are, of course, both crucial objectives; however, they are too often pursued without adequate consideration of their interplay with innovation and competition. As a result, regulatory frameworks may end up stifling growth, particularly among smaller firms that lack the resources to absorb compliance costs as easily as larger institutions.
Building on last year’s study, this paper has three principal objectives. First, it updates the regulatory scorecard. An annual update makes it possible to track how Canadian regulatory priorities evolve over time and assess whether any progress is being made in addressing the shortcomings identified earlier. Notably, this updated scorecard reveals that the fundamental orientation of Canadian financial regulation remains largely unchanged: stability and consumer protection continue to dominate (if anything, with a slight uptick), while considerations of dynamism, innovation, and competition remain on the back burner. To be sure, some rebalancing is emerging. Ad hoc initiatives – such as blanket orders, sandbox activities, and similar discretionary measures – have introduced some pockets of innovation and efforts to reduce administrative burden. Nevertheless, our main point persists: without a deeper shift in regulatory philosophy, such measures risk remaining isolated exceptions, rather than indicative of a broader shift.
To probe the core of Canadian regulators’ philosophy – and to test whether the observed regulatory imbalance is structural – the analysis is extended to include foundational documents that set out regulators’ objectives, mandates, and missions.5 Examining these texts allows for an assessment as to whether the current priorities are rooted in the very design and self-perception of regulatory institutions, rather than from recent or temporary policy choices. The results show a clear hierarchy of objectives in regulator mandates across the country, with stability and consumer protection firmly dominant. This stands in contrast to the mandates of regulators in the UK, Australia, and the US, where innovation and competition feature more prominently. Without a shift toward a more balanced regulatory philosophy, Canada risks falling further behind in competitiveness, innovation-driven growth, and overall economic resilience.
One consequence of this regulatory imbalance is the potential for disproportionate compliance costs – relative to benefits – being imposed on the financial sector. Hence, the third goal of the paper is to evaluate the cost side of cost-benefit analysis in regulatory decision-making. We do this by quantifying and identifying compliance costs imposed by financial regulations across different financial subsectors, with particular attention to varying firm sizes. By empirically assessing these costs, this study fills a critical gap in the literature, offering concrete evidence of how current regulatory frameworks affect businesses, especially smaller firms that may face a heavier burden. Our aim is to start a new, thorough, and reliable database that will create valuable insights for policymakers and regulators.
The first wave of results is concerning.
Although the benefits of regulation are difficult to measure, compliance duties are becoming increasingly embedded across most of the financial sector workforce. The share of labour and revenues devoted to compliance continues to rise – well above international counterparts – and the burden falls disproportionately on smaller firms. If left unaddressed, these asymmetric and rising compliance costs risk diverting skilled labour and capital away from core business functions, further undermining productivity, innovation, and the overall competitiveness of Canada’s financial sector.
2. The Updated Scorecard
2.1 Methodology
To update the regulatory scorecard, we employ the same textual and topic analysis framework as in the previous study (Bourque and Caracciolo 2024), applying it to newly issued and updated regulatory documents from the past year (June 2024 to June 2025) alongside previous documents. Our focus remains on key regulatory materials across the banking, insurance, pensions, and securities sectors, including Financial Services Regulatory Authority of Ontario (FSRA) Guidelines, Autorité des marchés financiers (AMF) Guidelines, Office of the Superintendent of Financial Institutions’ (OSFI) Guideline Impact Analysis (and related documents), and Canadian Securities Administrators’ (CSA) Companion Policies.6
Using natural language processing (NLP) techniques (see Bourque and Caracciolo [2024] for a more complete description), we extract and classify key terms, sentences, and logical arguments to assess how these documents address market failures (e.g., market abuse, asymmetric information, systemic and liquidity risk), policy objectives (e.g., stability, transparency, efficiency), and cost-benefit considerations.7 This allows us to evaluate the extent to which Canadian regulators align with the core principles of sound regulatory decision-making: problem identification, cost-benefit assessment, and clear articulation of objectives.
While the core methodology remains unchanged, this iteration refines our classification process.8 We will perform this update on an annual basis, allowing us to systematically track shifts in regulatory priorities over time. The full updated scorecard, which reflects these refinements and new findings, is presented in online Appendix C (Table 1).
2.2 Results
This updated regulatory scorecard reveals similar results as last year in Canadian financial regulation: the fundamental priorities of regulatory authorities have remained largely unchanged, with consumer protection, transparency, and stability dominating the regulatory agenda. Despite ongoing discussions about the need to stimulate economic growth in Canada, our analysis indicates that a more balanced approach to financial oversight, one that explicitly incorporates innovation and competition alongside these traditional goals, remains largely absent from newly issued and updated regulatory documents (evaluated alongside existing documents).
Most regulatory initiatives (approximately 92 percent versus 89 percent of last year) primarily target market abuse, stability, transparency, and, ultimately, improved consumer protection. On the other hand, a smaller fraction (around 14 percent, compared to 16 percent last year) explicitly aim to enhance efficiency, promote growth and innovation, and take into account the stability versus dynamism trade-off that is a critical part of any regulatory structure.
One notable exception among the newly analyzed documents is delivered by FSRA’s Guideline GR0014APP, which demonstrates a departure from the prevailing regulatory narrative. This document explicitly acknowledges the importance of fostering a more dynamic financial marketplace, introducing measures aimed at reducing barriers to entry and enhancing the competitive landscape.9 We also acknowledge that CSA’s National Instrument 81-101 Mutual Fund Prospectus Disclosure, which focuses on enhancing transparency and investor protection through standardized disclosure requirements, aims to simplify the disclosure procedure and, therefore, represents an important step forward in regulatory efficiency.
Beyond these individual measures, we note that FSRA and CSA have also set out broader ambitions. FSRA’s 2024–2027 Strategic Plan highlights burden reduction and regulatory efficiency, while CSA’s 2025–2028 Business Plan emphasizes internationally competitive markets and regulatory approaches that adapt to innovation and technological change. These commitments are commendable and encouraging, but they remain largely aspirational: they signal intent, but the challenge is whether they will translate into consistent features of day-to-day regulatory instruments. Our annual updated scorecard will be able to monitor this.
Breaking down our analysis to the single regulator level, FSRA stands out as the one that has gone furthest in bridging the gap between intentions and actions: around 17 percent of its analyzed documents now contain growth or innovation considerations (up from 13 percent last year). By contrast, CSA – which admittedly had the highest percentage last year – OSFI, and AMF remain closer to their prior levels, with innovation-oriented content in only 18 percent, 10 percent, and 10 percent of their documents, respectively. For now, the broader regulatory environment continues to disproportionately prioritize risk mitigation and consumer safeguards over fostering a more adaptive and competitive financial sector.
Moreover, and again consistent with last year, there is a dearth of explicit cost-benefit analysis or meaningful discussion of the broader economic costs imposed by the regulatory interventions across nearly all examined documents.10
3. Where Does This Imbalance Come From?
Our scorecard raises a fundamental question: is this imbalance an unintentional result, or does it reflect the regulators’ mandate and therefore a structural feature of Canada’s regulatory landscape? To answer this, we examined the mandates and missions of Canadian financial regulators (prudential and securities regulators alike). For the vast majority, dynamism, competition, and capital formation are typically only included following the mission statements – OSC being a notable exception. The primary focus of the mission statements remains on stability, investor protection, and market integrity, which are vital but fall short of capturing the full potential of a dynamic, innovative financial sector.
For example, OSFI’s mandate is to:
“ensure federally regulated financial institutions (FRFIs) and federally regulated pension plans (FRPPs) remain in sound financial condition;
ensure FRFIs protect themselves against threats to their integrity and security, including foreign interference;
act early when issues arise and require FRFIs and FRPPs to take necessary corrective measures without delay;
monitor and evaluate risks and promote sound risk management by FRFIs and FRPPs.”11
It is only after that that they say, “In exercising our mandate:
for FRFIs, we strive to protect the rights and interests of depositors, policyholders and financial institution creditors while having due regard for the need to allow FRFIs to compete effectively and take reasonable risks.”
To further substantiate this point, we look to see whether the secondary status of competition, cost, and innovation in Canadian regulators’ mandates is a uniquely Canadian phenomenon or part of a broader international pattern. Benchmarking against international best practices is particularly relevant in financial regulation, where peer jurisdictions face similar market dynamics and policy tradeoffs. By comparing Canada’s regulatory mandates to those of similar international counterparts, we can better assess whether the Canadian approach reflects a deliberate policy choice or a missed opportunity to align with evolving global standards.
As in the scorecard, we conducted a systematic textual analysis of the mandates and missions of major financial regulators in Canada, the UK,12 Australia,13 and the United States.14 Using natural language processing techniques, we extracted and quantified the most prominent themes and keywords in these foundational documents.15 The results are visually summarized in the accompanying wordclouds. The size of each word reflects its frequency and “keyness” – a measure of statistical importance and relevance within the analyzed texts. Unlike simple term frequency, this approach highlights the concepts and priorities regulators emphasize disproportionately relative to the overall corpus, providing a more nuanced quantitative assessment. The wordclouds thus offer an intuitive visual snapshot of the dominant regulatory themes.
What emerges from this analysis is a clear divergence in regulatory philosophy. The wordclouds for the UK and Australia show that terms such as “competition,” “growth,” and “cost” are extremely relevant in the language of their regulators’ mandates. This reflects an explicit and deliberate embedding of economic dynamism and efficiency into their regulatory objectives.
Indeed, the UK’s PRA and Australia’s APRA, while maintaining stability and consumer protection as core priorities, have made efforts to explicitly incorporate competition, innovation, and market adaptability into their mandates over the past decade (Figure 1). The PRA, for example, makes the case that long-term resilience requires a financial sector that is not only stable but also competitive, forward-looking, dynamic, and innovative. By integrating efficiency and market innovation, the PRA looks to ensure that the financial ecosystem can grow and evolve with emerging market demands.
Similarly, APRA’s mandate balances the primary objective of safety “with considerations of competition, efficiency, contestability (making barriers to entry high enough to protect consumers but not so high that they unnecessarily hinder competition) and competitive neutrality (ensuring that private and public sector businesses compete on a level playing field).”16
In contrast, the wordclouds for Canadian deposit-taking and insurance regulators reveal a notable absence of such language (see Figure 2 for OSFI, FSRA17, and AMF18). Their mandates and mission, while perhaps containing references to competition and growth, are dominated by terms like “stability,” “solvency,” “obligation,” and “consumer protection.”
This linguistic gap is not just cosmetic; it reflects a structural difference in regulatory philosophy. Without a formal mandate to consider competition or cost, many Canadian regulators have less incentive to systematically integrate these factors into their rulemaking.
A similar divergence is evident in securities regulation. The UK’s Financial Conduct Authority (FCA) and the US Securities and Exchange Commission (SEC) place competition, growth, dynamism, and capital formation at the centre of their regulatory mandates (Figure 3).19
These are not just theoretical differences. SEC’s statutory responsibility to facilitate capital formation led to a practical framework that drives policies to increase market access for a broader range of firms. The SEC has introduced initiatives such as Regulation A+ and crowdfunding exemptions, which aim to make it easier for small and emerging firms to raise capital while balancing investor protection. The FCA’s mandate similarly incorporates competition as a core principle, emphasizing measures to ensure that financial markets remain vibrant and responsive to technological progress, highlighting also how this, in turn, will increase investors’ welfare.
In contrast, although some of the largest securities commissions – such as the OSC, BCSC, and ASC – are notable exceptions, explicit competition or capital formation mandates are not necessarily the norm across our 13 provincial securities commissions, nor at the umbrella organization, the CSA (see Figure 4 for CSA’s wordcloud).20The Ontario government did take a step in this direction in 2021, when it expanded the OSC’s mandate to include fostering capital formation and competition.
While investor protection and market integrity remain fundamental and essential objectives, the absence of a consistently clear directive to foster market dynamism means that regulatory actions are more likely to be slanted towards a more cautious, conservative approach. There have certainly been some targeted efforts to support innovation and broaden access to capital, such as the CSA’s Financial Innovation Hub21 and their harmonized crowdfunding rules, but these remain isolated and ad hoc. Unlike the systematic, mandate-driven commitment seen in the UK and the United States, Canadian initiatives are not consistently rooted in a formal regulatory priority to promote capital formation.
This regulatory gap is particularly concerning given Canada’s persistent struggles with weak productivity growth, poor investment, sluggish economic expansion, and relatively low levels of innovation adoption.22 A financial regulatory environment that does not explicitly encourage competition, innovation, and capital formation may reinforce these trends by raising barriers to entry, increasing compliance costs for smaller firms, and discouraging capital market participation, particularly from high-potential startups and emerging sectors. The absence of a statutory capital formation mandate within securities regulation means that new firms seeking to grow or disrupt established industries may face challenges in accessing the funding they need, further contributing to a stagnant market environment.
Modernizing the mandates of Canadian regulators to explicitly recognize the tradeoffs between stability, investor protection, and economic dynamism is an economic imperative. Without a shift toward a more balanced regulatory philosophy, Canada risks falling further behind in capital market competitiveness, innovation-driven growth, and overall economic resilience. Financial stability does not have to come at the expense of progress, and as other international regulators are trying to do, we should aim to achieve the best-designed regulatory framework in order to foster both stability and market growth. A more forward-looking mandate, in which competition, capital formation, and innovation are treated as integral to the health of the financial system, would not only strengthen Canada’s economic position but also ensure that its regulatory framework remains adaptable to future challenges and opportunities.
4. Neglected by Design: Quantifying the Costs of Regulation
A practical consequence of the imbalance in regulatory priorities are gaps in how cost-benefit analyses are designed and implemented in Canadian financial regulation. A further goal of this paper is to help push this issue ahead by developing a method for more accurately quantifying regulatory costs. The aim is to create a new, annually updated and survey-based cost database that provides a new lens on the regulatory burden and equips regulators with a tool to better understand the real impact of their activity across firms of different sizes and sectors. We acknowledge upfront that we focus specifically on the cost side of the analysis, leaving the benefits assessment to future work.
4.1 The Importance of Quantifying Regulatory Costs and the Difficulties Implied by the Task
The costs of regulations – across all industries, including financial services – are often cited as one of the biggest factors contributing to reduced market entry, increasing industry concentration, and weak investment. This pattern is evident worldwide, including in the United States and Canada (Gutiérrez and Philippon 2019, 2017), as well as in many other developed countries (Aghion et al. 2021). The mechanism postulated by the literature above is that compliance costs as a result of government regulations disproportionately impact small firms, creating barriers to new entrants, inhibiting business growth, and therefore ultimately slowing down productivity. Additionally, when large incumbents face increased regulatory costs, they either incur them, which may affect other parts of their business, or pass some of these costs on to consumers, especially if, given higher barriers, they end up possessing significant market power. As a result, consumers will also be adversely affected, which has broader implications for the overall economy.
The central issue remains the unresolved question of how to define and quantify the total compliance cost properly, as well as how to assess whether these costs affect small and large firms differently. Measuring compliance costs at the firm level is, in fact, a highly complex challenge from both qualitative and quantitative perspectives.
First, from a qualitative perspective, there is no unanimous agreement on which costs to include and how to model their impact on different firms. While some argue that the biggest part of compliance costs can be significantly decreased through economies of scale and lobbying, and therefore are much smaller for larger firms (Davis 2017; Alesina et al. 2018; Gutiérrez and Philippon 2019; Akcigit and Ates 2020; Aghion et al. 2021), others suggest that small businesses are, in fact, the ones in a better position, as they receive plenty of exemptions (Brock and Evans 1985; Aghion et al. 2021).23
Second, from a quantitative perspective, measuring firm-specific regulatory burdens presents numerous obstacles. Quantifying firm-level compliance costs is complex due to limited granular data. Existing studies often focus on broad relationships or industry-level shocks (Gutiérrez and Philippon 2019), lacking detailed evaluations of individual business burdens. These obstacles include variations in regulatory requirements across financial subsectors, overlapping regulations from different government levels, tiered compliance rules, varying inspection stringency, and differing technological and efficiency constraints across firm sizes (Agarwal et al. 2014; Stiglitz 2009; Kang and Silveira 2021; Goff et al. 1996). As Goff et al. (1996) noted, “the measurement problems are so extensive that directly observing the total regulatory burden is practically impossible.”
4.2 Modelling and Measuring Compliance Cost and Its Impact on Labour Productivity: Traditional Methods and Our Approach
Traditional approaches to quantifying the regulatory burden typically fall into two broad categories: counting the number of regulations in force or measuring the size of compliance departments within firms.24 The first approach, despite its widespread use, is simplistic and can be misleading. It assumes that each new regulation automatically adds the same weight to firms’ compliance burdens, failing, therefore, to account for differences in complexity, enforcement, and actual economic impact. Most importantly, it also disregards the fact that not all regulatory documents impose additional costs. Some provide clarifications, interpretation, simplify compliance procedures, or consolidate existing rules, thereby reducing uncertainty and making it easier for businesses to adhere to legal requirements. A regulatory framework with an extensive set of well-organized, clearly written guidelines can be far easier to navigate than a system with fewer but ambiguous or conflicting regulations. Yet, a raw count of regulations makes no such distinctions, treating all rules as equally burdensome and limiting insights into the real costs faced by businesses.
The second common approach – measuring the size of compliance departments – is somewhat more informative but still incomplete. This method operates on the assumption that regulatory costs can be estimated by looking at the number of employees explicitly assigned to compliance roles.25 While this metric does offer a tangible measure of firms’ direct expenditures on compliance, it fails to capture the reality that regulatory obligations extend far beyond dedicated compliance teams. In practice, firms cannot limit compliance tasks to a single department; employees across multiple functions – including finance, operations, and even customer service – must allocate significant portions of their work to meeting particular regulatory requirements. These responsibilities often divert employees from their core business functions, increasing operational complexity and reducing efficiency in ways that are difficult to measure using traditional methods.
The failure to account for these indirect costs leads to a fundamental misrepresentation of how regulatory compliance affects firms, particularly with respect to labour productivity. Standard measures of productivity typically calculate output per worker, assuming that all employee time is dedicated to value-generating activities. However, when employees across departments must dedicate significant portions of their time to compliance, their effective contribution to production decreases even if they are not officially counted as part of the compliance workforce. This distortion is particularly relevant in highly regulated industries, such as the financial sector, where firms must continuously adapt to evolving rules, engage in periodic audits, and maintain detailed reporting practices. These obligations consume work hours that could otherwise be devoted to innovation, strategic growth, or client service. By failing to account for these hidden labour costs, traditional approaches systematically underestimate the true economic impact of regulatory compliance.
Evidence in support of this argument comes from occupational data sources such as the US O*NET database, which provides firm-level insights into job responsibilities at the single-employee level across industries. These data reveal that compliance-related tasks affect, to different extents, most of the workers, and are not confined to designated regulatory personnel.26
A more accurate framework for assessing regulatory costs must therefore go beyond these limited proxies and capture the full extent of compliance-related labour reallocation. This is precisely what we try to accomplish with our project. Through detailed firm-level surveys, we collect data not only on compliance department size but also on how regulatory responsibilities are distributed across the entire workforce. By distinguishing between employees who are fully dedicated to compliance and those who must allocate a portion of their time to regulatory tasks, we can develop a more precise estimate of how compliance demands affect firms’ overall labour productivity and financial performance. Our approach, which we call the Compliance Labour Cost Index, allows us to measure variation in regulatory costs across firms of different sizes and financial subsectors, helping to assess whether burdens are proportionate or not.27
Furthermore, our survey methodology captures the evolution of compliance intensity over time. This paper presents the first wave of our survey, with our long-term goal being to conduct it every year, thereby creating a dynamic, up-to-date resource for understanding regulatory costs. By maintaining a consistent, structured approach to data collection, we will be able to track changes in compliance burdens over time, offering insights into whether new regulations are increasing costs, whether firms are finding more efficient ways to comply, and how regulatory expenses vary across different business models. This database will provide a clearer picture of regulatory costs at the firm level and also equip policymakers with the empirical evidence necessary to design smarter, more effective regulations – ones that balance economic growth with necessary oversight.
The results presented here are based on an unbalanced panel29 of survey responses covering three fiscal years: 2019, 2023, and 2024.30 This structure allows us to capture both pre- and post-pandemic conditions while filtering out the most acute COVID-19-related distortions in 2020, 2021, and 2022. The panel includes firms of varying sizes across the different subsectors of the Canadian financial sector, enabling both an aggregate view and size-based comparisons. The key findings from this survey can be grouped into four main observations, each highlighting a distinct aspect of the compliance burden.
Fact 1: Compliance is Everyone’s Job!
Compliance work is now deeply embedded across the financial sector workforce. In 2024, on average, 73 percent of employees had at least some compliance-related duties, and close to 8 percent spent the majority of their time (75–100 percent) on such tasks. As postulated in the previous sections, regulatory obligations are not confined to specialist compliance teams but are interwoven into the daily operations of most departments, diverting time and focus away from activities that directly generate value for clients or shareholders. The pervasiveness of compliance roles means that regulation is no longer something handled at the margins of the business, but rather a constant presence shaping workflows across the organization.
Fact 2: Compliance Is Eating Payroll – A Growing Regulatory Burden Is Reshaping Workforce Allocation
The share of total labour costs devoted to compliance-related activities (time and salaries spent meeting regulatory requirements rather than delivering core products or services) has been rising steadily. Our Compliance Labour Cost Index stood at approximately 16 percent in 2019, rose to around 19 percent in 2023, and reached 22 percent in 2024. To put it differently, around one dollar in every five spent on payroll is now directed to tasks that exist solely to ensure regulatory adherence. To put these figures in context, Trebbi et al. (2023), using US establishment-level O*NET data, estimate that regulatory compliance accounts for 2.3 percent to 2.7 percent of total labour costs across the US financial sector. This divergence highlights the crucial need for a more systematic cost-benefit approach in Canadian regulatory design. We simply cannot afford such a big gap.31
Fact 3: External Compliance Costs Are Also Surging, and Are Eating into Revenues
While internal labour costs capture the human effort behind compliance, they tell only part of the story. A significant (and growing) portion of the regulatory burden is channelled through external spending: advisory fees, legal fees, compliance technologies, governance structures, and membership dues. These costs are less visible but no less impactful, directly affecting firms’ bottom lines and reducing their strategic flexibility. To gauge both their scale and their evolution over time, we measure external compliance costs as a share of total revenues. We can observe how this ratio has risen steadily over the three years analyzed, climbing from about 1.2 percent in 2019 to 1.6 percent in 2024. The increase reinforces how compliance imposes a mounting financial strain beyond internal labour, diverting resources that could otherwise be invested in innovation, growth, and other productive initiatives.
Fact 4: Size Matters (a Lot!) – The Compliance Burden Hits Small Firms Hardest
A striking asymmetry emerges between small firms (under 100 employees) and large firms (over 100 employees).32 While the growth rate of compliance involvement and costs appears independent of firm size, their magnitude is not. In both 2023 and 2024, an average of 35 percent of workers in small firms had high or medium compliance involvement, compared with just 13 percent in larger ones.
As a natural consequence, smaller institutions shoulder significantly higher compliance costs: in 2024, the labour cost index reached 20 percent for small firms, compared with 12 percent for larger ones.
This imbalance is particularly worrying when we consider that small firms and startups are often the main engines of innovation, and as they grow, of productivity growth as well. Yet, these seem to be precisely the firms disproportionately drained by regulatory demands, risking a throttling effect on the dynamism and competitiveness of the entire financial sector.
In short, these facts require attention. Reassessing compliance costs must be an urgent priority on the regulators’ agenda, as it is essential to ensure the health and resilience of our financial sector.
5. Policy Discussion and Conclusion
The updated regulatory scorecard confirms that the core patterns identified in prior analysis persist. Canadian financial regulation continues to focus overwhelmingly on stability and consumer protection, while innovation, competition, and cost-efficiency remain secondary. This regulatory orientation is not just a product of recent policy inertia; it is deeply rooted in the structural design of mandates and institutional priorities. Current mandates apply a lexicographic hierarchy that prioritizes financial stability and consumer safeguards above all else – often at the expense of reducing unnecessary regulatory burdens and fostering economic dynamism and growth.
This imbalance is set to become an even greater challenge amid profound global shifts. Political instability in the United States, ongoing conflicts, and broader geopolitical tensions have created a more volatile and unpredictable environment. Stability will remain crucial, but Canada also has an opportunity to adopt regulatory frameworks that actively promote efficiency, innovation, and growth. With such elements in place, Canadian financial institutions can better thrive in a changing world while reinforcing the very stability regulators aim to safeguard.
The costs of the current imbalance are already evident. Evidence shows that compliance burdens are rising sharply, with significant implications for firms’ competitiveness. Our Compliance Labour Cost Index, which tracks regulatory labour across the sector, reveals that compliance demands grew from 16 percent of total internal labour in 2019 to 21 percent in 2024. The strain is particularly acute for smaller firms, where compliance costs reached 28 percent of payroll – double the share borne by larger institutions. External compliance expenses, including advisory, technology, and governance costs, have also grown, further restricting firms’ ability to invest in growth and innovation.
These findings show that stability-focused regulation, absent economic balance, can erode productivity, innovation, and long-term market vitality. Smaller firms are particularly vulnerable, even though they are central drivers of competition and innovation. Policy responses should therefore focus on two priorities.
First, regulatory mandates must be modernized to recognize the full set of policy objectives: stability, investor protection, efficiency, growth, and competition. Explicitly embedding economic goals alongside traditional safeguards would bring Canadian practice closer to international standards and create a more adaptive framework. Encouragingly, securities regulators in Ontario, BC, and Alberta, as well as Ontario’s provincial prudential regulator, FSRA, have already begun acknowledging this need in business plans that emphasize competitiveness and in guidelines aimed at reducing regulatory burden. Our scorecard will continue to track whether such commitments translate into practice.
Second, regulatory design should always require rigorous cost-benefit analyses that are made publicly available at the outset of rulemaking. Transparent, upfront cost-benefit analyses would establish clear benchmarks against which post-implementation reviews can be meaningfully conducted. Tools such as our Compliance Labour Cost Index can enrich this process of comparison. Institutionalizing public cost-benefit analyses would ensure that regulations are evaluated not only against their intended goals but also against their real-world economic costs, enabling more proportionate and adaptive policymaking.
In sum, safeguarding stability and protecting consumers remain essential. But stability itself increasingly depends on Canada’s ability to sustain competitive, innovative, and efficient financial markets.
The author extends gratitude to Pragya Anand, Angélique Bernabé, Ian Bragg, Jeff Guthrie, Sarah Hobbs, Jeremy Kronick, Peter MacKenzie, Grant Vingoe, Mark Zelmer, Tingting Zhang, and several anonymous referees for valuable comments and suggestions. The author retains responsibility for any errors and the views expressed.
Agarwal, Sumit, David Lucca, Amit Seru, and Francesco Trebbi. 2014. “Inconsistent Regulators: Evidence from Banking.” The Quarterly Journal of Economics 129(2): 889–938.
Aghion, Philippe, Antonin Bergeaud, Timo Boppart, Peter J. Klenow, and Huiyu Li. 2019. “Missing Growth from Creative Destruction.” American Economic Review 109(8): 2795–2822.
Akcigit, Ufuk, and Sina T. Ates. 2020. “Ten Facts on Declining Business Dynamism and Lessons from Endogenous Growth Theory.” American Economic Journal: Macroeconomics 13(1): 257–298.
Alesina, Alberto, Carlo A. Favero, and Francesco Giavazzi. 2018. “What Do We Know about the Effects of Austerity?” American Economic Association Papers and Proceedings 108: 524–530.
Brock, William A., and David S. Evans. 1985. The Economics of Small Businesses: Their Role and Regulation in the U.S. Economy. New York: Holmes & Meier.
Davis, Steven J. 2017. “Regulatory Complexity and Policy Uncertainty: Headwinds of Our Own Making.” Brookings Papers on Economic Activity (Fall): 301–375.
Goff, Brian L., et al. 1996. Regulation and Macroeconomic Performance. Vol. 21. New York: Springer Science & Business Media.
Gu, Wulong. 2025. “Regulatory Accumulation, Business Dynamism and Economic Growth in Canada.” Analytical Studies Branch Research Paper Series, no. 481. Statistics Canada. February 10. https://doi.org/10.25318/11f0019m2025002-eng.
Gutiérrez, Germán, and Thomas Philippon. 2017. “Declining Competition and Investment in the U.S.” NBER Working Paper No. 23583. https://doi.org/10.3386/w23583.
_______________. 2019. “The Failure of Free Entry.” NBER Working Paper No. 26001.
Kang, Karam, and Bernardo S. Silveira. 2021. “Understanding Disparities in Punishment: Regulator Preferences and Expertise.” Journal of Political Economy 129(10): 2947–2992.
Restuccia, Diego, and Richard Rogerson. 2008. “Policy Distortions and Aggregate Productivity with Heterogeneous Establishments.” Review of Economic Dynamics 11(4): 707–720.
Stiglitz, Joseph. 2009. “Regulation and Failure.” In New Perspectives on Regulation, edited by David Moss and John Cisternino, 11–23. Cambridge, MA: The Tobin Project.
Trebbi, Francesco, Miao Ben Zhang, and Michael Simkovic. 2023. “The Cost of Regulatory Compliance in the United States.” USC Marshall School of Business Research Paper. January 15. https://doi.org/10.2139/ssrn.4331146.
中文 | 日本語 | Español Quick Takeaways -72% of chief economists expect global economy to weaken in 2026 as disruptions in trade, technology, resources and institutions signal a shift to a new economic environment. -Regional growth pathways are diverging: 56% anticipate greater divergence between advanced and developing economies, with MENA and South Asia emerging as bright spots. -Debt risks are intensifying in advanced economies, with 80% of respondents expecting vulnerabilities to grow.
New York, USA, October 2025 – The global economy is entering a period of weak growth and systemic disruption, according to the World Economic Forum’s latest Chief Economists’ Outlook, published today. Some 72% of surveyed chief economists expect the global economy to weaken over the next year, amid intensifying trade disruption, rising policy uncertainty and accelerating technological change. The findings point to the emergence of a new economic environment shaped by persistent disruption and growing fragmentation.
Diverging Pathways in a Fragmented Global Economy The Outlook highlights sharp regional fault lines. Emerging markets are anticipated to be the main engines of growth, with the Middle East and North Africa (MENA), South Asia and East Asia and Pacific seen as bright spots. One in three chief economists expect strong or very strong growth in these regions. The outlook for China is more mixed, with 56% of chief economists anticipating moderate growth, though deflationary pressures are expected to persist. Growth is expected to remain more stagnant in advanced economies. In Europe, 40% expect weak growth with fiscal loosening (74%) and low or moderate inflation (88%). In the United States [& Canada ed.], most chief economists (52%) anticipate weak or very weak growth and high inflation (59%) as monetary policy is loosened (85%).
The chief economists warn that advanced and developing economies are on increasingly divergent growth pathways – 56% expect greater divergence over the next three years.
Towards a New Economic Environment Chief economists overwhelmingly agree that today’s disruptions are structural rather than cyclical. Large majorities anticipate long-term disruption in natural resources and energy (78%), technology and innovation (75%), trade and global value chains (63%) and global economic institutions (63%). This marks an important shift. The global economy is not so much weathering isolated shocks as realigning, raising the stakes for new forms of leadership, cooperation and resilience.
“The contours of a new economic environment are already taking shape, defined by disruption across trade, technology, resources and institutions,” said Saadia Zahidi, Managing Director, World Economic Forum. “Leaders must adapt with urgency and collaboration to turn today’s turbulence into tomorrow’s resilience.”
Trade Realignment, Fiscal Strain and Debt Risks Structural shifts in the global economy are playing out most visibly in trade, fiscal policy and debt. Some 70% of surveyed chief economists rate the current level of trade disruption as “very high”, far above other domains of the economy, and over three-quarters also expect disruption to trade and global value chains to cascade into other domains. In financial markets and monetary policy, 45% of surveyed economists rate disruption as high or very high, yet only 21% expect it to last. Even so, while 52% see a major near-term crisis in advanced economies as unlikely, 85% warn that any shock could have wide systemic effects.
With global public debt levels mounting, the chief economists surveyed highlight that debt vulnerabilities, once largely associated with emerging economies, are increasingly centred in advanced ones – 80% expect risks in advanced economies to grow in the year ahead. Fiscal vulnerabilities are also more frequently identified among the top growth inhibitors in advanced economies (41%) compared to developing economies (12%). Follow the Sustainable Development Impact Meetings 2025 here and on social media using #SDIM25.
About the Chief Economists’ Outlook The report builds on extensive consultations and surveys with chief economists from the public and private sectors, organized by the World Economic Forum’s Centre for the New Economy and Society. The report supports the Future of Growth Initiative, aiming to foster dialogue and actionable pathways to sustainable and inclusive economic growth.
About the Sustainable Development Impact Meetings 2025 The Sustainable Development Impact Meetings 2025 takes place from 22 to 26 September in New York, bringing together over 1,000 global leaders from diverse sectors and geographies. Held ahead of the World Economic Forum Annual Meeting 2026, these meetings are part of the Forum’s year-round work to accelerate progress on the growth, resilience and innovation through multistakeholder dialogues and action.
Running a business can be a challenging task, especially when you are dealing with multiple tasks and responsibilities at the same time. Fortunately, many tools can help streamline your business operations and make management much easier. In this article, we will take a look at five such tools that can help you manage your business more efficiently.
A personalized ERP
ERP stands for Enterprise Resource Planning, and you may opt for an ERP business application. It is a type of software that helps businesses manage their day-to-day operations by integrating and automating various business functions, such as finance, accounting, inventory, sales, and human resources, into a single system. ERP software provides real-time visibility into all business processes, enabling businesses to make informed decisions based on accurate data.
Slack
Slack is a communication tool that helps teams collaborate more effectively. It allows you to create channels for different projects or teams, which you can use to share files, send messages, and hold virtual meetings. Slack integrates with many other tools, such as Trello and Google Drive, making it an ideal choice for businesses that rely on multiple tools for their operations.
Google Analytics
Google Analytics is a powerful tool that allows you to track and analyze your website’s performance. It provides valuable insights into your website’s traffic, such as where your visitors are coming from, what pages they are visiting, and how long they are staying on your site. This information can help you optimize your website and improve your online presence.
QuickBooks
QuickBooks is an accounting software that can help you manage your finances more effectively. It allows you to track income and expenses, create invoices, and manage payroll. QuickBooks also integrates with many other tools, such as Trello and Google Sheets, making it easy to manage your finances and other business operations from a single platform.
HubSpot
HubSpot is an all-in-one marketing, sales, and customer service platform that can help you manage your business more efficiently. It includes a CRM (customer relationship management) tool, email marketing, social media management, and much more. HubSpot’s powerful tools can help you automate your marketing and sales processes, and improve your customer engagement.
Trello
Trello is a project management tool that helps teams collaborate and stay organized. It is a visual tool that lets you organize your projects into boards and lists, with cards for each task. You can assign tasks to team members, set due dates, and track progress. Trello is great for managing projects of all sizes, from small tasks to large, complex projects.
Managing a business can be overwhelming, but with the right tools, it can be much easier. ERP, Trello, Slack, Google Analytics, QuickBooks, and HubSpot are just a few of the many tools available that can help you manage your business more efficiently.
By using these tools, you can streamline your operations, improve communication, track performance, manage finances, and much more. So, give these tools a try and see how they can help you manage your business more effectively. For the Silo, Bill Gordon.
Being an entrepreneur is a calling for those who not only cope well with risk, but thrive on the challenges it presents. Those who are satisfied by the comfort of a secure job and a steady paycheque need not apply.
It’s an idea that has crossed the minds of virtually everyone who has worked for somebody else, regardless of the job.
As you put in time and labour that ultimately benefits someone else’s business, it dawns on you: Why can’t I just set up shop and do this myself? Why can’t I be the one taking home the big money after all the bills are paid and enjoying the independence of running my own show?
They’re great questions, but the answers aren’t for everybody.
Actually making the decision to give up the security of a steady job, and the regular paycheque and benefits that come along with it, takes a lot of guts and perseverance — especially in today’s highly competitive economy.
Unless you are among the fortunate ones backed by deep resources, the bottom line is this: when you first set out to become an entrepreneur, you are truly on your own. It’s just you and your idea. And it will be the marketplace — relentlessly detached and unemotional — that determines whether you make it or not.
Budding entrepreneurs who do take the risk to start up their own business generally face two key barriers — capital and human resources.
Many entrepreneurs owe their initial success to the trust of friends and family members, who invest funds in their start-up idea. These types of loans can be troublesome if the proper precautions aren’t taken. Make certain the terms of all loans from friends or relatives are spelled out clearly in a promissory note prepared by a lawyer. You may not be dealing with a bank or a financial institution, but you have to treat repayment in the same manner to avoid conflict with your lenders, who also may happen to be your best friend or your sister.
It’s also important to keep your credit record as clean as possible and establish a line of credit, which you can access for instant cash flow at certain times.
Start-ups are limited to hire only the personnel who they can afford, which often means running on a skeleton staff who may not necessarily be those with the greatest skills and experience. This is why most of us who have conceived what we think is a great idea for a business usually choose too much of the work ourselves and wear many hats in the early days.
It can take a long time to find the right employees when you’re just starting out. Some of the top talent may be reticent to work for a small start-up because they are worried about how it will look on their resume, job security or getting a bigger paycheque.
You need to find candidates who share your entrepreneurial spirit and aren’t averse to taking risks. Look for people who want get in on the ground floor and grow with the business.
As you build your company and expand your market, it’s tremendously important to have a network of mentors whose advice and counsel you trust. No matter how much thought and preparation you put into your business plan, you won’t be able to anticipate everything ahead of you. The marketplace is constantly moving and evolving, causing you and your business to adapt. This is where mentors can help, offering guidance drawn from experiences they had during similar changes in their own journeys.
My own mentors have changed as my career progressed, but they all had a common trait that served me and my businesses well — perspective. They have been able to see things clearly from a distance when my own vision may have been clouded by emotion, allowing me to make more-effective decisions. Entrepreneurship is about taking chances, but not blind ones.
Being an entrepreneur is a calling for those who not only cope well with risk, but thrive on the challenges it presents. Those who are satisfied by the comfort of a secure job and a steady paycheque need not apply. For the Silo, Paola Abate.


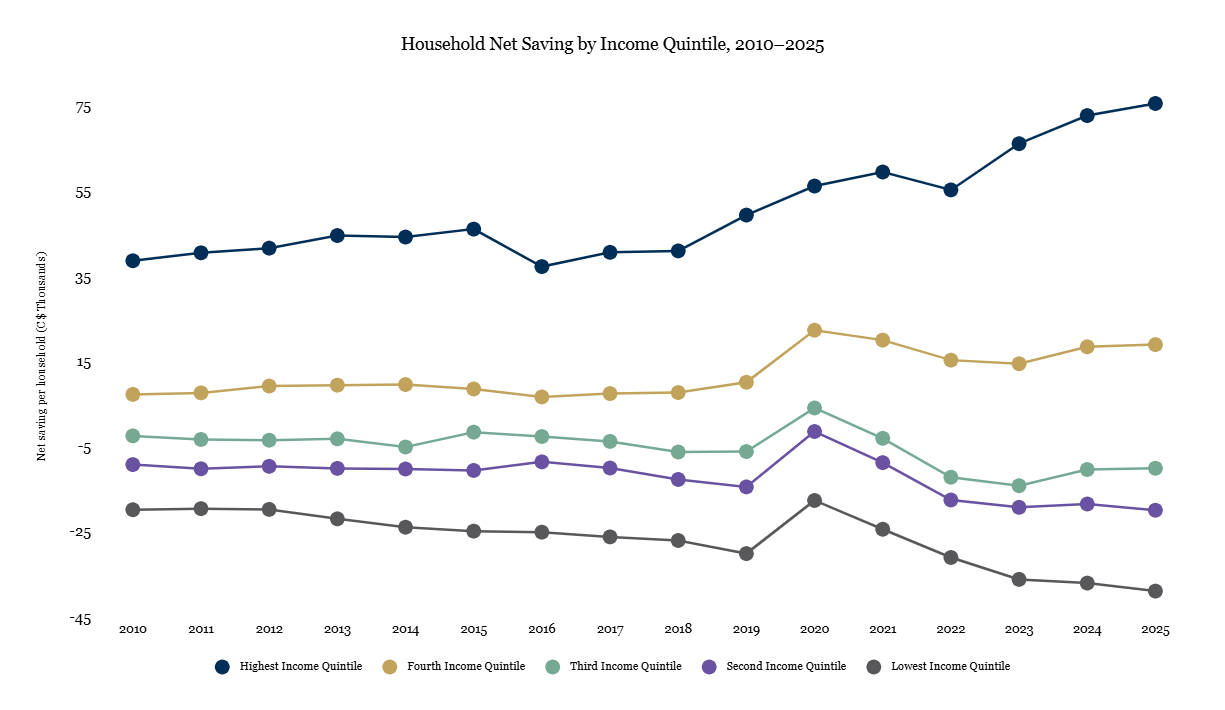


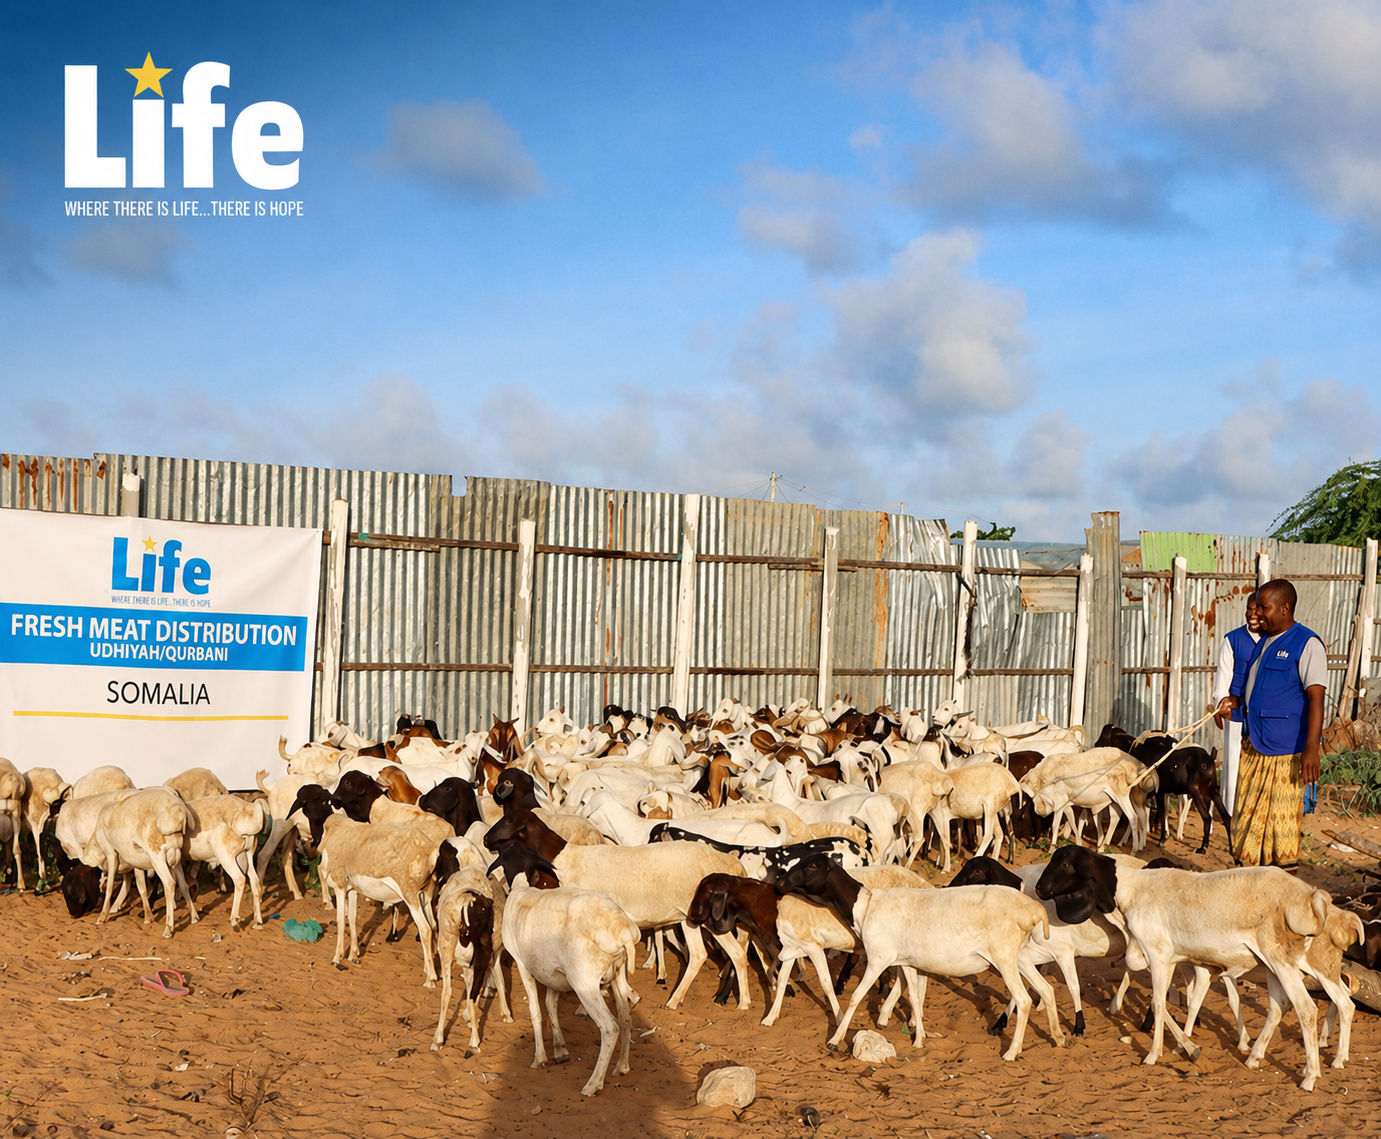

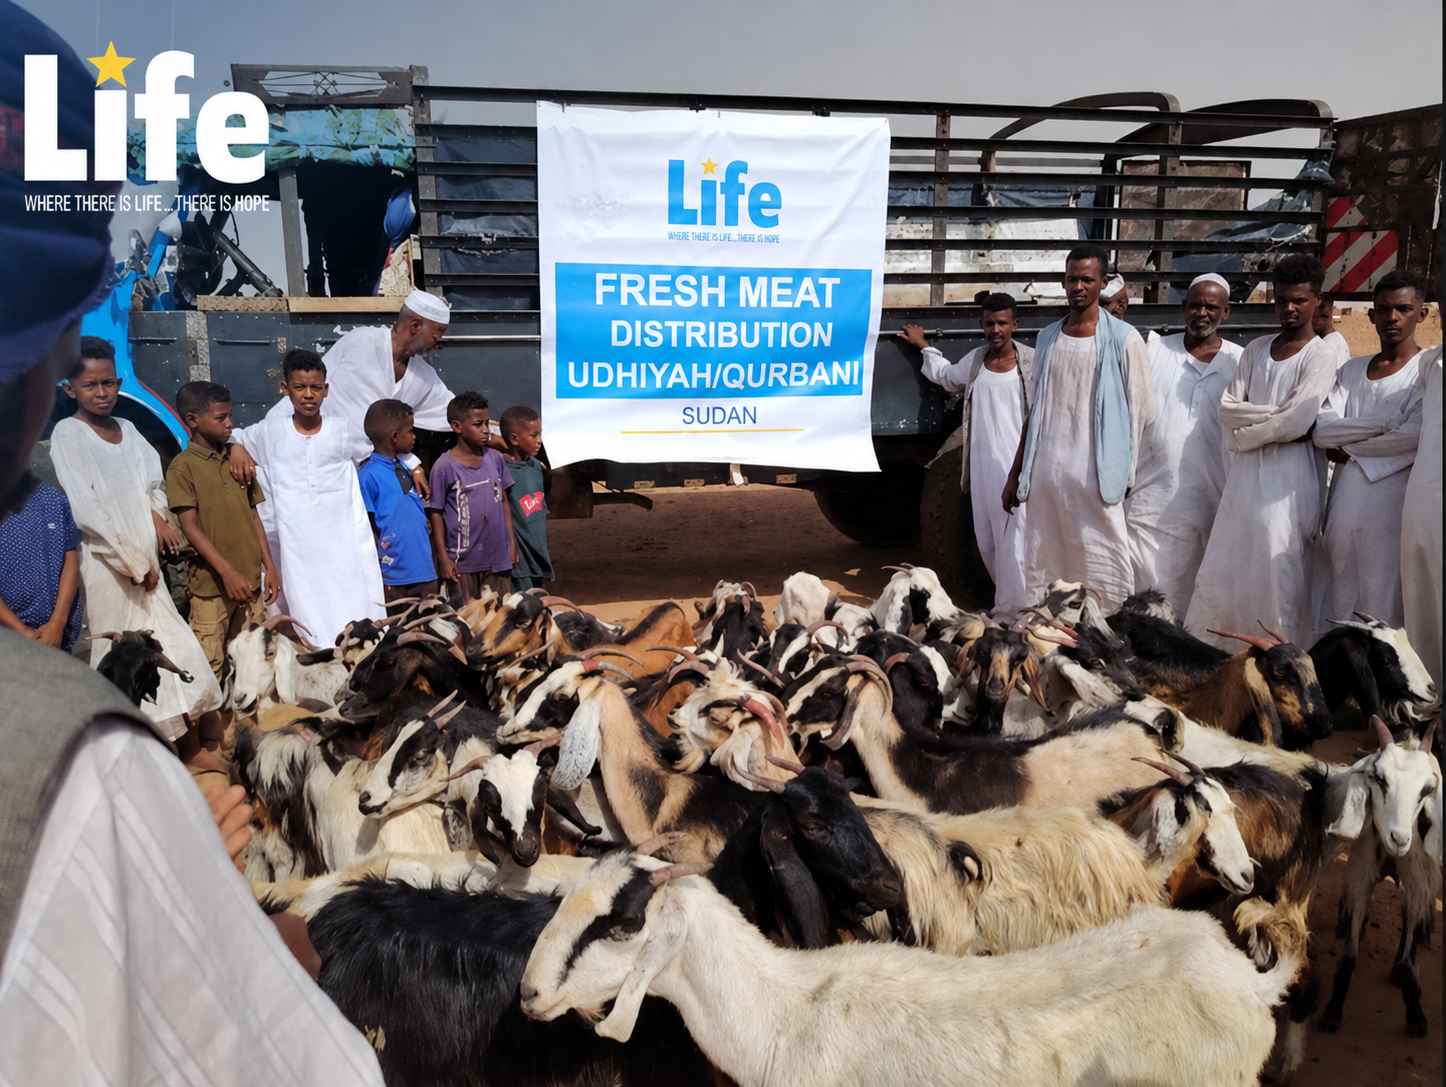


 Government projections understate the risks. Weak productivity, low business investment, and demographic pressures will hold back growth and revenues, while ageing, healthcare, and defence will push spending higher. Even modest changes in growth or interest rates could materially worsen the fiscal picture.
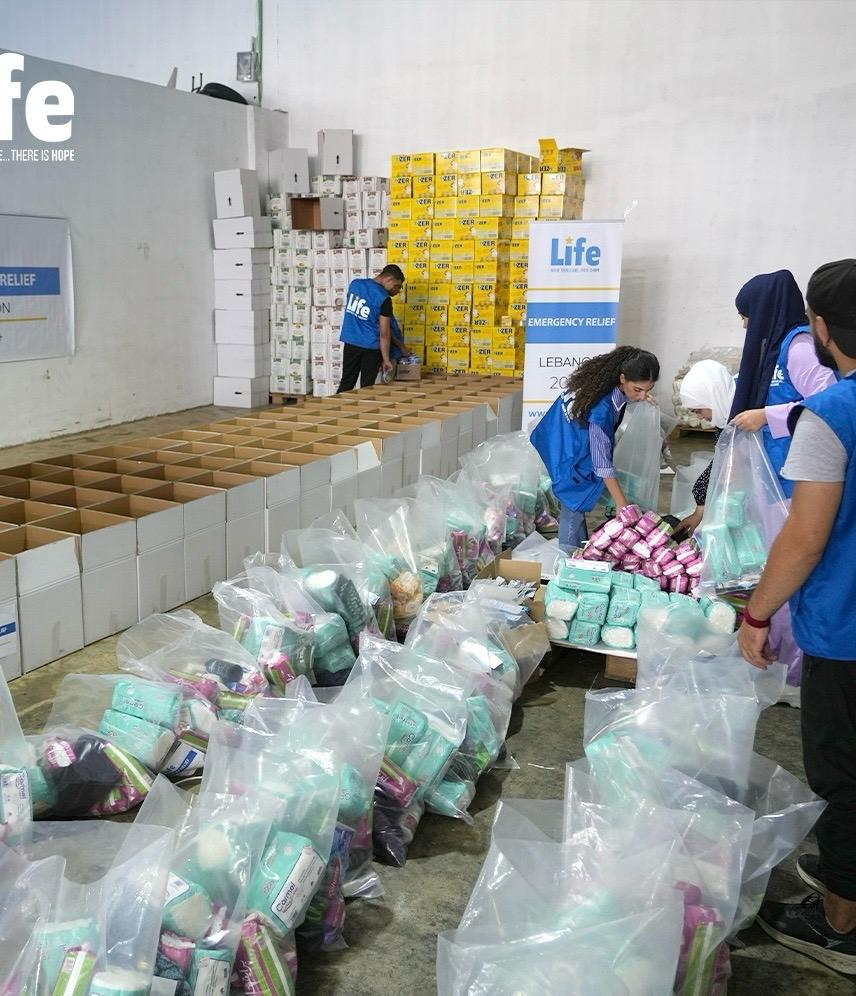


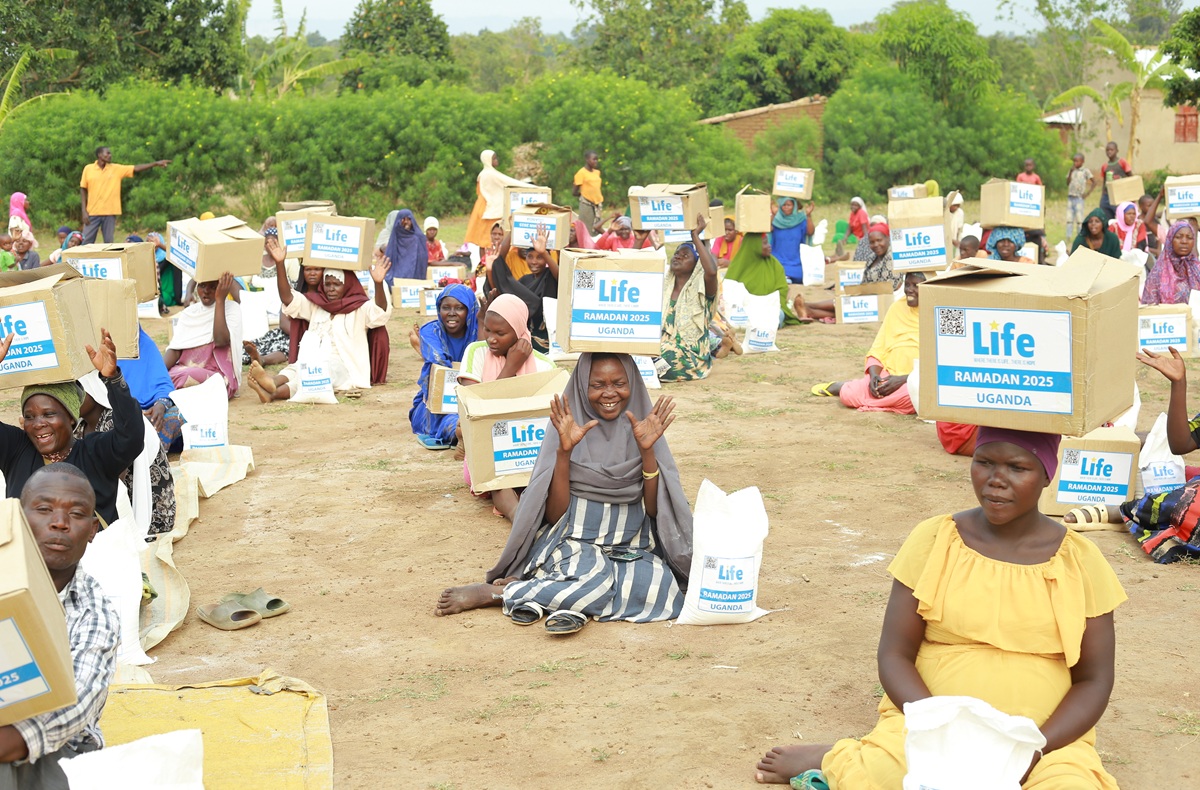


")