Your company’s marketing reports may say everything is working, but your revenue may tell a very different story. As businesses pour more money into SEO, paid media, social, PR, technology and AI, marketing and growth strategist Deborah Dodson warns that overlapping vendors, questionable ROI and feel-good metrics can allow underperforming investments to quietly drain substantial budgets. The article below identifies seven common marketing money traps and how businesses can separate activity from actual results to determine what’s truly generating customers and revenue.
The Marketing Accountability Gap Widens with More Spending Producing Less Clarity
Businesses have never had more ways to spend a marketing dollar, or more data supposedly proving those dollars are working. SEO agencies report rankings. Digital firms report clicks and conversions. Social teams measure engagement.
PR tracks visibility. Paid media produces attribution dashboards. Now companies are adding another layer as they race to optimize for AI-powered discovery.
Yet beneath all those metrics sits a surprisingly basic question: Which investments are actually generating qualified opportunities, customers and revenue? For many businesses, the answer is far less clear than the dashboards suggest.
Marketing and business growth strategist Deborah Dodson, founder and managing director of Strategic Alliance Marketing Group, sees a widening disconnect between marketing activity and business performance. With more than 20 years of experience spanning marketing, business development and growth strategy, Dodson works with organizations to scrutinize vendor performance, challenge recommendations and determine whether individual investments actually function as part of a coherent growth strategy.
“We’ve created an environment where nearly every marketing channel can produce numbers showing that it is working,” Dodson says. “The harder question is whether those numbers demonstrate that the business itself is benefiting.”
When Everything Is Working, What Is Actually Working?
The problem often develops gradually. A company hires an SEO agency. Later it adds paid advertising. Someone else takes over social media. PR operates independently. A new website launches. The company pays for directories, sponsorships, memberships and marketing technology. Eventually, what began as individual solutions becomes a sprawling marketing ecosystem in which multiple vendors have different objectives, reporting systems and definitions of success.
Dodson describes this as a kind of marketing stack creep. Businesses accumulate agencies, platforms, subscriptions and campaigns until it becomes difficult to see where responsibilities overlap, where money is being duplicated and whether all those activities still serve the company’s objectives.
“One agency reports that rankings are improving. Another points to clicks. Social media shows engagement. PR demonstrates visibility,” Dodson says. “Those can all be legitimate measures, but if nobody is looking across the entire operation and connecting those activities to business outcomes, you can end up with a lot of apparent success without knowing what is actually producing growth.”
That distinction is becoming increasingly important because activity is relatively easy to measure. Business impact is not. A campaign can increase traffic without improving the quality of prospects. Search rankings can rise without materially affecting revenue. Content production can increase without generating meaningful engagement. Multiple vendors can potentially claim influence over the same conversion. An impressive dashboard, in other words, does not necessarily mean an impressive return.
AI Is Making Attribution Even Messier
Artificial intelligence is adding urgency to the issue because it is changing where and how customers discover businesses. The customer journey was already fragmented. Now a prospect might encounter a company through Google, an AI-generated answer, LinkedIn, a map listing, online reviews, an industry directory, media coverage or another third-party source before ever visiting the company’s website.
According to Dodson, that does not mean traditional SEO is dead. It means businesses need a broader understanding of visibility. “SEO still matters, but discovery is no longer confined to a conventional search-results page,” she says. “Businesses need to think about the authority and credibility they are establishing across their entire digital footprint. The question isn’t simply, ‘Where do we rank?’ It’s increasingly, ‘Where are we being found, what does a prospective customer find when they encounter us, and does that visibility ultimately contribute to the business?'”
That encompasses websites and search performance, but also reviews, credible backlinks, media mentions, social presence, business profiles, directories and other signals that help establish authority across the web.
AI therefore presents businesses with a potential trap. In the rush to embrace the newest form of optimization, companies can simply add another vendor, platform or tactic to an already fragmented marketing operation.
Dodson believes the more useful question is not merely how much to spend on AI search optimization. It is whether the entire marketing budget needs to be reconsidered for an era in which discovery happens across so many different environments.
Seven Marketing Mistakes That Can Quietly Drain the Budget
According to Dodson, seven recurring mistakes deserve particular scrutiny because they can allow marketing spending to grow without a corresponding increase in meaningful business results.
1. Treating marketing as a collection of unrelated projects. Companies approve websites, advertising campaigns, SEO programs, social media initiatives and PR efforts independently, without a unified strategy connecting each investment to specific business objectives.
2. Paying multiple vendors for overlapping services. Agencies and consultants may duplicate work, pursue conflicting strategies or operate without understanding what other marketing partners are doing.
3. Mistaking activity for results. Rankings, impressions, clicks, followers and content volume can look impressive in a report while saying relatively little about qualified leads, sales opportunities or revenue.
4. Following an outdated SEO playbook. Search fundamentals remain important, but customers increasingly discover and evaluate businesses through AI search, maps, reviews, social platforms and third-party sources. Search strategy needs to reflect that broader reality.
5. Ignoring the broader digital footprint. A polished website cannot fully compensate for inconsistent business information, weak reviews, limited executive visibility or outdated profiles elsewhere online.
6. Buying visibility without questioning its value. Awards, directories, sponsorships, memberships and other paid opportunities can strengthen credibility when they reach the right audience. Others can become recurring expenses that survive year after year without anyone asking what they actually contribute.
7. Allowing vendors to grade their own work. When the company selling a marketing service also determines which metrics constitute success, Dodson cautions that an underperforming program can continue much longer than it otherwise might.
That final point exposes a larger accountability issue. “There is nothing inherently wrong with a vendor reporting its own performance. They should,” Dodson says. “But businesses also need an objective way to determine whether the metrics being reported are the metrics that matter to them. The measurement should follow the business objective, not the other way around.”
What If Every Marketing Expense Had to Earn Its Place Again?
One way to expose weak spots is to borrow a concept from zero-based budgeting and apply it to marketing. Instead of beginning with last year’s agencies, platforms, subscriptions, sponsorships and campaigns and deciding what to add, Dodson suggests periodically examining recurring expenditures as though they had to be approved again today.
Would the company still hire this vendor? Would it still purchase that directory listing? Does that platform serve a distinct purpose? Are two agencies performing overlapping functions? Is the organization measuring a channel because the metric matters, or simply because the platform makes it easy to report?
The exercise is not necessarily about cutting the marketing budget. “Sometimes the right answer is to spend less, but sometimes it is to spend more,” Dodson says. “And sometimes you don’t need to change the total budget at all. You need to move the money from something that isn’t contributing enough to something that has greater potential.”
That distinction is important. Dodson’s argument is not that SEO, advertising, PR, social media, directories or emerging AI strategies are inherently poor investments. Rather, marketing channels should not become permanent budget line items simply because they have always been there or because each can produce a favorable-looking performance report.
From More Marketing to Better Marketing
For marketers and business owners, the proliferation of channels creates an understandable temptation to be everywhere. Every new platform can look like an opportunity, and every emerging technology can create anxiety about being left behind.
But adding more activity to an already fragmented system can compound the very problem businesses are trying to solve. Dodson’s approach is to return to a simpler discipline: What is the business trying to accomplish? Who is it trying to reach? What role is each marketing investment supposed to play? How does it interact with everything else? And what evidence would demonstrate that it is succeeding?
Her underlying premise is that marketing does not necessarily need to do more. It needs to become more intentional, integrated and accountable. The goal is not a cleaner dashboard or another impressive metric. It is to make sure that the growing machinery surrounding modern marketing remains connected to the reason businesses invest in it in the first place: to produce meaningful business growth.
As marketing becomes more sophisticated, accountability has to become more sophisticated with it. The businesses that navigate this next era most effectively may not be those that adopt every new platform, metric or AI capability first, but those disciplined enough to continually question what each investment is accomplishing and whether it still deserves a place in the strategy. In a marketplace overflowing with ways to spend, knowing what not to fund may become just as valuable as knowing where to invest next.
How to avoid being hacked during this Fall’s travel season.
According to a recent study by our friends at the cybersecurity firm NordVPN, one in four travelers has been hacked when using public Wi-Fi while traveling abroad. However, unsecured Wi-Fi is not the only factor travelers should be worried about.
Last year, the FBI published a tweet (see below) warning users against smartphone charging stations in public places (airports, hotels, and shopping malls). Hackers may have modified the charging cables with the aim of installing malware on phones to perform an attack called juice jacking.
“Digital information, although it exists virtually, can also be stolen using physical devices. So it is important to take a 360-degree approach and secure your device from both online and offline threats,” says Adrianus Warmenhoven, a cybersecurity advisor.
What is juice jacking?
Juice jacking is a cyberattack where a public USB charging port is used to steal data or install malware on a device. Juice jacking attacks allow hackers to steal users’ passwords, credit card information, addresses, names, and other data. Attackers can also install malware to track keystrokes, show ads, or add devices to a botnet.
Is juice jacking detectable?
Juice jacking attacks can be difficult to detect. If your device has already been compromised, you may notice some suspicious activity – but that won’t always be the case.
For example, you may notice something you don’t recognize on your phone — like purchases you didn’t make or calls that look suspicious.
Your phone may also start working unusually slowly or feel hotter than usual. Chances are you may have picked up malware. For a full list of signs to watch out for read on and find out how to know if your phone is hacked.
How to protect yourself
Since no sign of juice jacking is 100% reliable, it is best to avoid falling victim to this attack by using the following the advice:
Get a power bank. Power banks are a safe and convenient way to charge your device on the go. Getting a portable power bank means that you’ll never have to use public charging stations where juice jacking attacks occur. Always ensure your power bank is fully charged so you can use it on the go.
Use a USB data blocker. A USB data blocker is a device that protects your phone from juice jacking when you’re using a public charging station. It plugs into the charging port on your phone and acts as a shield between the public charging station’s cord and your device.
Use a power socket instead. Juice jacking attacks only happen when you’re connected to a USB charger. If you absolutely need to charge your phone in public, avoid the risk of infected cables and USB ports and use a power outlet. This is typically a safe way to charge your mobile device and other devices in public.
Consumer Reports and the Insurance Institute for Highway Safety have released their newly updated 2026 rankings of the safest used vehicles for teen drivers, identifying dozens of models under $10,000 and $20,000 that deliver significantly better crash protection and safety technology without breaking the family budget. The report also reinforces a sobering reality: teen drivers have crash rates nearly four times higher than drivers age 20 and older, making vehicle choice one of the most important safety decisions parents will make.
Automotive retail analysts and car consumer advocates Ray and Zach Shefska help consumers go beyond the rankings, explaining which of Consumer Reports’ recommendations truly represent the best values in today’s used-car market, where buyers should negotiate aggressively, which popular models parents should avoid despite attractive prices, and how to determine whether spending a few thousand dollars more for advanced safety technologies like automatic emergency braking is actually worth it. They recommend that buyers always perform due deligence and research today’s used-car pricing, financing costs, depreciation trends, and try to understand how dealer tactics are affecting families shopping for a safe first vehicle.
Key Considerations For Parents Considering Buying are:
The safest used cars parents can buy for under $20,000 usd/ $27,740 cad (exchange rate at time of posting)
Why the cheapest used car often becomes the most expensive mistake
Hidden dealer markups and fees first-time buyers should avoid
Which safety features are non-negotiable for teen drivers
The best negotiation strategies in today’s used-car market
Whether buying new is beginning to make more financial sense than buying used
How to tell whether a used car is actually priced fairly before you buy
The online tools and data every used-car shopper should use before stepping into a dealership
The pricing data, VIN history, and market trends smart buyers use to avoid overpaying
Look online for a number of free resources that can help families compare used cars, spot bad deals, and negotiate with confidence
Top used cars for teens combine safety, affordability, and reliability, with models like the Mazda 3, Honda Civic, and Toyota Corolla leading the list.
Key Considerations for Teen Drivers
When choosing a used car for a teen, prioritize:
Safety: Look for vehicles with strong crash-test ratings and features like automatic emergency braking (AEB) and stability control caroutlay.com.
Affordability: Cars under $20,000 are ideal, with some safe options available for under $8,000 CarGurus+1.
Reliability: Low maintenance costs and proven durability help reduce long-term expenses.
Insurance Costs: Avoid high-horsepower or luxury models to keep premiums manageable caroutlay.com.
Top Recommended Used Cars
Mazda 3 (2014–2019)
Available in sedan and hatchback styles
Fun to drive with predictable handling
Top Safety Pick+ ratings from IIHS
Optional all-wheel drive for colder climates Edmunds+2
Honda Civic (2016–2021)
Sedan, hatchback, and coupe options
Reliable, fuel-efficient, and safe
Affordable with strong aftermarket support for customization
Excellent IIHS and Consumer Reports ratings MotorTrend
Toyota Corolla (2014–2019)
Known for reliability and low maintenance costs
Good crash-test scores and standard safety features
Practical for daily commuting and long-term ownership Edmunds
Subaru Impreza (2015–2019)
Standard all-wheel drive
Strong safety ratings and solid reliability
Available in sedan and hatchback versions, suitable for snowy regions Edmunds
Mini Countryman (2014–2017)
Compact SUV with good crash ratings
Affordable used options starting around $4,600
Offers a fun driving experience while remaining practical caroutlay.com
Budget-Friendly Options Under $8,000
For families on a tighter budget, consider:
Older Toyota Corolla or Honda Civic models
Mazda 3 from earlier model years
Minivans like the Honda Odyssey or Toyota Sienna, which are surprisingly safe and practical for teens CarGurus
Final Tips
Check vehicle history reports and maintenance records before purchase.
Prioritize moderate engine power to reduce accident risk and insurance costs.
Consider sedans or hatchbacks over coupes or sports cars for better safety and practicality.
Use online tools to estimate five-year ownership costs, including insurance, fuel, and maintenance caroutlay.com. By focusing on safety, reliability, and affordability, these used cars provide a balanced choice for teen drivers while keeping long-term costs manageable.
With decades of combined experience analyzing vehicle pricing, dealership practices, and consumer buying behavior, Ray and Zach Shefska translate complex automotive data into practical advice that helps families purchase safer vehicles while avoiding costly mistakes. Their insights complement Consumer Reports’ safety testing with real-world market expertise, giving buyers the information they need to make smarter, more confident purchasing decisions.
For the Silo, Marsha Zorn and Stephanie Fisher.
Who Are CarEdge?
CarEdge is a leading car consumer advocacy platform dedicated to empowering car shoppers to make confident, informed and financially savvy decisions. With trusted resources that includes AI agent shoppers, a Car Dealer Transparency Index, and hundreds of guides and videos on YouTube, CarEdge is redefining transparency, fairness and value in the automotive industry.
President Trump, who founded the U.S. Space Force in 2019, has announced plans for a U.S. Space Academy to train future leaders of America’s pioneering space missions.
Trump signed an executive order establishing the Space Academy last month during an August 28 ceremony at NASA’s Johnson Space Center in Houston.
“Given the rapid growth of the U.S. Space Force and commercial space industry, and the expansion of our ambitions to the moon and far beyond … it’s clear we will need to educate and train an entire generation of skilled service members, engineers, and civil operators,” the president said.
Space Is Critical To US
The order describes space as critical “for U.S. national security, economic growth, scientific discovery and technological innovation.”
During the August 28 ceremony, Trump also awarded the Congressional Space Medal of Honor to the crew of the Artemis II mission — NASA’s Christina Koch, Victor Glover and Reid Wiseman, and the Canadian Space Agency’s Jeremy Hansen. Their April flight around the moon set a record for the farthest humans have traveled from Earth.
President Trump presents an executive order establishing the U.S. Space Academy August 28 at Johnson Space Center in Houston. (NASA/John Kraus)
The only nation to land a man on the moon, the United States remains at the forefront of human space exploration. Through the Artemis program, established in Trump’s first term, NASA will return astronauts to the moon and pave the way for a moon base that will serve as a jumping-off point for future human spaceflight to Mars.
The president has prioritized America’s leading role in space exploration. He launched the Artemis Accords, a nonbinding set of principles to guide civil space exploration. Over 70 nations have signed onto the accords.
In August, Trump issued a Presidential Memorandum to reinvigorate U.S. leadership in space transportation , calling on federal agencies to promote space transportation capabilities and facilitate commercial transportation to the moon and Mars.
U.S. Space Force Brigadier General Matthew Holston swears new officers into the U.S. Space Force at the Pentagon. (U.S. Air Force/Technical Sergeant Michael Campbell)
NASA Administrator Jared Isaacman will lead a commission that will advise the president on creating the Space Academy, including degree programs, experiential training and service obligations for graduates. The academy will combine “rigorous technical education with leadership development, discipline, and a durable commitment to public service,” the order says.
A Transitional Step
Isaacman called plans for the Space Academy “a transformational step” for future NASA missions to return astronauts to the lunar surface, build a moon base and advance science and discovery. “I have no doubt that so much of the future talent that will graduate and contribute to these exciting endeavors will be educated at the United States Space Academy,” he said.
With a target mass of 300 kg, ALTA LUNA’s compact size gives it a high degree of manoeuvrability. The vehicle is also designed to offer particularly high obstacle-crossing capability.
ALTA LUNA is designed to operate in two modes: with an astronaut on board or autonomously. In autonomous mode, navigation will rely on a combination of LiDAR, stereo cameras and artificial intelligence. AI will also be able to assist the astronaut in driving the vehicle.
In autonomous mode, ALTA LUNA will be able to carry out operations including excavation, grading and terrain preparation, as well as site development and the creation of routes and basic infrastructure. It will also be able to transport payloads. Each vehicle will be able to operate alone or in coordination with other ALTA LUNA vehicles. For certain operations, several vehicles will therefore be able to work together on the same task, pooling their efforts.
With ALTA LUNA, Venturi Space is exploring a tracked mobility architecture for the first time as part of its lunar programmes. This choice has one specific objective: to allow the vehicle to climb steeper slopes than would be possible with a wheeled architecture.
ALTA LUNA will use the battery and battery management system (BMS) developed by Venturi Space. These two technologies are integrated into Venturi Astrolab’s CLV-1, which has been selected by NASA for the Artemis campaign.
Fifteen months after unveiling the MONA LUNA rover, and as the launch of FLIP to the lunar South Pole approaches (*), Venturi Space continues to strengthen its position in the space industry, just five years after its creation.
| Gildo Pastor, President of Venturi Space: “I enjoy designing vehicles for extreme environments, but above all I like to see them prove their value in real-world conditions. I will therefore devote all the necessary energy to ensuring that ALTA LUNA supports the first inhabitants of the Moon in their daily lives”
Dr. Antonio Delfino, Director of Venturi Space: “On the Moon, we will need to build, develop sites, transport, maintain and connect. We will face challenges similar to those of industrialisation on Earth: transport routes, habitats, infrastructure and logistics. This will require a range of specialised mobility solutions capable of operating as a fleet and carrying out a wide variety of missions. This is the new phase of lunar activity that we are preparing for”(*) Developed by the US company Venturi Astrolab, the FLIP rover is equipped with hyper-deformable wheels and high-performance batteries designed and manufactured by Venturi Space. Its launch aboard Astrobotic’s Griffin-1 lander is scheduled by the end of 2026, with the lunar South Pole as its destination. Venturi Space, a European company, is Venturi Astrolab’s strategic partner.
When Port Dover astronomer Michael Earl thought about how to celebrate the 50th anniversary of Sputnik, he did not know what he was in for. He decided that year- back in 2007, he would detect and track 1,957 individual satellites. He managed to detect 2,053 of them; nearly 100 over his initial goal.
The project did not stop there. Mr. Earl decided to continue to determine how many of our orbiting satellites could be detected using retail telescopes and research-grade digital cameras.
Michael Earl stands near his CASTOR facility in Port Dover. This equipment was used to detect and track over 4,000 of our orbiting satellites. Image by Michael A. Earl and Jane E. Yaeger.
Mr. Earl has seen some of our most prestigious satellites, including the International Space Station, the Space Shuttles, all of the GPS satellites, Telstar, NASA’s Chandra X-Ray Observatory and Canadian satellites Alouette, ISIS, Anik A1, CTS and Radarsat. He has spotted all of the satellites that all North American satellite TV subscribers point their dishes toward.
A decade ago, he spotted the famous Hubble Space Telescope only ten degrees above Port Dover’s southern horizon.
(see image) The Hubble Space Telescope (HST) was seen to travel across CASTOR’s field of view at 4:16 a.m. on July 5, 2011. The HST is traveling right to left in this image, which is actually comprised of five 5-second images. The HST’s reflected sunlight is seen as streaks as the satellite orbits the Earth during the exposures. The small dots are stars in the constellation of Grus (the crane). The large clumps at the bottom are foreground trees. Image by Michael A. Earl / CASTOR.
The furthest man-made object he has seen is an old Soviet-era x-ray observatory called Astron. It was 196,000km away at the time, or half way to the Moon.
At the present time, there are a total of 16,000 catalogued satellites that are tracked regularly by the United States military. Mr. Earl has detected over 4,000 (one quarter) of these to date. This includes two thirds of all payloads and three quarters of all rockets orbiting us right now.
He has compiled his findings into a unique satellite catalogue.
This is the first such catalogue to be compiled within Canada. He is also the first in the world to detect over 4,000 individual satellites single-handedly.
Mr. Earl hopes that his satellite catalogue will be used by amateur and professional astronomers to determine which satellites can be detected using their own unique equipment. The catalogue could be used as an initial point of reference for optical satellite tracking research initiatives all over the world.
The Iridium 67 communications satellite is seen to flare as it reflects sunlight back to the CASTOR camera. For much of its orbit, Iridium 67 is invisible to the naked eye however once in awhile its high gain antenna reflects most of the sunlight that hits it. We see this as an easily visible flare from Earth. CASTOR has detected all 98 Iridium satellites. The arrow denotes the satellite’s direction of travel. The small dots are stars. The number next to the satellite denotes the NORAD satellite catalogue number. The compass at the upper left corner denotes the orientation of the image. The numbers at the bottom denote the time, date and exposure time of the image. Image by Michael A. Earl / CASTOR.
Today, astronomy can be used for much more than observing stars, nebulae and galaxies.
The science can also be used to observe and track our most important assets in space and motivate others to develop new satellite tracking initiatives.
The following excerpts from the Fourth meeting of the C.D. Howe Institute’s Health Sector Economic Growth and Resilience Working Group
Meeting Overview
The C.D. Howe Institute’s Health Sector Economic Growth and Resilience Working Group met for its fourth session on June 23, 2026, to examine the adoption, oversight, and commercialization of artificial intelligence (AI) in Canada’s healthcare system. The meeting featured presentations from Shelley Spence, Auditor General of Ontario; Krista Balenko, Canada Health Infoway; and Gavin Tong, Accenture, followed by an open discussion among the group.
The panel examined a specific and rapidly scaling use case – AI-generated clinical documentation, or “AI scribes” – alongside the broader international policy environment that will determine whether this early point solution matures into a durable Canadian AI commercialization pathway. The meeting took place on the same day as a federal-provincial announcement extending investment in shared clinical data infrastructure to additional provinces,1 which several participants cited as further evidence of growing momentum for AI in Canadian healthcare. They also acknowledged that public trust has not kept pace with adoption.
Participants broadly agreed that AI scribes have moved from pilot to meaningful scale faster, and with a more positive clinician reception than most had expected. At the same time, an independent audit presented at the meeting identified accuracy and governance gaps in the initial procurement of these tools, highlighting that oversight has not always kept pace with adoption. The discussion that followed centred on how Canada can safely accelerate the broader commercialization of healthcare AI, given a policy and procurement environment that most participants agreed remains fragmented relative to international peers.
Auditing Ontario’s First Wave of AI Adoption
Shelley Spence, Auditor General of Ontario
Shelley Spence presented findings from a recent audit of AI use across the Ontario Public Service (OPS), undertaken following the Ontario government’s 2024 AI strategy. The audit covered AI governance and oversight, the responsible and secure use of AI tools, and the procurement and evaluation of vendor-of-record AI systems. It included a specific deep dive into AI scribe systems used in healthcare and a separate facial-recognition-based document verification service.
At an OPS-wide level, the audit found that staff could access unsanctioned and unsecured AI tools from government-issued devices: approved AI tools were used at a rate of roughly 6 percent, against a 94 percent usage rate for non-approved generative AI websites, and only about 3 percent of staff had completed AI training as of August 2025.2
In the case of AI scribes, Supply Ontario procured the tools through a vendor-of-record model and made them available to physicians, nurse practitioners, therapists, and other clinicians.3 The audit found that security, accuracy, and bias-related criteria carried limited weight in vendor evaluation and that the process relied heavily on vendors’ own claims rather than independent verification, with no requirement for live product demonstrations.
Subsequent testing by clinical and technical staff from Ontario Health and the provincial Ministry of Health found that all 20 evaluated vendors exhibited at least one identified issue. More than half included incorrect medical information (including misidentified medications), 45 percent exhibited instances of “hallucinations” (fabricated content), and 30 percent had incomplete documentation or omissions. While these results are potentially concerning, participants noted that AI tools and their underlying algorithms are evolving rapidly and that the findings apply to tools available and in use through summer 2025. This rapid evolution also means that data security, output accuracy, and potential biases can change over time, requiring regular evaluation to ensure appropriate public sector use.4
The Auditor’s report recommendations focus on strengthening procurement discipline and improving policies and protocols for AI use within the public service, rather than curbing adoption. They include giving greater weight to security, privacy, and bias criteria in vendor scoring; requiring independent assessment of vendor security documentation rather than relying on vendor attestations; mandating live product demonstrations; requiring formal bias testing; and requiring clinicians to confirm they have reviewed AI-generated notes before those notes are finalized in the patient record. The Auditor General’s office follows up on recommendations after two and five years to track progress, and the government stated that they had already acted on some recommendations from this audit.
Scaling AI Scribes Nationally
Krista Balenko, Canada Health Infoway
Krista Balenko described a national initiative intended to provide up to 10,000 primary care clinicians with a 12-month funded AI scribe licence drawn from a list of pre-qualified vendors, targeting reach to roughly 20 percent of the primary care market. The program was built collaboratively at a national level, drawing on Ontario’s early vendor-of-record work as well as parallel efforts already underway in British Columbia and Nova Scotia. A national external advisory group set core clinical, business, privacy, and security requirements and participated in vendor testing and live demonstrations, an approach designed to avoid duplicating the same procurement and evaluation work in every jurisdiction. Registration was straightforward, directing all clinicians to a common landing page where they could select their region. From there, most jurisdictions opened access to any pre-qualified vendor, while Nova Scotia opted to deploy a single vendor province-wide. All regions were supported by common adoption resources such as readiness checklists, privacy guidance, and templates.
Demand exceeded expectations. More than 6,000 providers registered within two days of launch and more than 10,000 within two weeks, prompting several jurisdictions to close registration once notional allocations were reached. Balenko reported that the program has since supported more than 11.5 million patient encounters, at an average of roughly 1.2 million encounters per month – a volume that a large comparable US health system reportedly took some 15 months to reach with a similar enrolled user base.
An independent evaluation found strongly positive results across most direct measures: roughly 90 percent of clinicians rated the tool as valuable to their practice, about 80 percent reported a significant reduction in cognitive load, close to 70 percent reported reduced administrative burden, and about 80 percent reported feeling more engaged with patients (Centre for Digital Health Evaluation 2026). Roughly three-quarters of clinicians reported time savings. Of that group, about half redirected the time to completing other administrative or clinical tasks and roughly a fifth used it to see and/or take on more patients. Balenko cautioned that benefits are not uniform: the specific value delivered depends on the clinician, the appointment type, and the patient context.
Looking ahead, Balenko noted that clinicians increasingly view AI scribes as an entry point into a broader ecosystem of AI-enabled tools, including pre- and post-visit summaries, automated form completion and billing support, and clinical co-pilot functionality, several of which vendors are already layering onto existing products. In her assessment, the main policy question is how quickly AI scribes can be scaled responsibly – and under what governance and data-access arrangements.
Canada’s Commercialization Gap: An International Comparison
Gavin Tong, Accenture
Gavin Tong focused on the international economic policy environment shaping AI use cases in healthcare, particularly “front office” applications such as those involving personal health information and directly touching patient care, as distinct from valuable but less contentious “back office” applications. He described a broadly common two-part policy challenge facing every jurisdiction. The first is regulatory friction, including medical device certification, AI-specific regulatory regimes, and data privacy requirements. The second is creating commercialization pathways that convert regulatory approval into a viable, reimbursable route to market – historically a long and uncertain process for novel health technologies.
Tong described three distinct approaches that have been deployed across different jurisdictions. England has established a regulatory sandbox called the “AI Airlock,” allowing regulators and companies to jointly iterate on safe deployment controls for continuously learning AI medical-device products. Qualifying products move into a provisional clinical use and real-world monitoring phase before entering a national AI procurement framework, with current use cases concentrated in areas such as imaging triage, cardiac diagnostics, and dermatology (Medicines and Healthcare products Regulatory Agency 2026). Germany and France, by contrast, have focused on giving developers a clear route from regulatory approval to a “digital therapeutic” pathway that can be prescribed, with automatic access to national insurance coverage, applied particularly to mental health applications and combined patient-facing device and app products. Singapore offers a highly integrated model. It has placed AI at the centre of national economic policy since 2023, using a live national clinical dataset and sustained biotech investment to position itself as a launch pad from which private companies can scale innovations across the wider Asia-Pacific market.
Against this backdrop, Tong argued that Canada holds many of the underlying ingredients for success: strong AI research, rich longitudinal health data, a receptive and well-educated workforce, and an early proof point in AI scribes. Canada’s challenge is that it lacks the commercialization architecture to leverage these foundational assets into rapid commercialization, adoption, and scale. Even if Canada achieves a more unified national approach to regulation, he suggested, commercialization is likely to remain fragmented across 13 separate provincial and territorial procurement processes. Healthcare also has historically had a risk-averse purchasing culture and a reluctance to be a first customer for novel technology, meaning many companies launch their products and capture value abroad before entering the Canadian market.
The presentation also raised concerns about AI-driven workforce displacement across both blue- and white-collar occupations and the well-documented health consequences of concentrated unemployment, particularly among younger workers, as a longer-term risk that merits attention alongside the immediate commercialization of AI tools. Future adoption patterns and applications of new AI tools remain uncertain. Given workforce and access challenges in healthcare, improving the efficiency of healthcare delivery will become increasingly important, alongside monitoring AI’s broader and evolving economic and health impacts.
Policy Discussion
Opening the discussion, the moderator summarized the tension raised across the three presentations: a point solution – AI scribes – that has already achieved wide and enthusiastic clinician uptake despite documented imperfections in how it was first procured, set against a more uncertain outlook on Canada’s broader capacity to commercialize healthcare AI. The group was asked how to create room to accelerate commercialization while maintaining accuracy, security, and bias safeguards, and whether Canada’s best path is to learn from international leaders, even at the cost of being a “second or third mover,” or to pursue a made-in-Canada sandbox and national procurement model.
Several participants argued that Canada should embed AI directly in its own regulatory processes, rather than only regulating AI as a product, pointing to international examples where AI-assisted application review has replaced slower, correspondence-based bureaucratic processes to shorten approval timelines without weakening oversight. This was linked to a recurring and largely undisputed observation: participants repeatedly identified the fragmentation of healthcare procurement and regulatory authority across 13 provincial and territorial jurisdictions as the primary structural obstacle to scaling AI commercialization in Canada, in contrast to the single national markets of peer jurisdictions such as Germany and France. While this structure is constitutional, provinces can still cooperate to make the Canadian market more attractive by harmonizing regulatory and procurement policies and processes.
One participant drew a direct comparison to Canada’s national shipbuilding strategy, in which a single centralized federal buyer aligns procurement with domestic economic development goals, and asked how a similar alignment mechanism might be built across health technology purchasing – including a “buy Canada” dimension – given the absence of an equivalent central decision-maker in healthcare. Another participant cautioned against treating this purely as a procurement design problem, noting that jurisdictional fragmentation reflects broader structural features of Canadian health federalism that a procurement fix alone would not resolve. The group did not fully reconcile these two framings.
A further international example was offered as a model for policy learning rather than pure imitation: Germany and France’s collegial “leapfrogging” on digital therapeutics reimbursement frameworks. Germany’s early rollout identified a gap in clinician and patient training that France subsequently addressed in its own framework, with the two countries openly exchanging implementation lessons.
On the regulatory classification of clinical AI tools, one participant noted that AI scribes generally sit outside Health Canada’s medical device framework, unlike more clinically substantive diagnostic or decision-support AI applications, though guidance specific to generative and higher-risk AI tools continues to develop. The central challenge, in this view, is calibrating oversight to a tool’s genuine clinical risk and value so that governance does not simply add to clinician burden. The participant also suggested exploring national procurement principles that could sit alongside continued provincial responsibility for funding and administration, rather than requiring a full redesign of health system financing.
Echoing this, another participant – drawing on work developing a “patient charter” through a co-design process – suggested that Canada’s governance toolkit of legislation, policy, and programmatic guidance is not yet clearly organized to distinguish between areas where absolute certainty is required and those where flexibility should be preserved while the technology and public confidence in it continue to evolve.
The discussion closed with a participant cautioning that while AI tools, including scribes, offer clear benefits, public and clinician trust remains uneven. The participant cited an example in which a physician declined to see a patient who had asked that an AI scribe not be used, illustrating a live tension around patient choice and informed consent that adoption figures alone do not capture. These tensions must be balanced with reported clinician-side gains, including several hours of weekly time savings and more face-to-face time with patients. Participants broadly agreed that healthcare AI remains a moving target for regulatory policy and procurement-stage product validation and, at least for now, requires human validation and verification.
Policy Conclusions
There was clear consensus that AI scribes have demonstrated clinician demand and delivered measurable value in clinical practice. Participants generally viewed the risk of under-investing in healthcare AI, given capacity and access challenges, as greater than the risks of broader adoption, provided accuracy, bias, and security safeguards keep pace with deployment. Participants likewise agreed that human review remains a necessary safeguard against the documented error rates in current AI scribe products, and that Canada’s fragmented procurement and regulatory landscape across 13 provincial and territorial jurisdictions is the principal structural barrier standing between early wins in AI adoption and a durable Canadian AI commercialization advantage. Canada Health Infoway’s recent AI Scribe Program demonstrated that a successful and scalable national procurement and coordinated deployment process is possible, offering a potential model for other products.
Genuine uncertainty remains in several areas. Participants could not say with confidence how much AI use is already occurring outside sanctioned or governed channels, noting that this kind of activity is inherently difficult to observe or quantify. There was similar uncertainty about whether Canada can build a coordinated national approach to regulation and procurement quickly enough to keep pace with faster-moving peer jurisdictions, or whether a province-by-province default will persist. Multiple participants noted that the pace, scale, and distributional impact of AI-driven workforce displacement will need to be monitored, along with associated effects on population welfare and healthcare needs.
There was some debate about Canada’s ideal adoption and regulatory strategy. Some participants favoured a deliberate “fast follower” posture, learning from international leaders such as England, Germany, France, and Singapore. Others argued that this posture risks entrenching the very lag participants identified as Canada’s central weakness and favoured a more assertive domestic approach combining a Canadian regulatory sandbox with coordinated national procurement. Participants also differed on whether persistent 13-jurisdiction fragmentation could be addressed through a centralized buying model akin to national defence procurement, or as a symptom of deeper structural features of Canadian health federalism that procurement reform alone cannot resolve. Overall, participants agreed that regulatory modernization is a necessary companion to continued AI scribe scale-up, and a precondition for translating Canada’s research and data advantages into a genuine commercialization pathway.
Participants of the C.D. Howe Institute Health Sector Economic Growth and Resilience Working Group
Individuals participate in their personal capacities, and the views collectively expressed do not represent those of any individual, institution, or client.
Co-Chairs:
Helen Angus, CEO, AMS Healthcare
Tony DiEmanuele, President and CEO, Mohawk Medbuy Corp. (session chaired by Peter Longo, COO, Mohawk Medbuy Corp., in Mr. DiEmanuele’s absence).
Presenters:
Shelley Spence, Auditor General, Office of the Auditor General of Ontario
Krista Balenko, Vice President, Enablement and Operations, Canada Health Infoway
Gavin Tong, Canadian Health Industry Data and AI Lead, Accenture
Participants:
Neala Barton, VP, Communications and Client Experience, Canadian Institute for Health Information
Brigid Buckingham, Director of Government Affairs and Policy, GE Healthcare
Barbara Carnegie, Vice President, Healthcare and Group Benefits, Canadian Life and Health Insurance Association
Nathan Clark, Director, Government Relations, Manulife
Donna Duncan, CEO, Ontario Long Term Care Association
Jonathan Feairs, Head, Government Affairs and Enterprise Policy, AstraZeneca Canada
Cathy Hecimovich, CEO, Ontario Retirement Communities Association
Jim Keon, President, Canadian Generic Pharmaceutical Association
Geneviève Lavertu, Government Affairs and Policy, Johnson & Johnson Canada
Richard Lech, Senior Manager, Market Access, Edwards Lifesciences
Leslie Madden, Head of Government Affairs and Policy, Moderna
Chad Mitchell, Senior Association, Global Public Affairs
Janice Mundell, Chief Marketing Officer and SVP of Business Intelligence and PMO, Mohawk Medbuy Corporation
Christian Ouellet, VP Corporate Affairs, Sandoz Canada
Paul Petrelli, Vice President and General Manager, Gilead Sciences Canada
Joanne Pitkin, Vice President of Government and Public Affairs, GreenShield Canada
Ramesh Ranjan, Lead, Official Engagement, Canadian Blood Services
Nissa Shariff, Partner, Health, Government and Public Sector, PricewaterCoopers LLP
Lori Shortill, Sales Excellence Leader, Philips
Dan Singh, Director, Strategy and Innovation, Canada’s Drug Agency (on behalf of Suzanne McGurn, CEO)
Michelle Theroux, Partner, Life Sciences & Healthcare, Deloitte
An informative 6 MINUTE READ via our friends at Share America.
August, 2026- Today, undergoing surgery is less risky than it was a generation ago. U.S. advances in medical robotics are dramatically improving surgical precision, enabling minimally invasive procedures that reduce complication rates and patient recovery times.
What Is Precision Medicine?
Combining artificial intelligence with medical robotics is further aiding the shift toward precision medicine. With AI-enhanced robotics tools, doctors are diagnosing diseases earlier and tailoring treatments to their patients’ genetics. These medical advances require a secure flow of critical minerals to make the semiconductors and microchips that power new tools.
Through the Pax Silica initiative, the U.S. State Department works with international partners to secure supply chains and enable continued technological progress and mutual prosperity amid the AI revolution. Pax Silica priorities include working with partners to prevent advanced technologies designed for healthcare from being misused. The State Department is also piloting a “concierge” service to streamline partners’ access to American-made AI products.
Here are several surgical robotics tools developed in the U.S. that are benefiting patients around the world.
California-based Intuitive Surgical Incorporated’s da Vinci robotic surgical system has been used in 20 million procedures since its launch in 2000. Updated models bring surgeons greater control, enabling operations through smaller incisions. The da Vinci 5’s AI tools help surgeons feel resistance and tension, so they can moderate force, reducing trauma. Plus, the system provides real-time data analysis during surgery.
The da Vinci 5 “has changed how I take care of patients,” says Dr. Marc Bailey , a cardiothoracic surgeon at St. Joseph’s/Candler Hospital in Savannah, Georgia. “Robotic surgery has always allowed for smaller incisions and less blood loss, and we can get you walking around faster, with less pain.”
The Miniaturized In Vivo Robotic Assistant MIRA™ Surgical System is designed to expand access to robotic surgery, according to the Virtual Incision Corporation based in Lincoln, Nebraska. Used in intestinal and other surgeries, MIRA is lightweight (2 pounds, less than 1 kilogram), allowing hospitals to move the device between operating rooms, reducing lengthy setup times.
Virtual Incision says future uses of MIRA will incorporate AI to inform decision-making and enable remote surgeries. In 2024, Virtual Incision and NASA tested the device’s remote-surgery capabilities at the International Space Station using data sent by satellite.
NASA astronaut Loral O’Hara displays Virtual Incision’s robotic-assisted surgery system aboard the International Space Station in February 2024. (NASA)
Early detection, better outcomes
Intuitive’s Ion robotic bronchoscopy system assists with minimally invasive lung biopsies that can detect early-stage cancers, improving patient outcomes. The robotic-assisted tool, initially released in 2019, added AI-powered navigation and rerouting capability in 2025 that can anticipate how a lung nodule may shift over time.
Ion’s AI-powered detection tools compare live images against the surgical plan, acting like a GPS navigation system that allows doctors to alter the course of surgery as needed. As of June 2025, there were 900 Ion systems at hospitals across 10 countries.
Real-time data, safer procedures
The Mako robotic arm, designed by the Michigan-based Stryker corporation, uses AI technology to assist doctors performing knee and hip replacement surgeries. Mako’s patient-specific, preoperative planning and feedback help surgeons adhere to preoperation plans, while other data analysis protects healthy bone.
The device also enables precise alignment of artificial knees and hips to improve joint stability and extend the lifespan of implants.
Plastics that break down into particles as tiny as our DNA—small enough to be absorbed through our skin—are released into our environment at a rate of 82 million metric tons a year. These plastics, and the mix of chemicals they are made with, are now major contributors to disease, affecting the risk of afflictions ranging from cancer to hormonal issues.
Plastic pollution threatens everything from sea animals to human beings, a problem scientists, activists, business groups, and politicians are debating as they draft a global treaty to end plastic pollution. These negotiations have only highlighted the complexity of a threat that seems to pit economic growth and jobs against catastrophic damage to people and the planet.
Rapid growth in plastics didn’t begin until the 1950s, and since then, annual production has increased nearly 230-fold, according to two data sets processed by Our World in Data. More than 20 percent of plastic waste is mismanaged—ending up in our air, water, and soil.
Inescapable Problem
While plastic doesn’t biodegrade—at least not in a reasonable time frame—it does break down into ever smaller particles. We may no longer see it, but plastic constantly accumulates in our environment. These microscopic bits, known as microplastics and nanoplastics, can enter our bodies through what we eat, drink, and breathe.
Microplastics measure five millimeters or less. Nanoplastics are an invisible fraction of that size, down to one billionth of a meter or around the size of DNA.
While microplastics can be as small as a hair, they remain visible. Nanoplastics, however, are impossible to see without a microscope. (Illustration by The Epoch Times, Shutterstock)
Plastic pollution is a chemical remnant of petroleum with other chemicals added in to change the durability, elasticity, and color. PlastChem Project has cataloged more than 16,000 chemicals—4,200 considered highly hazardous, according to the initiative’s report issued in March.
The astounding level and types of plastics, many with unknown health effects, should be a wakeup call for everyone, says Erin Smith, vice president and head of plastic waste and business at the World Wildlife Fund (WWF).
“Plastic pollution is absolutely everywhere,” she said. “What’s hard right now is the body of science, trying to understand what the presence of plastic inside us means from a human health perspective, is still new.”
Ms. Smith said we may be waiting for the science to reveal the full scope of plastic’s biological effects, but one thing is certain: “We know it’s not good.”
Reproductive and Neurological Issues
Newer human health studies have shown plastic has far-reaching effects.
“The research is clear: Plastics cause disease, disability, and death. They cause premature birth, low birth weight, and stillbirth as well as leukemia, lymphoma, brain cancer, liver cancer, heart disease and stroke. Infants, children, pregnant women, and plastics workers are the people at greatest risk of these harms. These diseases result in annual economic costs of $1.2 trillion,” said Dr. Phil Landrigan, pediatrician and environmental health expert, in a Beyond Plastics news release in March.
Beyond Plastics, an advocacy group for policy change, warns that new research indicates plastic could be leading to an increased risk of heart disease, stroke, and death.
Successive studies have found microscopic plastic particles affect every system of our bodies and at every age.
Nearly 3,600 studies indexed by the Minderoo Foundation have detailed the effects of polymers and additives like plasticizers, flame retardants, bisphenols, and per- and polyfluoroalkyl substances. The vast majority of studies indicate plastics affect endocrine and metabolic function, the reproductive system, and contribute to mental, behavioral, and neurodevelopment issues.
One study published in Environmental Science & Technology looked at plastic food packaging from five countries and found hormone-disrupting chemicals were common.
“The prevalence of estrogenic compounds in plastics raises health concerns due to their potential to disrupt the endocrine system, which can, among others, result in developmental and reproductive issues, and an elevated risk of hormone-related cancers, such as breast and prostate cancer,” the authors noted.
Data mapped by Our World in Data shows national rates of per capita plastic pollution to the oceans. North American individuals add about .01 kilograms (10 grams) of plastic waste to the world’s oceans each year. At 336,500,000 people today, that amounts to 3,311 tons or 7,418,555 pounds. (The Epoch Times)
The full scope of these chemical consequences is far from known. According to Minderoo, less than 30 percent of more than 1,500 plastics chemicals have been investigated for human health impacts. That includes the “substitution” chemicals used to replace additives that were restricted after being found problematic.
“All new plastic chemicals should be tested for safety before being introduced in consumer products, with ongoing post-introduction monitoring of their levels in human biospecimens and evaluation of health effects throughout the lives of individuals and across generations,” said professor Sarah Dunlop, Minderoo Foundation’s head of plastics and human health.
Absorbed Into Arteries and Skin
The relatively recent discovery that plastic particles can make their way into the human body through multiple methods has come with other unsetting insights. Microplastics and nanoplastics in human artery wall plaque were recently linked to a 350 percent increased risk of heart attack, stroke, and death.
Plastic pollution comes in all forms, from packaging and waste that clogs the Buckingham Canal in Chennai, India to plastic pellets from petrochemical companies that litter the ground in Ecaussinnes, Belgium. (R. SATISH BABU, Kenzo TRIBOUILLARD / AFP via Getty Images)
Published in the New England Journal of Medicine, a study followed 257 patients over 34 months. Among those involved in the study, 58.4 percent had polyethylene in carotid artery plaque and 12.1 percent had polyvinyl chloride.
Polyethylene is the most common plastic found in bottles and bags, including cereal box liners. Polyvinyl chloride, better known as PVC, is another common plastic, often used in medical and construction materials.
Besides finding entry through ingestion, polymers can also make their way into the bloodstream through our skin, according to another study published in Environment International. The findings, based on a human skin equivalent model, add to evidence that suggests that as plastics break down, it may be impossible for us to avoid absorbing them. Microscopic plastic has been found in our soil, water supply, air, and arctic ice.
Sweaty skin was found to be especially prone to absorbing the particles.
Once inside the body, plastic can mimic hormones, collect in arteries, and contribute to one of the most common disease pathologies today—an imbalance of free radicals and antioxidants known as oxidative stress.
Dr. Bradley Bale, a heart attack and stroke prevention specialist and co-author of “Beat The Heart Attack Gene,” says there’s plenty of evidence that plastic is causing oxidative stress.
“Plastics are ubiquitous on planet Earth,” Dr. Bale said. “You’re crazy to think you can eliminate your exposure to that. It would be next to impossible. But we can look at other issues that cause oxidative stress.”
Data processed by our Our World in Data shows the increase in plastic production in metric tonnes. (Illustration by The Epoch Times, Shutterstock)
Those other issues, including poor diet and other toxic exposures, may be resolved through lifestyle approaches, supplements, or avoidance.
Dr. Bale suspects future nanoplastics research will reveal a relationship between plastics exposure and early death, dementia, cancer, diabetes, and any disease impacted by oxidative stress.
How to Stop the Plastic Onslaught
Since cleaning up plastic is nearly impossible once it breaks down, advocacy groups are pushing for legislation that would reduce single-use products such as food wrappers, bottles, takeout containers, and bags—some of the most prolific and problematic plastics.
The United Nations Environment Programme, a global environmental decision-making body with representatives from all UN member states, decided in March 2022 that the plastics issue needed a coordinated response. It committed to fast-tracking a treaty meant to address the world’s growing plastic problem.
(Left) The secretariat of the Intergovernmental Negotiating Committee (INC) to Develop an International Legally Binding Instrument on Plastic Pollution consults on the dais during the closing plenary in Ottawa on April 30, 2024; (Center) Members of Greenpeace holds up placards during the discussions in Ottawa, Canada, on April 23, 2024.; (Right) Pro-plastic messaging was seen at hotels in Ottawa during the UN INC meetings. (IISD-ENB/Kiara Worth, DAVE CHAN/AFP via Getty Images)
Meanwhile, U.S. lawmakers are on a third attempt to gain Congressional consideration of the Break Free From Plastic Pollution Act. First introduced in 2020, it remains still unpassed in 2026. Among the act’s proposals are reducing and banning some single-use plastics, creating grants for reusable and refillable products, requiring corporations to take responsibility for plastic pollution, and temporarily banning new plastic facilities until protections are established.
The Economics of Plastics
Plastics are important for many businesses and the plastics industry itself is significant and influential. However, plastics aren’t as profitable as one may expect. New plastic facilities often get subsidies and tax breaks that make plastics artificially cheap to produce. These financial supports have increased substantially in the past three years.
In addition to direct fossil fuel subsidies, the plastics and petrochemical industries benefit from grants, tax breaks, and incentives. Because of a lack of transparency, exact figures on subsidies are hard to come by, according to the Center for International Environmental Law. The group is urging the UN to ban certain subsidies, including any that would reduce the price of raw goods used to make plastic.
Some organizations question whether these incentives are beneficial to local economies and taxpayers as a whole.
The Environmental Integrity Project issued a report that found 64 percent of 50 plastic plants built or expanded in the United States since 2012 received nearly $9 billion in state and local subsidies. Unexpected events were common, including violations of air pollution permits among 42 plants and more than 1,200 accidents like fires and explosions. State-modified permits at 15 plants allowed for additional emissions that were often detected beyond the property line of the plants.
A case study report published June 2023 by the Ohio River Valley Institute examined the $6 billion Shell facility built in Beaver County, Pennsylvania to produce plastic pellets.
“Since the project’s inception, industry executives and government officials alike have argued that it would spur local economic growth and renewed business investment. Yet prosperity still has not arrived. Beaver County has seen a declining population, zero growth in GDP, zero growth in jobs, lackluster progress in reducing poverty, and zero growth in businesses—even when factoring in all the temporary construction workers at the site,” the report says.
The Shell Pennsylvania Petrochemicals Complex makes plastic from “cracking” natural gas in Beaver County, near Pittsburgh, PA. (Mark Dixon/Flickr)
Conflicted Solutions for a Plastic World
The Plastics Industry Association argues that plastic “makes the world a better place”—language it wants in the plastics treaty.
The association represents more than one million workers throughout the entire supply chain. A $468 billion industry, plastics are the sixth largest U.S. manufacturer, according to the association, which did not respond to media requests for an interview.
David Zaruk, a communications professor in Belgium with a doctorate in philosophy, said opposition to plastic is largely an attack on the fossil fuel industry—part of a larger “anti-capitalist political agenda.” The value of plastic on society, he said, is frequently understated.
He pointed to a 2024 study published in Environmental Science and Technology that concludes plastic is far more “sustainable” with lower greenhouse gas emissions than alternatives like paper, glass, and aluminum—many of which it was designed to replace. Arguments often overlook the environmental impact of alternatives, the study notes, and in some cases, there are no substitutions for plastic.
“This isn’t a recent revelation either. Academic scientists have said for years that plastic serves essential functions. Speaking specifically of short-lived plastic uses, a pair of supply chain experts argued in 2019 that ’some plastic packaging is necessary to prevent food waste and protect the environment.’ By the way, food waste produces roughly double the greenhouse emissions of plastic production,” Mr. Zaruk wrote recently on the Substack blog, Firebreak.
The Plastics Industry Association heavily promotes recycling and biodegradable plastics but critics say there are inherent problems with both.
Only 4 percent of plastic is recycled in the United States and about 16% in Canada, while an equal amount ends up in rivers, oceans, and soil—breaking down into microplastics and nanoplastics that experts believe will persist for centuries.
The U.S. Plastics Pact—a collaboration of more than 100 businesses, nonprofit organizations, government agencies, and academic institutions initiated by The Recycling Partnership and World Wildlife Fund—identified 11 problematic plastics that its members aimed to voluntarily eliminate by 2025. Members include major plastics users and the products are all finished items or components of plastics that either aren’t recycled or cause problems in the recycling system and could be eliminated or replaced.
While some major companies support the pact, the Plastics Industry Association has taken a dim view of the pact, describing it as an attempt to “tell others how to run their businesses by restricting their choices.”
The association says the best way to increase recycling is through education and innovation.
Recycled Mystery Chemicals
Unfortunately, recycling isn’t a perfect solution to the plastic problem. Recycled plastics present additional hazards because they are made from a blend of products and a more uncertain chemical makeup, according to Therese Karlsson, science advisor for the International Pollutants Elimination Network, a global consortium of public interest groups.
“We’ve looked a lot at recycled plastics. There you have a lot of different plastic materials that you don’t know what they contain and you combine that into a new plastic material that you have even less information about what it contains,” Ms. Karlsson. “As a consumer, you can’t look at a piece of plastic to figure out if it’s safe or not. We just don’t know, but we know a lot of the chemicals used in plastic are toxic.”
An IPEN investigation found plastic pellets recovered from recycling facilities in 24 countries had hundreds of toxic chemicals—including pesticides, industrial chemicals, pharmaceuticals, dyes, and fragrances.
“For our recycling technology, it just doesn’t work, and a lot of that ends up in landfills anyway,” said Ms. Smith from the WWF. “It shouldn’t require a decoder ring to decide what goes in that blue bin because everything should be designed for that system.” For the Silo, Amy Denny.
Little Changes Make a Big Difference
In the absence of government intervention, Ms. Smith said there are some easy tips consumers can take to limit their own plastic exposure:
Shop with reusable shopping bags.
Don’t use plastic in the microwave or dishwasher because heat can release additional polymers.
Buy metal or glass snack containers to replace sealable plastic bags.
Use beeswax cloth in place of plastic wrap.
Replace dryer sheets with wool balls.
Carry a refillable cup for water and coffee.
Consider reusable trash bags.
Use and carry metal straws, stir sticks, and/or reusable cutlery.
Don’t litter, and pick up trash you find outdoors.
Buying a car is a process that’s full of decisions, many of which can drastically alter your out-the-door price. Deciding whether to purchase add-ons simply adds to the stress of it all. Most car buyers are offered an “extended warranty,” but it’s a term that is too often used in a misleading way. What are extended car warranties, and when do you need one?
What Is an Extended Warranty?
An extended warranty is a service contract that covers certain repairs or services after the original manufacturer’s warranty expires. However, the term is frequently used incorrectly to refer to vehicle service contracts (VSCs) sold by third parties. A true extended warranty can only be provided by the vehicle’s manufacturer or dealer. Vehicle service contracts, on the other hand, are often sold by third-party companies and cover repairs in addition to the original warranty. Both extended warranties and vehicle service contracts protect you from unforeseen repair expenses; the key difference is who sells you the plan – the car’s manufacturer or a third party.
Whether you need an extended warranty depends on your personal risk tolerance and the reliability of the vehicle you are purchasing. Here are some factors to consider:
New Cars: New vehicles come with a manufacturer’s warranty that typically lasts for 3 to 5 years, with mileage limitations as well. Here’s an example from Toyota. It’s important to check the warranty term for the vehicle you’re considering buying. If you plan to keep the car beyond this period and want extra peace of mind, an extended warranty or VSC might be a good option.
Used Cars: For used cars, especially those without any remaining manufacturer’s warranty, an extended warranty can provide valuable protection against unexpected repair costs. However, it’s important to consider the vehicle’s reliability and your willingness to pay for potential repairs out of pocket. For used cars, you can often get a much lower rate for a vehicle service contract from a third party.
What Coverage Should an Extended Warranty provide?
When evaluating an extended car warranty, consider the following coverage details. The same rings true for vehicle service contracts:
Duration and Mileage: Ensure the warranty covers an adequate period and mileage that suits your needs and driving habits.
Covered Components: Look for comprehensive coverage that includes major systems like the engine, transmission, electrical systems, and more.
Exclusions: Understand what is not covered, such as wear-and-tear items and regular maintenance.
Deductibles: Check the deductible amount and whether it applies per visit or per repair. A high deductible may change your mind about the value of the coverage.
Additional Benefits: Some warranties include extras like roadside assistance and rental car reimbursement.
It’s always a good idea to view a sample contract before signing on the dotted line.
Should I Buy an Extended Warranty at the Car Dealership, or Somewhere Else?
While car dealerships often offer extended warranties, they typically come with significant markups. Here are your options:
Dealership: Convenient but usually more expensive. Be sure to ask if the warranty is from the manufacturer or a third party, and get other quotes to compare rates and terms, no matter what!
Manufacturer: You can often buy an extended car warranty directly from the manufacturer, sometimes even after the original purchase. But is it a better deal? Compare terms, coverage, and exclusions, along with the price.
Third-Party providers: Many third-party companies sell vehicle service contracts. While these can be cheaper, it’s crucial to research the provider’s reputation and read the contract carefully to understand what is covered and what is not. These extended warranty and VSC providers are A+ rated from the BBB.
The Takeaway: Consider Coverage Details and Risk tolerance
Understanding what an extended warranty is and whether you need one can help you make an informed decision when purchasing a vehicle. Remember to consider your risk tolerance, the reliability of the car, and the coverage details of the warranty (or vehicle service contract). By doing your due diligence, you can find the best option that provides peace of mind.
For the Silo, Karen Hayhurst.
CarEdge is a leading car consumer advocacy platform dedicated to empowering car shoppers to make confident, informed and financially savvy decisions. With trusted resources that includes AI agent shoppers, a Car Dealer Transparency Index, and hundreds of guides and videos on YouTube, CarEdge is redefining transparency, fairness and value in the automotive industry.
Our friends at NordVPN’s Threat Intelligence team has just uncovered a criminal network running paid Facebook and Instagram ads that impersonate over 400 trusted brands — from Google Authenticator and Kalshi to national lotteries — to trick people into fake app installs that redirect them to unlicensed online casinos.
The operation is not the work of a lone scammer.
It is a rented criminal platform, actively running today, used by roughly a thousand affiliates across more than 250 teams. This large-scale criminal operation hijacks the logos and names of over 400 trusted brands to redirect unsuspecting people toward unregulated online gambling. The network — which NordVPN tracks as pwa_betterlinks — runs paid adverts on Facebook and Instagram impersonating household names including Google Authenticator, Kalshi, Disney+, Duolingo, Delta Air Lines, and national lotteries.
Victims who tap the ad are shown a fake Google Play Store page that is nearly impossible to distinguish from the real thing. One tap of “Install” later, they land on an unlicensed casino asking for a deposit. What a real, targeted person sees: The full fake Google Play page — here spoofing Crown Melbourne
“What we’re looking at is essentially trust laundering. Criminals take the credibility that legitimate companies have spent years building and redirect it toward their own ends. By the time a victim realizes something is wrong, they’ve already deposited money into a casino they’ve never heard of.” Marijus Briedis, chief technology officer at NordVPN.
The fake app store hiding inside a social media ad
Every victim’s journey starts with a paid ad on Facebook or Instagram. A real, purchased placement that carries the implicit legitimacy of a platform people use every day. Clicking it takes users to what appears to be a genuine Google Play Store listing, complete with the brand’s logo, a forged developer name, a 4.9-star rating, and thousands of fabricated reviews. The only visible tell is the web address in the browser bar — a random throwaway domain rather than play.google.com. Google Authenticator spoofed on playrosario[.]site (Google LLC · Tools)
The impersonated brands span casinos and national lotteries (Crown Melbourne, Holland Casino, EuroMillions), mainstream apps (Google Translate, Google Authenticator, YouTube Kids, Adobe Acrobat, Shazam), financial services (Capital One, Credit Karma, Kalshi), streaming (HBO Max, Disney+, Peacock), and travel (Delta, United, Airbnb).
The Install button that installs nothing
Tapping Install triggers a convincing fake progress bar. No app is downloaded. What actually happens is a shortcut — a Progressive Web App, or PWA — is silently added to the home screen under the impersonated brand’s name and icon. A PWA is not a real app. It is a website that looks like one, sitting on a phone’s home screen with zero app store vetting required. The criminal can spin up a new fake page as fast as they can register a domain. On the left PWA “Installation” on Android, on the right Official app installation. The process also silently signs the device up for push notifications, which fire gambling reminders directly to the lock screen and are deliberately difficult to disable. Even the back button is rigged. Instead of returning users to the previous page, it reroutes them to the casino offer.
A commercial product designed to evade detection
Before any real page is shown, every click passes through a cloaking layer that checks whether the visitor is a human or an automated scanner — including Facebook’s own ad review bots. Checkers are served a blank decoy page. Real users are served the fake casino funnel. Across NordVPN’s captured dataset, the casino page was served 7,261 times; the decoy was served to checkers 3,153 times. The people doing the checking never see what the actual targets see. The network is structured as a commercial product, not a one-off scam. At the top sits betterlinks[.]pro, a platform that markets itself openly as a “PWA constructor for affiliates” with built-in cloaking and Facebook optimization. Unlicensed casino registration with an offering of 150% up to €3,000/ $4,830 CAD + 150 FS dazard[.]com
In the middle sit roughly a thousand affiliate accounts across more than 250 teams who rent the kit and buy social media traffic to run campaigns. At the bottom are the unlicensed casinos and CPA networks that pay the affiliates a commission for every user who registers or deposits — with captured records linking the operation to the Makeberry Affiliates network and casinos.
How to stay safe?
Marijus Briedis advises anyone using social media to keep three things in mind: A real app install always opens the official store. If tapping “Install” in an ad opens a web page rather than the Google Play Store or Apple App Store, stop immediately. Check the address bar. A genuine Google Play listing lives at play.google.com. Any other web address showing a store-style page — no matter how accurate the branding — is a fake. Review your push notification permissions. Go to your phone’s settings and check which websites have permission to send you alerts. Revoke anything you don’t recognize.
Methodology
The investigation began by identifying a shared template fingerprint across a cluster of fake app-store pages, which NordVPN used to recover live instances of the operation at scale. From there, analysts mapped the full funnel logic through network traffic analysis and JavaScript deobfuscation, revealing the infrastructure connecting individual affiliate accounts to their campaigns, destination casinos, and real Facebook Business ad pixels. Domain registration records, hosting provider data, and code-level signals — including language markers in the push notification code — were used to support operator attribution. All indicators of compromise are analyzed in machine-readable format (STIX 2.1, 880 indicators). Conclusions are based on verified data, with the perimeter of the identified systems delimited with the maximum possible accuracy.
Spring means fresh flowers and sunny days, but it also brings seasonal health issues as the weather gets warmer: from Rosacea to Lyme disease.
Most likely, you or someone you know has been affected by Lyme disease, the most common tick-borne illness in North America with more than 300,000 cases diagnosed each year. In a timely new book, Conquering Lyme Disease(Columbia University Press), Columbia University Medical Center physicians Brian A. Fallon and Jennifer Sotsky reveal that despite the challenges to find a cure for this complex, debilitating disease, precision medicine and biotechnology are accelerating the discovery of new tools with which doctors will be able to diagnose it and treat patients.
“Through rapid genetic sequencing, scientists can identify many different strains of Borrelia burgdorferi as well as new tick-borne microbial infections, such as Borrelia miyamotoi, Borrelia mayonii, and the Heartland virus.” — Brian Fallon
Could groundbreaking technologies that rapidly increase our understanding and open up new pathways mean a cure for Lyme disease one day soon? The Global Search for Education is pleased to welcome Dr. Brian Fallon to find out how tech is tackling the ticks.
“Modern technology using Next-Generation Sequencing (NGS) allows one to discover with great rapidity all microbes that may be present within a sample of fluid.” — Brian Fallon
Brian, how has technology improved the research process for tick borne diseases?
Consider the difference in price of genome sequencing between 20 years ago and today. In 2003, it had taken the Human Genome Project about 4 years and costs estimated between $500 million to 1 billion…by 2006 the cost for sequencing a single human genome had dropped to 14 million……today a whole human genome can be sequenced within days for less than $1,000. This is a tremendous advance.
Why is genome sequencing so important? Let’s look at human tick-borne diseases. When two different people are infected with Borrelia burgdorferi (the microbe that causes Lyme disease), one will resolve the disease quickly after a course of antibiotics while the other may develop a chronic relapsing remitting illness. Why? Because one person might have gotten a more persistent strain, while the other received a less invasive strain that stays localized to the skin. Additionally, the genetic differences in the human determines how the immune system responds to the invading microbe. Understanding the genetics of the infection and of the human host allows scientists to unravel the mysteries of tick-borne illnesses.
Through rapid genetic sequencing, scientists can identify many different strains of Borrelia burgdorferi as well as new tick-borne microbial infections, such as Borrelia miyamotoi, Borrelia mayonii, and the Heartland virus. When the genome of a microbe is sequenced, it provides a starting point for the study of pathogenesis, vaccine development, and treatment. Discovery of these new microbes inside ticks has been enormously helpful. A patient who has had typical symptoms of Lyme disease after a tick bite but has tested negative on the blood tests for Lyme disease might puzzle clinicians. They may criticize the insensitivity of the Lyme disease tests. However, when this same patient is tested for the newly discovered tick-borne infection, Borrelia miyamotoi, the diagnosis is then clear. Yes, the patient had a Lyme-like illness, but it wasn’t Lyme disease: it was Borrelia Miyamotoi disease.
Modern technology using Next-Generation Sequencing (NGS) allows one to discover with great rapidity all microbes that may be present within a sample of fluid. This “discovery based” approach using “unbiased next generation sequencing” enabled a 14 year old boy to be rescued from a fatal infection within 48 hours (Wilson et al, NEJM, 2014). This boy had endured 3 hospitalizations over 4 months, had over 100 diagnostic tests, spent 44 days in an ICU for encephalitis of unknown etiology, had a brain biopsy, and had to be put into a medically induced coma to prevent damage from his ongoing seizures.
Eventually Dr. Charles Chiu at U.C.S.F. employed NGS analysis of more than 8 million sequences with a bioinformatics pipeline (SURPI) for the detection of all known pathogens. The cause of the boy’s meningoencephalitis was revealed as Leptospira santarosai. He had likely acquired it in Puerto Rico, as it is not present in the continental United States. He received the appropriate antibiotics and was discharged 2 weeks later to rehab. This same approach is especially useful for uncommon infections as they might not be suspected; for example, rare tick-borne viruses such as Powassan Virus or Heartland Virus can be rapidly detected using this discovery approach.
DNA Double Helix
How has big data impacted the way advocacy groups support research?
A patient-generated source of Big Data is LymeDisease.org. This California based organization developed a survey called “My Lyme Data” that patients could fill out on the web about their clinical history and lab tests and treatments. In a short period of time, they had data on 10,000 patients whom they track over time. With this information, they provide a more comprehensive clinical view of the bulk of patients who are diagnosed with persistent symptoms despite treatment for Lyme Disease (aka Chronic Lyme Disease).
“In geographic areas where medical professionals are scarce, AI technologies will play an increasing role in improving patient care by allowing differential diagnoses to be generated and treatment options suggested through AI-based systems accessed through the internet.” — Brian Fallon
Jobs in all professions are being automated. Do you believe AI technologies will only assist doctors or will they replace physicians in some tasks? What does this mean for doctors, nurses, and the future of medicine?
Borrelia
While AI technologies will go a long way to assist health care providers to provide better care, its application to medical care is still just beginning. One can anticipate, however, that in geographic areas where medical professionals are scarce, AI technologies will play an increasing role in improving patient care by allowing differential diagnoses to be generated and treatment options suggested through AI-based systems accessed through the internet.
The general public has more access to information than ever before about Lyme disease from websites, medical organizations, articles and social media. Everyone can be their own “expert” or even their own “doctor.” Can you speak about the pros and cons of online health data in the era of fake news?
This obviously is a huge area of concern. Individuals used to turn to their physician or to the medical information books, such as the Merck Manual. Now, they turn to the web.
In a recent survey of patients who used the web to obtain health information (Doherty-Torstrick 2016), we learned that more than half of the 730 patients reported they experienced increased distress as a result of checking the web. We also learned from this survey that individuals who did not have a health education were more likely to spend more time on the web and were thus prone to develop more anxiety than those who were better educated from a health perspective. While some of the information they find may be accurate, other information may be well-intentioned but ill-informed, misleading, and even harmful.
“Researchers can rapidly screen thousands of drugs to determine which agents have the strongest ability to kill Borrelia spirochetes. This is possible because of the development of high throughput assays, which have proven more effective than the standard agents in eradicating both the stationary phase Borrelia and its more drug-tolerant persister-forms.” — Brian Fallon
Look into the future. What are the technologies you are most excited about in terms of helping to find cures for Lyme disease and improve patients quality of life?
Researchers can rapidly screen thousands of drugs to determine which agents have the strongest ability to kill Borrelia spirochetes (Feng 2014). This is possible because of the development of high throughput assays, which have identified new antibiotics that have proven more effective than the standard agents (doxycycline, amoxicillin) in eradicating both the stationary phase Borrelia and its more drug-tolerant persister-forms. While it cannot be assumed that what is true in the lab setting will translate to efficacy in humans, biotechnology advances have enabled the identification of new therapeutic agents, offering much hope for a wider array of treatment options for patients in the future.
Another major advance is “big data” conducted by biomedical information engineers trained in biostatistics and computer science. Internet search engine queries are being monitored to predict outbreaks of infectious disease. Unanticipated side effects of drugs and their interactions can be detected through analyzing millions of digital medical records from patients who have taken a particular drug. One can examine whether patients given an antibiotic did better when treated for longer or shorter periods, or whether patients with a pre-existing autoimmune disease are more likely to develop complications from a new onset Tick-borne infection than those without a history of autoimmune problems.
2005 James Gathany; William Nicholson The blacklegged ticks, I. pacificus, (depicted here), and I. scapularis, are known vectors for the zoonotic spirochetal bacteria Borrelia burgdorferi, which is the pathogenic bacteria responsible for causing Lyme disease. The ticks, inoculated with the bacterium when they bite infected mice, squirrels and other small animals, subsequently pass the pathogens to their human victims when they obtain a blood meal.B. burgdorferi bacteria can infect several parts of the body, producing different symptoms at different times. Not all patients with Lyme disease will have all symptoms, and many of the symptoms can occur with other diseases as well. If you believe you may have Lyme disease, it is important that you consult your health care provider for proper diagnosis. The first sign of infection is usually a circular rash called “erythema migrans”, or EM. This rash occurs in approximately 70-80% of infected persons and begins at the site of a tick bite after a delay of 3-30 days. A distinctive feature of the rash is that it gradually expands over a period of several days, reaching up to 12 inches (30 cm) across. The center of the rash may clear as it enlarges, resulting in a bull’s-eye appearance. It may be warm but is not usually painful. Some patients develop additional EM lesions in other areas of the body after several days. Patients also experience symptoms of fatigue, chills, fever, headache, and muscle and joint aches, and swollen lymph nodes. In some cases, these may be the only symptoms of infection.
Our Lyme and Tick-borne Diseases Research Center, located at the Columbia University Irving Medical Center (CUIMC) in New York City, is right next door to an international data resource. CUIMC is the coordinating center of a public health information initiative which includes medical records from approximately 400 million people drawn from eighty health-care organizations from around the world. This represents a unique opportunity to ask questions, generate hypotheses and get answers about Tick-borne diseases. When discovery is optimized, medical care is enhanced.
Brian Fallon, MD, MPH is the Director of the Lyme and Tick-Borne Diseases Research Center at the Columbia University Irving Medical Center and the author with Jennifer Sotsky of Conquering Lyme Disease: Science Bridges the Great Divide, published in 2018 by Columbia University Press.
Trade Diversification Ambitions Face a Container Port Reality
Alberta recently submitted its West Coast pipeline proposal to Ottawa’s Major Projects Office, a major plank in the federal government’s goal to double exports to non-US markets by 2035.
For that to succeed, more of Canada’s exports will need to move by water, already the largest mode for non-U.S. trade by value. And container shipping is part of that.
So how do Canada’s container ports stack up?
The short answer: Not well. Rectifying that would help Canada meet its trade-diversification goals.
Roads were Canada’s dominant export mode over the 12 months ending in May, carrying 37 percent of export value. But those roads cross just one border. Strip out the United States and the picture flips entirely. Water carries 54 percent; air carries 41 percent. Road falls to 3 percent. Put differently, the infrastructure we’ll need to reach the 2035 target looks almost nothing like today’s.
What is the Container Port Performance Index?
The Container Port Performance Index (CPPI), produced by the World Bank, is a global scorecard for container shipping efficiency. Canada’s performance should raise alarm bells.
The Index tracks total time a container ship spends under a port’s control, from the moment it arrives in the harbour to the moment it leaves the berth. Rather than grading ports on a traditional scale of zero to 100, the index uses a statistical baseline centred on the global average and adjusts for the size of a vessel and its cargo volume. A negative score means a port is operating below that benchmark. It simply means that for the same job, a ship sits idle longer than at an average gateway anywhere else.
The Port of Vancouver, which handles fully 42 percent of Canada’s container shipments, ranks 375th out of 400 ports worldwide in the newly released 2025 ranking, with a score of minus 92. That’s actually an improvement on minus 159 in 2024: a dismal 389th. Vancouver was among the 20 most-improved ports in the world year over year. But even after climbing 67 points, a hole this deep still leaves you in the hole.
Vancouver’s CPPI score has been negative in five of the last six years, including a catastrophic collapse to minus 394 and 395 scores in 2021 and 2022, which also coincided with a historic BC flood that severed rail lines into the port for more than a week, layered on top of a pandemic-era demand surge hitting ports worldwide. Even so, strip those two years out and Vancouver’s score still never turns positive again.
Vancouver is part of a broader Canadian pattern. Prince Rupert ranks 322nd, despite handling a meaningful share of Canada’s transpacific container trade, and its year-to-year swings are significant: from minus 10 in 2020 to minus 248 in 2022 to minus 54 in 2024. Montreal sits at 338th. Saint John is slightly better at 268th.
The one major exception is Halifax, which has become a genuine success story: 29th in the world in the latest data, up from a middling performance just a few years ago, and 55th last year. Three of Canada’s busiest ports still rank in the bottom fifth of the world. Halifax proved it doesn’t have to be that way.
A recent Bank of Canada analysis of satellite vessel-tracking data found that Canada’s rank for total ship capacity moving through its ports fell from sixth in the world in 2016 to 23rd by 2023, a steeper drop than almost any other major trading nation. Part of the reason: the newest ultra-large container ships carry more than 20,000 containers while the largest vessels Canadian ports can handle top out around 15,000. As a result, some cargo bound for Canada comes through a US port.
Infrastructure isn’t the whole story. Labour issues also lengthen the time ships spend in Canadian ports, and addressing them matters just as much as modernizing the infrastructure itself.
After Nutrien decided to build its new billion-dollar potash export terminal in the United States rather than in Canada, Transport Minister Steven MacKinnon, made an unusually blunt admission for a sitting minister about his own file: Canada’s transportation policy and supply chain management need to be the best in the world given the country’s geography, and right now they aren’t.
Nutrien’s decision came even after the 2025 federal budget had already been tabled. That budget dedicated $5 billion, or 4 percent, of its $115-billion infrastructure plan to bolster Canada’s trade and transport infrastructure. Whether allocating more to such infrastructure would generate a bigger bang for the buck is a fair question.
Carney’s Ambitions
The PM’s ambitions depend on a clear-eyed read of where Canada’s port performance actually stands. The pattern holds across almost every major Canadian port, year after year, even as Ottawa doubles down on trade diversification. Halifax shows that the climb from a lower tier is possible. Until the rest of Canada’s ports make it too, the 2035 target will likely stay out of reach.
The Viking 1 lander’s photographs gave the world its first look at the surface of Mars, including this image taken before sunset August 21, 1976. (NASA/JPL)
On July 20, 1976, seven years after NASA landed a man on the moon, the U.S. space agency safely landed the first spacecraft on Mars.
Viking 1 operated for six years, far exceeding its planned 90-day mission. The lander tested soil and sent home the world’s first images of the Martian surface. While Viking 1 — consisting of an orbiter and a lander — did not find signs of life, its successful landing led to future exploration of Mars, including by the Perseverance rover launched in July 2020.
As the 50th anniversary of Viking 1 approaches, the United States is again reaching for Mars with missions that serve as a stepping stone toward sending astronauts to the red planet. NASA’s Artemis program aims to create a permanent moon base by 2032 to test human habitation on other planets and inform missions to Mars.
“We will pursue our manifest destiny into the stars, launching American astronauts to plant the Stars and Stripes on the planet Mars,” President Trump said in his January 2025 inaugural address.
Mars missions continue
This digital rendering provides a conceptual image of the Space Reactor 1 Freedom that NASA will use to study Mars. (NASA)
Other NASA missions are carrying on Viking 1’s legacy , furthering scientific knowledge of the fourth planet from the sun. Launched in November, NASA’s Escapade and Plasma Acceleration and Dynamics Explorers mission will reach Mars in 2027. The twin spacecraft will orbit Mars, collecting data on space-weather conditions to inform future robot and human missions.
In 2028, NASA will launch the Space Reactor‑1 Freedom to Mars, an uncrewed mission designed to demonstrate whether nuclear electric propulsion can work in deep space, an essential element for human flight to Mars.
A pioneering legacy
A Viking 2 image of Mars’ Utopia Plain (NASA)
Successfully landing Viking 1 on Mars was an extraordinary achievement. While other nations had tried, communications were lost on touchdown. Yet NASA repeated the feat two months later with the safe landing of Viking 2 on September 3, 1976.
Project managers weren’t certain what to expect from either mission. The Viking 1 landing, originally scheduled for America’s bicentennial on July 4, 1976, was delayed when the planned landing site appeared too rocky. Yet the Viking missions’ legacy endures. Viking orbiters mapped 97% of Mars’ surface and sent home 52,663 images. The landers returned 4,500 photos before Viking 1 finally stopped operating in November 1982.
While neither mission discovered signs of life, the search continues as scientists revisit findings from Viking and later missions. In September, NASA announced that a soil sample Perseverance collected may contain evidence of ancient microbial life, calling it “the closest we have ever come to discovering life on Mars.”
You know the look: A long, low-slung sedan finished in shiny black paint with equally bright chrome rolls through town. Beige, burgundy, and blue cars move out of the way, magnetically repelled by the menacing four-door.
This threatening style has been idolized by Hollywood since the 1960s, perhaps most famously in the unfortunately short-lived ABC television program The Green Hornet, in which actor Van Williams drove a Chrysler Imperial modified by Dean Jeffries. It was painted black, of course, and the chrome slats that ran horizontally across its huge grille clearly meant business—even on the 19-inch TV screens that took up considerable living room real estate in a 1960s home.
Black paint, while popular today, was a daring, high-style choice in the 1960s that was not-so-subtly influenced by the largely chauffeur-driven cars that carried around heads of state and other major politicians. For instance, the Soviet Union’s KGB notoriously drove around in black-painted GAZ Chaika sedans that had a distinctly Detroit-inspired appearance. (The irony of which seems to have been lost.)
An outsider might not expect Japan, where the pavement has been specifically engineered to be quiet, to have a small but mighty homegrown industry producing the world’s most ominous cars.
Nissan
The Japanese Royal Family Needed a Ride of Their Own
Dating back more than 1400 years, Japan’s Imperial Household Agency does just what its name suggests: it manages the royal family’s affairs. This is no easy task for a country so steeped in tradition. In fact, the Imperial Household Agency has more than 1000 civil servants, which stands in marked contrast to the self-funded, non-governmental managers of, say, the British and Swedish royal families.
The Imperial Household Agency’s wide-ranging list of tasks includes everything from ensuring that the Emperor’s family is comfortable and healthy to organizing and overseeing ceremonies. In the early 1960s, the Imperial Household Agency called automakers together and told them to submit designs for an official state vehicle. The car needed to have four doors, be reasonably spacious, and have a prestigious but not overly ostentatious appearance.
Nissan
Prior to World War II, the Emperor’s vehicle fleet consisted of large, imported cars from brands like Rolls-Royce and Daimler. The company’s nascent automotive industry focused on small, mostly work-oriented vehicles. By the early 1960s, Japan’s recovery from the war’s devastating effects was well underway, fueled heavily by Western investment. While Japan didn’t give up on its traditions, the bright lights of Tokyo had a strong American influence. So too did the country’s cars, like the Toyota Crown that looked like last season’s Chevy. So when the Imperial Household Agency came calling, it should come as no surprise that the results looked rather Detroit-ish.
The winner was a brand you might not have heard of: Prince Motor Company. Founded in 1947, Prince was Japan’s short-lived flagship automaker in the early 1960s, though it was in the midst of being folded into Nissan.
The Prince Royal that got the royal nod, so to speak, was based on the Prince Gloria, a vehicle already used by the Japanese government in an official capacity. The Prince Royal was extended to provide those in back with stretch-out legroom, and the rear doors were modified to open coach-style for easier and more elegant access. While not a particularly showy car, the Prince Royal has an understated elegance. Its stacked headlights recall the Ford Galaxie and the big W108-generation Mercedes-Benz models. The tall greenhouse, on the other hand, is a nod to practicality rather than style. Inside, in the Japanese luxury tradition, the wool seats make nary a peep as passengers slide across. Leather would be rather squeakier.
The Prince Royal gained the Imperial Household Agency’s nod as transport for the Emperor of Japan. These cars served until 2006, when they were replaced by a special version of the Toyota Century.Nissan
Underhood, the Prince Royal utilized a 6.4-liter V-8—not Japan’s first, but only a couple of years after the so-called “Toyota Hemi.” An eight-cylinder design was, admittedly, an odd choice; while inherently fairly smooth, the engine was undoubtedly a costly thing to develop. Fewer than 10 were ever built, one of which lives at the unusual and yet highly appealing Nissan Engine Museum and Guest Hall next to the company’s powertrain factory in Yokohama, Japan.
Just five Prince Royals were built, and they stayed in service for a staggering 40 years, when they were replaced by a limousine version of the Toyota Century. But the Century doesn’t really owe its status to the Prince Royal. It should thank the Nissan President, a model that was developed back when Nissan and Prince were quasi-competitors.
Into the 1980s, the Nissan President retained a classic, but hardly ostentatious, look as seen on this 1982 President Type-CNissan
The President, as its name suggests, was intended from the start as a government vehicle. Unlike Toyota’s Crown, the first Japanese car to use a V-8, the President was developed in direct response to the Imperial Household Agency’s request. At nearly 200 inches long, the President was a very large sedan by Japanese standards. Its styling is contemporary if a bit bland, even in comparison to the Prince Royal. Horizontal headlights embedded in a broad, generic grille give way to fenders that had an almost Ford Falcon modesty to them. There’s a bit more drama at the rear with big NISSAN badging. Copious chrome lines the rocker panels.
While the Prince Royal ended up being chosen to transport the Emperor, Nissan’s President didn’t go home empty-handed. Instead, it was used by the country’s Prime Minister. Government versions were only minimally modified compared to the President models sold through Nissan’s dealership network in Japan, though official-use models were invariably painted black. Those available to consumers came in a slightly wider range of colors. The President was a sign that its owner—and, most likely, the person riding in the back—had arrived. It was the Lincoln Continental of its era. Today, when government spending is closely watched by a hawkish public, there is no U.S.-market comparison.
In Japan, fabric upholstery like the wool seen in the 1973 Nissan President remains an indicator of a high-end vehicle because it makes no sound as a human slides across it.Nissan
Nissan didn’t dominate government contracts, but it was a commanding presence into the late 1980s. Then, almost inexplicably, the brand gave up. Its chrome-laden second-generation President, which was based on an early 1970s design, was replaced with a comparatively plebian design that would be sold in the U.S. as the Infiniti Q45. That’s not to say that the Q45 was a dud, but its big plastic bumpers and, in Japanese-market spec, Jaguar-ish grille were not in keeping with tradition. The Imperial Household Agency famously rejected a stretched version of the 1990 President in favor of the Toyota Century.
Toyota’s Century Begins
The original Toyota Century was overshadowed, at least to a degree, by the Nissan President that beat it to the market in Japan and initially secured more government contracts.Toyota
Thanks in part to the floodgates of 25-year-old vehicles from Japan, the Toyota Century has something of a cult status among enthusiasts in the U.S. today. It was not always this way; while the Century was undoubtedly a high-tech vehicle at its 1967 debut, the Imperial Household Agency initially passed it up in favor of the Nissan President. However, the Century’s rise coincided with Toyota’s phenomenal growth in the 1970s and 1980s, when it began to overtake Nissan as the premier Japanese automaker.
The original Century ran for three decades, always with V-8 power. Despite the fact that its specs and power could have appealed to buyers in Europe and, especially, the U.S., it was rarely sold in left-hand-drive markets. (Toyota flirted with the idea in the early 2000s before concluding that the conservative Century would be no match for the comparatively flamboyant Mercedes-Benz S-Class.)
Toyota
Yet it’s the Century that endures in Japan, an icon in its own time. The Emperor of Japan rides around in a stretched one, approved by the Imperial Household Agency, of course. The redesigned model that arrived in 2018 carries on the 1960s original style in marked contrast to the edgy, modern look found in any Toyota or Lexus model. There’s even an SUV version now, though its front-wheel-drive architecture and hybrid V-6 powertrain mean it’s more like a snazzy Toyota Highlander than a bespoke Emperor-hauler.
Toyota
Clearly, the Century has won out, so much so that Toyota recently announced it will position the Century as its own brand as a more conservative sibling to Lexus. It did face some limited competition from Mitsubishi with its mid-1960s Debonair. While the Mitsubishi, with its slab sides and fenders that leap forward past its grille, is basically a rolling villain, the four- or six-cylinder sedan lacked the interior volume and the power to compete with the Century or the President. Its angular 1986 replacement, which looked sort of like a K-Car with fender mirrors, was anything but debonair.
Though its effort was comparatively short-lived, the Mitsubishi Debonair boasted a fantastic name and slab-sided Lincoln Continental-inspired looks, if not Conti-style proportions.Mitsubishi
The Yakuza Turns State Cars Into Mafia Cars
Nobody does organized crime like the Japanese—and that is not meant as a compliment. The Yakuza, as the Japanese crime syndicates are broadly known, hit its peak right around the time when the decidedly more upstanding Imperial Household Agency was asking automakers to design a state vehicle.
Those vehicles were soon appropriated by the Yakuza. In retrospect, they have a sinister, angry look. If the bad guy in a period flick drives a car in Tokyo, it’ll be a President, a Century, or perhaps an early Debonair. Set in 1999, HBO’s Tokyo Vice puts the Q45-adjacent Nissan President front and center. While it may not have been the vehicle of choice for the Emperor, that era’s President was the car to have for the heads of organized crime. Perhaps that’s why Nissan steered away from tradition with its final redesign, a swoopy model unsuccessfully sold here as the Infiniti Q70.
The 1990 Nissan President abandoned the 1960s-style chrome bumpers of its predecessors.Nissan
These big, black sedans have an authoritarian presence. Their drivers may think they have impunity. Not only are their cars imposing, but they look official—even if those inside are doing anything but official business. Yakuza members often mounted curtains inside their Presidents and Centurys, a style known as VIP that persists today—albeit in a much broader and harder-to-define look.
We have no direct equivalent in Canada or the US., at least in terms of how the criminal underground appropriated cars meant for high-ranking government officials. The Crown Victorias once favored by Canadian and American cops lack the luxury and exclusivity of a Century or President. A Chevy Tahoe can’t be all that menacing if you can find dozens of them in the carpool line at your local elementary school. And while our head of state has long had a highly modified Cadillac-ish limousine, which has been described as a tank with a limousine body, it lacks a showroom counterpart. That said, the crested wreath brand made a strong appearance in the late-1990s/early-2000s setting of HBO’s The Sopranos.
It’s a different story in Japan, though. There, a government official arrives in black-and-chrome style—as dictated, if indirectly—by the edicts set forth by the Imperial Household Agency. The automotive equivalent of a tuxedo is, after all, always in style. For the Silo, Andrew Ganz/Hagerty.
The United States recently sanctioned one entity and two individuals — First VPN Service (1VPNS), its administrator Dmytro Rashevskyi, and Yegeniy Vladimirovich Silayev — for providing critical support to ransomware groups that have targeted North American hospitals, schools, businesses, and local governments.
These actors supplied ransomware groups with tools to hide their identities, disguise malicious software, and evade detection — enabling attacks that have caused billions of dollars in losses to U.S. critical infrastructure providers.
This action reflects the United States’ commitment to working with allies and partners to disrupt the global cybercrime ecosystem. Today’s designations are coordinated with the United Kingdom’s Foreign, Commonwealth & Development Office, and follow a May 2026 European law enforcement takedown of 1VPNS’s infrastructure, supported by the FBI.
By targeting not just ransomware operators but the service providers and tool suppliers who make their attacks possible, the United States and its partners are dismantling the broader networks that sustain cybercriminal activity worldwide.
The United States will continue to use every diplomatic and economic tool available to disrupt foreign cybercriminals and their enablers and hold them accountable. Ransomware is not only a law enforcement challenge — it is a foreign policy threat that undermines the security and economic stability of the United States and its allies.
This action is being taken pursuant to the authorities under Executive Order (E.O.) 13694, as further amended by E.O. 13694, as amended by E.O. 13757, E.O. 14144, and E.O. 14306 (E.O. 13694, as amended).
Click here to report cyber-enabled crime to the FBI.
1VPNS: VPN SERVICE ENABLING RANSOMWARE OPERATIONS
1VPNS is a VPN provider whose principal clients include ransomware actors and other cybercriminals. VPNs, which allow users to encrypt their internet traffic and hide their computers’ true location, have legitimate uses for privacy and security, but can support malicious activity if misused. Numerous ransomware groups have purchased infrastructure from 1VPNS, which they have leveraged in attacks on U.S. companies and institutions—including to hide the origins of their attacks, deploy malware, and manage exfiltrated data. Victims of ransomware attacks that involved the use of 1VPNS infrastructure have included U.S. businesses, financial services companies, hospitals, and municipal governments.
1VPNS and its administrator, Rashevskyi, have provided this technological support to illicit actors. Since 2014, 1VPNS has advertised its services on multiple online cybercriminal forums, stating that it does not keep logs of users’ identities or activities, and that it refuses to cooperate with law enforcement investigations into illegal activity originating from the servers it rents to customers. Rashevskyi has used false identities, including “Maksim Sorin” and “Roman Chabanenko,” to buy infrastructure from companies that might otherwise refuse to do business with him because of complaints of abuse from internet service providers about illegal activity originating from 1VPNS servers.
OFAC is designating 1VPNS and Rashevskyi pursuant to E.O. 13694, as amended, for having materially assisted, sponsored, or provided financial, material, or technological support for, or goods or services to or in support of, cyber-enabled activities originating from, or directed by persons located, in whole or substantial part, outside the United States that are reasonably likely to result in, or have materially contributed to, a threat to the national security, foreign policy, or economic health or financial stability of the United States, and that have the purpose of or involve engaging in a ransomware attack, such as extortion through malicious use of code, encryption, or other activity to affect the confidentiality, integrity, or availability of data or a computer or network of computers, against a United States person, the United States, a United States ally or partner, or a citizen, national, or entity organized under the laws thereof.
OTHER ENABLERS OF THE CYBERCRIME ECOSYSTEM
In addition to 1VPNS and Rashevskyi, OFAC is designating Silayev, a Belarusian national and a cryptor provider who has supplied encryption and obfuscation services to ransomware operators targeting U.S. and allied entities. Unlike legitimate encryption tools, which are designed to protect data and the privacy of the people that own it, cryptors are built specifically to make malware stealthier and more effective by disguising it as harmless files.
OFAC is designating Silayevpursuant to E.O. 13694, as amended, for having materially assisted, sponsored, or provided financial, material, or technological support for, or goods or services to or in support of, cyber-enabled activities originating from, or directed by persons located, in whole or substantial part, outside the United States that are reasonably likely to result in, or have materially contributed to, a threat to the national security, foreign policy, or economic health or financial stability of the United States, and that have the purpose of or involve engaging in a ransomware attack, such as extortion through malicious use of code, encryption, or other activity to affect the confidentiality, integrity, or availability of data or a computer or network of computers, against a United States person, the United States, a United States ally or partner, or a citizen, national, or entity organized under the laws thereof.
SANCTIONS IMPLICATIONS
As a result of this action, all property and interests in property of the designated or blocked persons described above that are in the United States or in the possession or control of U.S. persons are blocked and must be reported to OFAC. In addition, any entities that are owned, directly or indirectly, individually or in the aggregate, 50 percent or more by one or more blocked persons are also blocked. Unless authorized by OFAC, or exempt, OFAC’s regulations generally prohibit all transactions by U.S. persons or within (or transiting) the United States that involve any property or interests in property of blocked persons.
Violations of U.S. sanctions may result in the imposition of civil or criminal penalties on U.S. and foreign persons. OFAC may impose civil penalties for sanctions violations on a strict liability basis. OFAC’s Economic Sanctions Enforcement Guidelines provide more information regarding OFAC’s enforcement of U.S. economic sanctions. In addition, financial institutions and other persons may risk exposure to sanctions for engaging in certain transactions or activities involving designated or otherwise blocked persons. The prohibitions include the making of any contribution or provision of funds, goods, or services by, to, or for the benefit of any designated or blocked person, or the receipt of any contribution or provision of funds, goods, or services from any such person. Non-U.S. persons are also prohibited from causing or conspiring to cause U.S. persons to wittingly or unwittingly violate U.S. sanctions, as well as engaging in conduct that evades U.S. sanctions. Individuals located in the United States or abroad who provide information about sanctions violations to Treasury’s Financial Crimes Enforcement Network’s whistleblower incentive program may be eligible for awards if the information they provide leads to a successful enforcement action that results in monetary penalties exceeding $1,000,000 usd.
The power and integrity of OFAC sanctions derive not only from OFAC’s ability to designate and add persons to the SDN List, but also from its willingness to remove persons from the SDN List consistent with the law. The ultimate goal of sanctions is not to punish, but to bring about a positive change in behavior.
I started out creating sound experiments while in high school, circa 1980 with circuit bent hardware and a cheap Casio keyboard.
I then entered the working world and forgot all about making music. Fast forward 30+ years, and the itch to make experimental music overtook me again, but now technology had changed drastically. I no longer needed hardware. I discovered apps on my iPhone, and music platforms like SoundCloud and Bandcamp were all that I needed. I was immediately obsessed.
Within a couple years, I had filled over seven free SoundCloud accounts, and two Bandcamp albums as well as an artist page with experimental music, and having a great time doing it. But, I started to grow tired of using the same software.
I yearned to use hardware/instruments again, but not being able to play an instrument is a definite hindrance 🙂 I searched for cheap keyboards on the net. I soon discovered the “Stylophone” and ordered one ‘sight unseen’. It was unique, inexpensive and fun, but quite limited in sound variety. I started mixing the Stylophone with app produced sounds/music, as well as other “found sounds”. (I really appreciate the functionality of software based mixing apps, which are almost essential to my creations these days). I then stumbled upon a couple of user videos of the Hyve synthesizer, and knew I had to have it. It was clearly non-musician friendly (and looked so different, cool and fun).
Then came the disappointment …
You can’t buy one! (BUT I HAD TO HAVE ONE!!!) Turns out, the engineer/designer guru behind this awesome device (Skot Wiedmann), had (Hard to believe but it’s been almost a decade since I made this trip!) work shops in the Chicago area, and you can go build your own, ( very inexpensively ). I knew what I had to do. I looked at a map, saw that Chicago was about 8 hours away from me here in Ontario, Canada and realized that I had to go build it. I started to plan the trip. I knew that a fellow SoundCloud musician and Facebook friend (Leslie Rollins) lived in Berrien Springs, Michigan, about 2 hours outside of Chicago.
This presented a twofold opportunity. I could hopefully, meet Leslie face to face, and hopefully have a place to spend the night. I contacted Les and everything was A-OK! I purchased a ticket to build my Hyve, and started to plan my road trip. The workshop was going to be from Noon to 3pm, on a Saturday in late September in a cool space called Lost Arts in Chicago.
I had the whole week off from work, because I was overseeing a contractor doing extensive yard work at my house all week, and I was hoping to leave Friday so as to arrive at Leslie’s place in the late afternoon or early evening, spend the night, and leave for the workshop Saturday morning. Alas, plans rarely work as hoped.
The contractor wasn’t finished until Friday afternoon, and Les wasn’t getting home from a business trip until late Friday night. New plan! Early to bed Friday. Early to rise Saturday (2:30 am), and depart for Leslie’s place in Michigan. It was an easy drive, and I got to Berrien Springs (a beautiful sleepy little university village) around 8:30 am. Met Leslie, and got to trade stories over a great breakfast in a local cafe. Then, I quickly admired Leslie’s impressive modular synth racks at his home studio “Convolution Atelier” and then left for “Lost Arts” in Chicago.
Lost Arts is located in a cool old industrial complex.
The workshop provided everyone with a surface mount board with the touchpad on one side, and components layout on the back. A sheet listing components and placement was also handed out, along with tiny plastic tweezers. Everyone then had their component side “pasted” with a solder paste applied through a pierced template, in a process similar to silk screening. Everyone then started to receive their very tiny components from the parts list. Following the placement locations, the components (chips, capacitors, resistors, etc) were set into their pasted areas with the tweezers (magnification and extra lighting was a must). Once all the components were placed, they were carefully “soldered” into place by simply holding a heat gun over each component until the solder on the board had adhered it. Once this was done, everyone had their 9v battery and line-out jacks hand soldered into place by Skot , and then … the moment of truth, Skot tested each one for proper operation.
It was a fascinating process and great experience.
I met a lot of cool people at the workshop, both builders and staff/helpers! I can’t say enough what a fantastic experience this was, and what an awesome, diverse and versatile device the Hyve is. I doubted my sanity when planning this trip, but it turned out to be very rewarding!
Leslie and I then went back to Michigan, stopped at a local brewery in Berrien Springs (Cultivate) and sampled a few of their excellent brews, and then proceeded to Convolution Atelier to play with Leslie’s modular system. (I’m a newbie to all things modular, and I received a great crash course from Leslie on his very cool array!) Then it was out to dinner with Leslie and his wonderful wife Lisa, and finally back to their house where I stayed for the night, and finally hit the road towards home the next morning. It truly was a great adventure! For the Silo, Mike Fuchs.
The World Economic Forum’s Top 10 Emerging Technologies Report 2026 identifies breakthrough innovations in energy, medicine and infrastructure.
The report highlights 10 emerging technologies expected to achieve real-world impact within the next three to five years.
These technologies could help broaden access to energy, healthcare and critical resources, making access to them less dependent on geography or existing resource availability.
Learn more about the Annual Meeting of the New Champions 2026 here. Follow on social media using #amnc26, #2026夏季达沃斯# and #InnovateScaleImpact. Read the report here.
Dalian, People’s Republic of China, 23 June 2026 – Our friends at The World Economic Forum released its annual Top 10 Emerging Technologies Report 2026 today, identifying breakthroughs poised to reshape economies and societies within the next three to five years.
Produced in collaboration with Frontiers, a leading scientific publisher, the report examines technologies approaching a critical inflection point where advances in research are beginning to translate into large-scale, real-world applications.
The report identifies 10 emerging technologies approaching commercial and societal scale:
1. Everything-to-grid energy: Buildings, vehicles, factories and data centres can increasingly act as both energy consumers and suppliers, sending stored electricity back to electricity grids when needed. This could improve energy resilience while making better use of local renewable power.
2. Direct lithium extraction: Removes lithium from brine in hours rather than months, while using less land and water than conventional methods. It could unlock new sources of a critical battery material and strengthen supply chains.
3. Passive radiative cooling materials: These materials cool buildings and equipment without electricity by reflecting sunlight and releasing heat into the atmosphere. They could reduce energy demand and improve resilience in hotter climates.
4. PFAS destruction: New technologies can break down per- and polyfluoroalkyl substances (PFAS), known as “forever chemicals”, that have long resisted conventional treatment. This could help remove persistent pollutants from water supplies and the environment.
5. Precision fermentation: Uses microorganisms to produce specific ingredients and materials more efficiently. It could enable new ways to manufacture food, chemicals and pharmaceuticals with fewer resources.
6. Exosome drug delivery: Exosomes are natural particles produced by cells that can be engineered to deliver therapies precisely within the body. They may enable treatments to reach previously inaccessible targets, including the brain.
7. Personalized mRNA cancer vaccines: Trains a patient’s immune system to recognize the unique mutations in their tumour. They could improve the ability to prevent cancer recurrence following treatment.
8. Quantum simulation for drug discovery: Models molecular interactions with unprecedented accuracy, helping researchers identify promising drug candidates faster and more efficiently.
9. World models: Enable AI systems to build a shared understanding of physical environments using multiple forms of data. They could improve how machines predict, plan and interact with the real world.
10. Lattice-based cryptography: Designed to protect data from decryption by both today’s computers and future quantum machines. It could help secure digital infrastructure as quantum computing advances.
Many of the technologies highlighted in the report point towards systems that may become more distributed, personalized and resource-efficient over time.
“While each of these technologies has the potential to make a meaningful impact on its own, together they tell a broader story about where innovation is heading,” said Stephan Mergenthaler, Managing Director, World Economic Forum. “They reveal new patterns across energy, medicine and manufacturing that could challenge long-held assumptions about how we use technology to address some of the world’s most pressing challenges, such as food insecurity, climate change and untreatable diseases.”
Technologies such as everything-to-grid energy systems, direct lithium extraction and precision fermentation suggest how production systems could become less dependent on centralized infrastructure and traditional geographic constraints. Passive radiative cooling materials similarly point to new ways of managing energy demand and environmental pressures in regions where cooling has traditionally relied on energy-intensive systems.
Several of the technologies also suggest that value creation could increasingly depend on the ability to produce, adapt or optimize systems closer to the point of use. Personalized mRNA cancer vaccines, exosome drug delivery and quantum simulation for drug discovery all point to more individualized approaches to treatment and molecular design, enabled by advances in computation, modelling and targeted delivery systems.
Infrastructure, technical capability and deployment capacity could become increasingly important alongside traditional resource endowments, particularly in sectors where production, energy systems and advanced manufacturing are becoming more distributed and adaptive.
The report also highlights how technologies such as PFAS destruction, passive radiative cooling materials and lattice-based cryptography could reshape how industries and governments address long-standing environmental, infrastructure and security challenges. Several of these technologies raise the possibility of overcoming constraints previously viewed as difficult, persistent, or economically impractical to solve. Whether these patterns translate into real-world success, however, will depend on factors such as infrastructure readiness, regulatory adaptation, manufacturing capacity, public trust and long-term investment.
“Understanding which technologies are approaching a true inflection point requires access to the best available evidence and expertise,” said Frederick Fenter, Chief Executive Editor, Frontiers. “Open science enables researchers around the world to build on one another’s work, accelerating discovery while improving transparency and trust. That shared foundation is critical for identifying and developing innovations that can deliver lasting societal benefit.”
Developed with the Dubai Future Foundation, the report also explores the conditions that will shape how these technologies evolve and scale through 2031, including infrastructure readiness, governance, investment and public adoption. Together, these factors will play a critical role in determining whether today’s emerging technologies deliver broad societal impact tomorrow.
About the Top 10 Emerging Technologies Report Now in its 14th edition, the Top 10 Emerging Technologies report provides trusted foresight to help leaders navigate scientific and technological change. Drawing on the expertise of scientists, researchers and futurists, the report identifies ten innovations expected to scale within five years and deliver wide societal benefits. Technologies are selected through a rigorous process combining AI-enabled analysis of scientific literature, investment and ecosystem trends, and expert evaluation.
About the Annual Meeting of the New Champions 2026 The 17th Annual Meeting of the New Champions will take place from 23 to 25 June 2026 in Dalian, People’s Republic of China, under the theme “Innovating at Scale”. The meeting will bring together over 1,700 participants cross-sector leaders to explore how innovation and emerging technologies can unlock new growth models and drive positive economic momentum in a fast-shifting global landscape.
NASA’s Artemis II mission brought back stunning images from space, including one of Earth setting beyond the moon’s surface. (NASA)
NASA’s Artemis program sent the Orion spacecraft around the moon, carrying astronauts farther from Earth than ever before, as millions back home watched. Now the space agency is planning missions that will land astronauts on the moon and build a permanent base on the lunar surface to serve as a jumping-off point for human space flight to Mars.
“The Moon Base will be America’s and humanity’s first outpost on another celestial world,” NASA Administrator Jared Isaacman says of the base , planned to open by 2032. “Every mission, crewed and uncrewed, will be a learning opportunity as we return to the lunar surface, build the infrastructure to stay, and master the skills required to live and operate in one of the most demanding and dangerous environments imaginable.”
Artemis missions blend public and private-sector technology and enlist international partners. On crewed missions, the Space Launch System heavy lift rocket propels astronauts from Earth. The Orion spacecraft and a human landing system will work together to deliver the first humans to the moon’s surface since NASA’s last Apollo mission in 1972.
(State Dept.)
During Artemis II’s lunar flyby in April, astronauts (including Canadian Jeremy Hansen) aboard the Orion spacecraft they nicknamed “Integrity” sent back pictures of the far side of the moon and a solar eclipse, an image seldom seen from space.
Over the next several years, the Artemis program will launch dozens of uncrewed missions that will use robotic spacecraft to survey sites for the moon base and deposit supplies for astronauts’ future use, says Carlos García-Galán, NASA’s Moon Base program manager.
The agency next sends astronauts into space on Artemis III, set to launch in 2027. The crew of NASA astronauts Randy Bresnik, Andre Douglas and Frank Rubio, along with the European Space Agency’s Luca Parmitano, will test Orion’s interoperability with lunar landers in Earth orbit in preparation for a moon landing mission the following year.
Artemis IV, planned for 2028, will land two astronauts on the moon for a weeklong stay near the lunar South Pole. NASA expects to return to the moon with Artemis V later that year to begin building the moon base. Future crewed missions will continue at a pace of at least once per year, NASA says.
The Orion spacecraft seen alongside the moon, with Earth in the distance. (NASA)
Artemis missions are guided by the Artemis Accords , a set of nonbinding principles and norms for civil space exploration. Started in 2020, the accords now have the support of 67 signatory nations.
“We are reaching for the stars once again with the same ingenuity, courage, and indomitable spirit that have defined our national story for 250 years,” President Trump said in May, calling for “a new Golden Age of space exploration.”
The Artemis II crew of NASA’s Christina Koch, Victor Glover, Reid Wiseman and the Canadian Space Agency’s Jeremy Hansen (second from left), seen on their journey home. (NASA)
24 billion records, including usernames and passwords were just exposed in colossal data leak.
Image by Cybernews.
Cybernews researchers discovered an exposed database containing 24 billion records, including usernames, email addresses, plaintext passwords, and login URLs. The data appears to come from infostealer malware logs, records stolen from infected devices and collected from Telegram channels, breach compilations, and other sources.
Key takeaways:
Cybernews researchers found an exposed Elasticsearch cluster containing 24 billion records and more than 8.3TB of data.
Most records appear to be infostealer logs, including usernames, emails, passwords, and login URLs.
The data came from 36 sources, including Telegram channels, breach compilations, and large “collections.”
Researchers cannot yet confirm how many records are duplicates or how many unique people were affected.
The database is no longer publicly exposed, but reused passwords may still put accounts at risk.
While data leaks spilling millions of records have become the norm, one involving 24 billion records, including usernames and passwords, is something else. That’s why the Cybernews research team had to triple-check their findings after uncovering over 8 terabytes of data exposed online.
Our team discovered what is likely to be one of the largest databases ever exposed on June 12th. The vast majority of the 24 billion exposed records, our researchers believe, were infostealer logs. In other words, stolen usernames, passwords, and services that these credentials were supposed to grant access to.
“The credential data leak is dangerous simply because of its enormous size. Since the data leaked online, billions of affected accounts are at serious risk of takeovers, especially if they are not protected with multi-factor authentication,” the team explained.
Infostealer log document example. Image by Cybernews.
What did the 24 billion record data leak reveal?
The records our team uncovered were stored on a publicly available Elasticsearch cluster, a group of interconnected search servers. The total volume of information in the cluster exceeded 8.3 terabytes.
Nearly all exposed records were infostealer logs, data collected by malicious software that steals sensitive information. According to the team, the logs revealed login credentials in raw format, with each login detail saved separately, including email addresses, usernames, and passwords in plaintext.
Document counts from different sources. Image by Cybernews.
Additionally, researchers identified URLs that the leaked credentials are supposed to grant access to, as well as the source of the logs.
The exposed credentials came from 36 distinct sources, varying from Telegram channels to combined data collections of previous data breaches and datasets exported directly from live target servers.
Which Telegram channels are involved in the data leak?
For example, over 1.7 billion records supposedly came from various Telegram channels. All channels appear to be involved in cybercrime, with a focus on stolen credentials and data breaches.
Most of the 36 data sources, over 30, are Telegram channels with a number of records ranging from hundreds of millions of exposed records to a few thousand. While most of the channels were in English, some were in Russian.
To avoid advertising Telegram channels that contain stolen credentials, we will not mention their names. However, most of the Telegram-based records were supposedly taken from hacking-related channels.
Another category of Telegram channels includes access to stolen credit card data, with one channel apparently dedicated to sharing this information.
Interestingly, nearly 260 million records came from Telegram channels with “Darkside” in the title. Several years ago, Darkside was among the most prolific ransomware groups. The gang infamously attacked the Colonial Pipeline, causing fuel supply disruption on the US East Coast.
Billions of records in unknown “collections”
A staggering 22.6 billion records supposedly came from what the data owner named “collections.” These records could come from various infostealer collections previously leaked online, or they may indicate that the records are grouped by the services they are supposed to provide unauthorized access to.
Since the data was taken out of public view soon after the discovery, researchers could not further investigate the origin of the information within the so-called “collection” source.
The same reason prevented the team from deducing exactly which service providers were exposed. However, given the colossal number of records involved, it’s highly likely that they reveal access to services with very large user bases.
The team also noticed a source with 150 million records named “local database dumps.” Records from this source likely indicate they were exported directly from live target servers. Local database dumps typically involve downloading the contents of a certain database on a user device.
Check if your data has been leaked
Find out if your email, phone number or related personal information might have fallen into the wrong hands Check now by clicking the red box:
In this particular case, “local data dumps” could mean the person running the server uploaded records to the collection themselves, or that they got the data from other sources.
“Additionally, records contained file names from where they were imported. In total, there were at least 195 distinct file names. Some of them indicated that the credentials in question came from the AntiPublic collection and what kind of accounts they include,” our researchers said.
AntiPublic collection is a stealer log combo list that first appeared in 2016 and contained around 600 million records. The AntiPublic-related information in the leak categorized credentials in the AntiPublic collection. For example, some files contained logins to only adult content services or only to streaming platforms.
Another 146 million records came from a source named “breach compilation combo” and most likely contain information from past data breaches that exposed user credentials. Attackers favor exploiting information from past breaches, since users often reuse credentials and rarely change passwords.
The source with the smallest number of records was named “Redline stealer” and only contained 27 records. RedLine stealer is a common infostealer that operates as a malware-as-a-service (MaaS), allowing low-skilled attackers to participate in cybercrime.
Owner interested in news articles and social media posts
Interestingly, our researchers found a small subset of data, around 17,000 records, containing information that’s rarely seen in data leaks. For example, over 9,500 documents contained CVE (Common Vulnerabilities and Exposures) IDs and descriptions, along with corresponding GitHub repository URLs.
One of the vulnerabilities identified in the exposed cluster involved a Valhall GPU Kernel Driver issue.
Moreover, over 5,200 documents contained logs of news articles related to recently occurred data breaches with article URLs, their contents, and short descriptions. One of the news articles was published as recently as February 2026 and covered a supply chain attack targeting the Python Package Index (PyPI) repository.
Another 2,900 documents were logs of social media posts related to cybersecurity incidents. One of the posts our team saw discussed operational details of the Babuk ransomware from 2021.
All of this points to the data owner actively monitoring the cybersecurity landscape, with a likely intent to update their vast collection of credentials with records from the latest data breaches and data leaks.
The known unknowns
While we are confident the data leak our team has uncovered indeed contains a whopping 24 billion records, there are limitations to what we know about the data inside the now-closed Elasticsearch cluster.
For one, the team had limited time to investigate the data leak, which prevented us from delving deeper into the types of information that may have been included in the “Collections” source.
Moreover, we cannot confidently estimate how many duplicates were included in the leak, leaving the potential number of exposed individuals a guessing game. However, it would hardly be a surprise that a data leak involving 24 billion records would affect more than a few online accounts.
At this point, we’re also unable to accurately say how old or new the leaked data is. Based on the February, 2026 news article contained in the data leak, it appears the data’s owner regularly updates the cluster with new information.
We also do not know who the data owner is, or why anyone would hoard so much data. Our team believes that “both a company and an individual threat actor could be collecting such information for various purposes.”
“Companies could collect this data for a monitoring service or a security check service, and threat actors could be collecting this data to aid in discovering fresh exploits to help them with data breaches,” our researchers said.
Meanwhile, our team believes that when it comes to historic data leaks, hoarding everything is the way to go.
“Why wouldn’t they hoard so much data? When it comes to historical leaked data and information on exploits and attacks, the more information you have, the better, as it allows for better insights, and helps detect more relevant compromised accounts, and ways that a given target could be breached,” the team explained.
What should you do now to protect your data?
To keep yourself safe, it’s important to be proactive and take some simple but crucial precautions. Users should change reused passwords as soon as possible, starting with key accounts like emails social media cloud storage, and banking.
Enabling multi-factor authentication where possible and using password manager to create strong and unique passwords is also a good idea. Users should also be weary of phishing messages that, in some cases, may advertise assistance to check whether user data was exposed.
Meanwhile, a few smart habits and tools can go a long way in protecting your personal data agains infostealers and making it much harder for threat actors to get a hold of it.
Use a VPN when you’re on public Wi-Fi. It will help keep your connection secure and private.
Be careful about clicking on links or downloading attachments from emails or messages you weren’t expecting or don’t trust.
Keep your apps and operating systems updated on all devices since updates often include important security fixes.
Turn on two-factor authentication (2FA) whenever it’s available for an extra layer of authentication.
Only download apps and software from official stores or trusted websites to avoid fake or infected versions.
Strong password generator
Upgrade the security of your online accounts.
Create strong passwords that are completely random and impossible to guess.
Strong Password Generator
Create a secure, random password instantly.
Leaking billions of records is becoming the norm
Unfortunately, datasets with billions of records are more often left publicly accessible. Earlier this year, our team discovered another exposed Elasticsearch cluster that contained over 160 indices, holding 8.7 billion of primarily Chinese records, ranging from national citizen ID numbers to various business records.
Meanwhile, last December, our team found a database with 4.3 billion records, some of which included LinkedIn-derived personal information. The 16TB-strong instance contained emails, photos, employment histories, and other personal data. A single collection alone contained 732 million records, including photographs.
In July 2025, Cybernews researchers uncovered one of the largest data leaks in history after discovering several collections of login credentials, containing a total of 16 billion records. The team found 30 exposed datasets, each containing tens of millions to more than 3.5 billion records.
However, the only data leak comparable to the recent discovery is the one our team found back in 2024. The supermassive leak contained data from numerous previous breaches, comprising an astounding 12 terabytes of information spanning over 26 billion records.
This year’s cohort stands out for building the software and physical infrastructure needed to power autonomous AI systems at scale.
Companies are advancing breakthrough technologies in AI, energy, quantum computing, biotechnology, climate innovation, space and advanced manufacturing.
Learn more about the Annual Meeting of the New Champions 2026 here. Follow on social media using #amnc26, #2026夏季达沃斯# and #InnovateScaleImpact.
Frontier Innovation
Geneva, Switzerland, June 2026 – The World Economic Forum has announced its 2026 Technology Pioneers cohort, recognizing 100 early-stage companies from 23 countries that are developing breakthrough technologies with the potential to transform industries and societies. The cohort reflects the growing geographic diversity of frontier innovation, with nine companies from India and record representation from the Republic of Korea.
What sets this year’s cohort apart is its focus on enabling the next era of artificial intelligence (AI). While recent advances have centered on models and consumer applications, many of the Tech Pioneers are building the software and physical infrastructure needed to AI at scale.
Two groups stand out: companies developing the foundations for autonomous AI agents, including identity verification, payments, security and enterprise integration; and those addressing AI growing energy, computing and storage demands.
Frontier Innovation
The cohort also reflects the expanding geographies of frontier innovation. India contributes nine companies, many focused on deep-tech and space innovation, while the Republic of Korea records its strongest representation to date across AI, robotics and quantum technologies. Companies from the Middle East, Latin America and South-East Asia are also strengthening their presence in emerging technology ecosystems.
“For 26 years, the Technology Pioneers community has been an early indicator of where technology is going,” said Verena Kuhn, Head of Innovator Communities, World Economic Forum. “What’s new is that early-stage companies are now tackling challenges that until recently required enormous budgets, infrastructure and large teams. AI is not just what these companies are building; it is also what is making it possible.”
Beyond AI infrastructure, the cohort highlights the breadth of early-stage innovation. Companies are developing cleaner energy sources, improving cancer detection, increasing industrial efficiency, protecting data from future quantum-computing threats, enabling in-orbit satellite servicing and creating lower-impact materials. Many of these ambitions once required the resources of large corporations or government programmes. Advances in AI, simulation and automation are allowing smaller teams to tackle complex scientific and industrial challenges, accelerating innovation across sectors.
The pioneers will contribute expertise to Forum initiatives through a two-year engagement programme and be invited to participate in the Annual Meeting of the New Champions 2026, taking place on 23-25 June in Dalian, People’s Republic of China.
More information about the Technology Pioneers community and past cohorts is available here.
The 2026 Technology Pioneers are:
Australia
Uluu – Developing seaweed-based biodegradable biomaterials as sustainable alternatives to traditional plastics.
Brazil
Comp – Providing compensation management, salary benchmarking and merit cycle tools for technology companies.
Canada
Intuitive AI – Delivering AI-powered food waste monitoring and recycling analytics for commercial kitchens.
China
Deep Wisdom – Developing an automated machine learning platform for e-commerce and manufacturing.
DeepCtrls Technologies – Building physics-informed AI for energy-efficient control of industrial systems.
Landing Med – Using AI-powered digital pathology for early cancer detection.
Ninetech – Enabling enterprise digital transformation through large language models and robotic process automation.
OneAIX Technology – Providing AI solutions for trade and intelligent systems.
PhaBuilder – Engineering halophilic microorganisms to produce biodegradable materials and chemicals.
Pheno Innovations – Advancing breakthroughs in critical materials across industries through AI-powered technologies.
Tripo AI – Generating AI-powered 3D models for gaming and mixed reality applications.
Robeaute – Building modular microrobots for minimally invasive neurosurgical interventions.
Germany
Dunia – Combining AI and robotics to accelerate the discovery of electroactive materials.
SPARK Microgravity – Enabling microgravity research collaboration through integrated hardware and software platforms.
India
Airbound – Operating drone networks to deliver blood and critical medical supplies to rural healthcare systems.
Bellatrix Aerospace – Developing and manufacturing propulsion technologies for in-space mobility.
BorderPlus – Supporting healthcare professionals to access high-growth international opportunities.
Dhruva – Building small satellite platforms to advance India’s growing space ecosystem.
Ethereal Exploration Guild – Developing reusable medium-lift launch vehicles for cost-efficient orbital access.
Fermbox Bio – Producing alternative lipids, proteins and green chemicals through fermentation-based biomanufacturing.
OrbitAID – Developing technologies for on-orbit satellite servicing, including refuelling, repair and de-orbiting.
Sarla Aviation – Building electric vertical take-off and landing (eVTOL) aircraft for urban air mobility.
Varaha – Leveraging remote sensing and blockchain technologies for agriculture-based climate solutions in developing markets.
Israel
NeoLogic – Developing quasi-CMOS microprocessor technology to reduce chip power consumption and size.
Ray Security – Delivering AI-driven proactive cybersecurity to limit data access and prevent ransomware attacks.
Japan
3DC – Developing graphene meso-sponge materials to address electrode expansion challenges in batteries.
Fermelanta – Producing rare plant-based ingredients for medicine and cosmetics through microbial fermentation.
Godot – Combining behavioural science and AI to advance human augmentation technologies.
NanoQT – Building quantum interconnects compatible with optical fibre for long-distance quantum communication.
OptQC – Developing photonic quantum computers that leverage light for practical applications.
Kenya
Pezesha – Connecting micro, small and medium-sized enterprises to credit and supply chain finance through embedded finance infrastructure.
Mexico
OTIF – Operating an online booking platform connecting shipping companies, logistics providers and customers.
Saudi Arabia
intella – Providing Arabic-first speech-to-text and analytics solutions for call centres and media.
Nommas Technologies – Developing AI-powered visual inspection systems for manufacturing quality control.
Singapore
Gero – Integrating physics and AI to accelerate drug development for age-related diseases.
Sentient Labs – Empowering the development of open-source AGI.
SixSense – Providing a no-code deep learning platform for computer vision applications in manufacturing.
Slovenia
Sunrise Robotics – Developing autonomous robotic cells with AI-powered perception for manufacturing.
Republic of Korea
A-Robot – Building humanoid and service robots designed for human-robot coexistence.
bitsensing – Developing radar solutions for vehicle safety, urban traffic management and healthcare monitoring.
RLWRLD – Building foundation models that enable robots to perceive and manipulate physical environments.
SDT – Providing edge computing and internet-of-things hardware for enterprise digital transformation.
Switzerland
Atinary Technologies – Offering a no-code AI platform for self-driving laboratories to accelerate molecule and materials research and development.
Metafuels – Converting green methanol into sustainable aviation fuel.
United Arab Emirates
Fasset – Delivering stablecoin-powered banking, international payments and investment access.
United Kingdom
Caristo Diagnostics – Building AI-driven imaging to detect and predict cardiovascular disease.
Epoch BioDesign – Engineering AI-designed enzymes for low-temperature biorecycling of nylon polymers.
IONATE – Developing hybrid intelligent transformers for smart grid power flow control.
MatNex – Accelerating materials discovery through AI-driven quantum calculations.
Opna – Building the coordination, verification and financing layer for critical power equipment.
Paid – Building business infrastructure for AI agents, including pricing, billing and renewals.
Sitehop – Delivering 200Gbps full duplex encryption for enterprise network infrastructure.
Uplift360 – Advancing chemical recycling technologies for carbon fibre and advanced composites.
United States
Adaption Labs – Developing adaptive AI systems that continuously learn and evolve across industries.
Albert – Providing an AI platform for materials science research and laboratory data management.
Alta Resource Technologies – Deploying novel refining technologies to produce high-purity minerals more efficiently and sustainably.
AOA Dx – Combining AI and biomarkers for early-stage cancer detection through liquid biopsy.
Autonomize – Using AI to contextualize unstructured clinical data and improve patient outcomes.
DeepLook Medical – Developing medical imaging AI for cancer visualization across ultrasound, CT and MRI.
Emerald AI – Enabling data centres to dynamically adjust power usage and stabilize electricity grids through AI.
Endolith – Using AI-guided microbes to recover copper from low-grade ore with lower energy consumption.
GridCARE – Forecasting electricity grid capacity with generative AI to support data centre development.
Hello Robot – Building open-source mobile manipulators for embodied AI research and education.
Helios – Predicting agricultural commodity prices and supply chains through AI-powered analytics.
Hertility – Offering at-home diagnostic testing and personalized care plans for hormonal health, fertility and menopause.
Inception Labs – Developing diffusion large language models that power applications such as coding assistance, voice interaction and search optimization.
Interlune – Building machinery to extract helium-3 from the lunar surface.
Istari Digital – Delivering digital twin and simulation technologies for aerospace and defence.
Kredete – Providing mobile banking and credit-building services for African immigrants in North America.
Laminar – Combining AI-driven precision automation with spectral sensors for industrial manufacturing.
Lunar Outpost – Developing space robotics and lunar surface mobility systems.
Mantel – Advancing molten-salt carbon capture for high-temperature industrial processes.
Mazama Energy – Harnessing superhot rock geothermal energy for renewable power generation.
Northwood – Building ground networks powered by phased array technology to support space operations.
Odyssey – Developing general-purpose world models capable of predicting and interacting with real-world environments over extended periods.
Overview Energy – Advancing manufacturing technologies for aerospace energy systems.
Parallel Bio – Combining human immune organoids and AI to improve drug safety prediction and discovery.
Pow.Bio – Building continuous fermentation platforms that reduce production costs by separating growth and production phases.
Power to Hydrogen – Producing hydrogen from renewable electricity using anion exchange membrane electrolyzers.
Pure Lithium – Developing lithium metal vanadium batteries for electric vehicles and grid storage.
QuSecure – Delivering post-quantum cryptography solutions to protect against future cybersecurity threats.
Rainmaker – Enhancing precipitation through cloud seeding, drones and weather modelling for agriculture.
Realta Fusion – Building compact modular fusion systems for zero-carbon industrial heat.
Reditus Space – Enabling microgravity manufacturing and hypersonic re-entry as a service.
Samaya AI – Developing AI agents for financial research, analysis and decision-making in asset management.
Savor – Producing real fats directly from carbon without relying on animals or farmland.
Skyfire – Enabling AI agents to conduct commerce through identity verification and payment infrastructure.
Stepful – Empowering communities with accessible pathways to healthcare careers through training and certification programmes.
Tern – Developing satellite-free navigation systems for vehicles and defence using real-time mapping data.
Tradeverifyd – Helping enterprises monitor and address supply chain risks in line with regulatory and financial requirements.
Vaulted Deep – Permanently removing carbon through geological sequestration of carbon-rich biomass waste.
Venus Aerospace – Developing reusable hypersonic flight systems powered by detonation ramjet engines.
VESSL AI – Providing an MLOps platform for training and deploying AI models at scale.
Voltai – Building AI models for next-generation semiconductor technologies.
WindBorne – Delivering AI weather forecasting through a global network of long-duration smart balloons.
Zartico – Using AI to deliver the clearest view of visitor behaviour for the tourism industry.
About the Technology Pioneers
Launched in 2000, the Technology Pioneers is a leading community for early-stage companies from around the world that are shaping the future through breakthrough technologies and innovations. These companies are selected for their potential to have a significant impact on business and society and are invited to engage with public and private sector leaders through the World Economic Forum’s global platform.
The Technology Pioneers community is part of the Innovator Communities at the World Economic Forum, which convene the world’s leading global start-ups across different growth stages from early-stage Technology Pioneers to growth-stage Global Innovators and unicorn companies valued at more than $1 billion.
About the Annual Meeting of the New Champions 2026
The 17th Annual Meeting of the New Champions will take place from 23 to 25 June 2026 in Dalian, People’s Republic of China, under the theme “Innovating at Scale”. The meeting will bring together 1,500 cross-sector leaders to explore how innovation and emerging technologies can unlock new growth models and drive positive economic momentum in a fast-shifting global landscape.
Canadian retail gasoline prices have soared since the start of the Iran war – even though Canada ranks fourth globally in annual crude oil production, behind only the United States, Russia and Saudi Arabia.
If we have so much oil, why are our gas prices high?
Start with retail markets. In most of Canada, gasoline retailers are free to set prices. In doing so, they think of their costs, their competitors’ prices and how consumers will react. They’re less concerned about what they paid for the fuel they’re selling than what it will cost to replace it next time they order a gasoline shipment. So, when the wholesale price rises, they adjust their own prices quite quickly.
Rockets and Feathers
Conversely, when prices fall, they end up in a game of chicken with their competitors. The station that cuts prices first does sell more fuel but it makes less profit on each litre. Retailers balance the profit they make from more volume against their reduced margin. This leads to a phenomenon some economists call “rockets and feathers.” Prices rise fast and fall slowly.
As consumers it’s tempting to think we’re getting ripped off. But, over time, gas stations really aren’t big profit engines. They make a bit of money when wholesale prices fall, less when wholesale prices rise. Overall, they make enough to pay for their staff and inputs while getting a fair return on their investment.
Working backwards through the story, gas stations buy gas from a wholesaler. Sometimes they buy from the same brand (i.e., a Shell station buys its fuel from a Shell wholesaler) but often there’s no connection: Retailers buy the cheapest gas available. There are fewer wholesalers than retailers but the wholesale market is competitive, too. Gasoline is pretty much the same no matter who you buy it from so it’s hard for any single wholesaler to charge a higher price than its competitors. Wholesalers, like retailers, set prices based on their competition and the replacement cost of their inventory. More rockets and feathers.
To summarize: Retail prices spike with wholesale prices, and wholesale prices spike with crude oil prices.
And why are Canadian crude oil prices rising when we are half a world away from Iran? Because global oil markets are linked and Canadian producers prefer more profit to less. When a Canadian producer markets its crude, it looks for the highest bidder. If it can sell to an export partner for a higher price, it will. Canadian refineries therefore need to match that price to buy oil for domestic use.
This is a feature, not a bug.
Canada and the United States are the only two major oil-producing nations with competitive crude oil markets. All other producing nations co-ordinate production through state-owned enterprises. Canadian oil companies, though large in absolute terms, are small relative to their international rivals. This makes them price-takers.
A Canadian firm can’t simply decide to charge more, the way OPEC producers can. They’re too small to influence global markets. They’re also prohibited by law from colluding with each other to drive up prices. As a result, though Canadian producers may well benefit from rising global crude oil prices, they can’t cause them.
Canadian producers could offer lower prices to domestic refineries, but that’s against their own interests and would reduce their profits. Preferencing the domestic market with lower crude oil prices would also risk damaging our trade relationships.
A fundamental rule of economics is that prices and quantities are linked. As the quantity of globally available crude oil falls, prices rise for crude and gasoline alike. As gas prices go up, we consume less gasoline and by extension less crude oil. That’s how global market systems balance supply and demand.
If we artificially suppress prices for Canadian consumers (and only Canadian consumers) we end up consuming more gasoline domestically and exporting less oil. Drivers would benefit but the reduction in exports would lower our incomes, damage our terms of trade and hurt our reputation as a reliable trade partner.
Yes, when world oil prices rise Canadian oil producers make higher profits. But they aren’t “gouging” consumers and this isn’t a federal or provincial policy failure. It’s the global market doing what it’s supposed to do. [A point to consider: last year the highest octane fuel available, 94 was selling for on average $2.00/L in Southern Ontario. Today that fuel sells for on average $2.12/L meaning an increase of 6% in cost. Yet the most common octane fuel: 87 has seen an increase of (avg. of $1.40/L vs today’s rate of $1.83/L) of 25%. Shouldn’t the % increases in fuel be the same? CP]
Kent Fellows is assistant professor (Economics) and Associate Program Director of the Canadian Northern Corridor research program at The School of Public Policy, University of Calgary and fellow-in-residence at the C.D. Howe Institute.
94% of cyber leaders identify AI as the defining force in cybersecurity, with 77% of organizations using it in cyber operations.AI is accelerating cyber threats and defences alike, forcing organizations into a high-speed race against cyber criminals.AI adoption in cybersecurity is moving from pilots to real-world deployment, with clear gains in vulnerability identification and threat detection.
Geneva, Switzerland, May 2026 – Artificial intelligence is rapidly reshaping cybersecurity and is the biggest driver of change in the field, according to a new World Economic Forum report. Some 94% of cyber leaders identify AI as a defining force and 77% of organizations already use it in their cyber operations.
The AI and Cyber: Empowering Defenders report, developed in collaboration with KPMG, highlights measurable gains in cost reduction, response speed and resilience. While threat actors increasingly weaponize AI to automate deception, generate malware and scale attacks at machine speed, the report indicates that organizations deploying AI strategically are achieving significant advantages. Organizations that extensively leverage AI in security reduce average breach costs by up to $1.9 million and shorten breach lifecycles by approximately 80 days.
“AI has the potential to shift the balance towards defenders,” said Akshay Joshi, Head of the Centre for Cybersecurity, World Economic Forum. “Organizations that treat it as a strategic capability, rather than a standalone tool, will be better placed to turn growing cyber risk into resilience and competitive advantage.”
Building on the Forum’s 2025 publication, Artificial Intelligence and Cybersecurity: Balancing Risks and Rewards, the 2026 edition focuses on how organizations are deploying AI for defence in practice. As enterprise attack surfaces expand to include hundreds of thousands of internet-facing assets, the scale and complexity of cyber risk are increasing significantly. Among the examples featured, KPMG reports a 25% increase in operational efficiency in threat intelligence, Accenture cut security analysis time in more than 100,000 internet-facing sites from 15 minutes to under one minute, and IBM’s ATOM platform helps scale global 24×7 threat detection and response, automating more than 850 analyst hours a month and cutting end-to-end investigation time by 37%.
“Attackers are moving faster and at greater scale than ever before. This report is a call to action for organizations to match that pace, with AI as a force multiplier for cyber defence,” said Laurent Gobbi, Partner, Global Head of Cyber & Tech Risk, KPMG.
The report emphasizes that AI’s value in cybersecurity lies in augmenting human expertise, accelerating decisions and strengthening resilience, rather than automation alone. The report highlights that its impact depends on clear AI deployment strategy, rigorously tested use cases before scaling, and strong governance and human oversight from the outset.
The report draws on 20 real-world case studies and insights from one-on-one interviews and workshops conducted under the World Economic Forum’s Cyber Frontiers: AI & Cyber initiative, convening 105 representatives from 84 organizations across 15 industries.
As cyber risks become more complex, the report calls on business and government leaders to treat AI as a foundational security capability, investing not only in technology but also in the skills, processes and governance required to defend at machine speed.
About Cyber Frontiers: AI & Cyber The Cyber Frontiers: AI & Cyber initiative, launched in 2024, brings together a global multi-stakeholder community to explore how AI is reshaping cybersecurity through a knowledge-sharing platform. The initiative equips organizations with insights to harness AI technologies to strengthen their cybersecurity capabilities along with guidance for building strong guardrails. The initiative aims to develop approaches to enable secure and scalable adoption of agentic AI to ensure a secure agentic economy.
A World Economic Forum report finds competitive advantage is shifting from owning key technologies to combining them across data, people and ecosystems.
The biggest barriers to scaling innovative solutions are no longer individual breakthroughs but connecting a combination of AI and digital tools with real-world operations.
The research shows how technology convergence is already reshaping value chains in healthcare, manufacturing, energy, life sciences, wearable electronics and more.
Geneva, Switzerland, April 2026 – The next wave of competitive advantage will come not from individual breakthrough technologies but from the ability to combine and scale multiple technologies across entire operating systems, according to a World Economic Forum report released today. As artificial intelligence, robotics, advanced materials, spatial computing and next-generation energy systems mature simultaneously, the organizations and countries moving fastest to apply these technologies together in intelligent systems are already pulling ahead.
The report, Technology Convergence: The New Logic for Competitive Advantage, produced in collaboration with Capgemini, draws on cross-industry research and real-world case studies in 12 sectors, identifying recurring patterns, including the blending of mature and experimental technologies and the blurring of industry boundaries, that determine whether convergence scales or stalls.
“Breakthrough technologies are advancing rapidly, and value is created when they are applied together,” said Cathy Li, Head of the Centre for AI Excellence and Member of the Executive Committee, World Economic Forum. “The real differentiator is not who owns the most advanced tools, but who can combine them across systems and applications at scale.”
As advanced technologies scale, the main bottlenecks to competitive advantage are no longer time or materials but how well organizations connect digital tools with physical operations. This is already playing out across sectors and geographies. From operating rooms to factory floors, power grids to research labs, converging technologies are reshaping how systems perform worldwide.
In the United Kingdom, novel surgical robots are extending clinician capacity (this article’s feature image shows robots with surgeons at West Hertfordshire Teaching Hospitals NHS Trust first used in 2022) while preserving workflow continuity across care teams. In China, automated labs are linking robotics, AI and data platforms to accelerate discovery while coordinating workflows across research networks.
“Technology convergence has evolved from a technical discussion into a strategic leadership mandate with direct operational impact,” said Aiman Ezzat, CEO of Capgemini Group. “Competitive advantage increasingly depends on an organization’s ability to integrate technologies, teams, partners and operating processes into coherent systems that deliver value at scale. Leaders who master orchestration, not just adoption, are the ones translating convergence into sustained performance and growth.”
“This shift has implications not only for companies but also for national growth strategies and industrial policy,” said Jeremy Jurgens, Managing Director, World Economic Forum. “Economies that align talent, infrastructure, data and policy will be better positioned to capture the benefits of converging technologies amid a fast-shifting global landscape.”
The report is part of the World Economic Forum’s Technology Convergence Initiative, launched in 2024, and builds on the first edition published in 2025. It draws on two years of cross-industry research, including expert interviews, workshops and case studies in healthcare, manufacturing, energy, life sciences and emerging fields such as brain-computer interfaces. The analysis examines how eight advanced technology domains interact, using the Forum’s 3C framework (combination, convergence and compounding) and the Technology Maturity Index to track how technologies move from experimentation to real-world impact.
Digital privacy expert explains why often accepting cookies poses cyber risks
According to new research by our friends at NordVPN– one of the world’s most advanced VPN service providers , only 3,5% of Canadians never accept cookies. To make matters worse, a whopping 43% say they always accept cookies. While most HTTP cookies are safe, some can be used to track people without their consent. Even more, cookies can sometimes be spied upon or used to fake the identity of a user, to gain access to their account or use their identity to commit a crime.
“HTTP cookies are vital to the internet, but they are also a vulnerability to people’s privacy. As a necessary part of web browsing, cookies help web developers to provide more personal, convenient website visits. Because of cookies, websites remember you, your logins, shopping carts, and even more. But they can also be a treasure trove of private information for criminals to spy on,” says Daniel Markuson, a digital privacy expert at NordVPN.
What are cookies, and why are they a threat?
Also known as an HTTP cookie or browser cookie, a cookie is a piece of data that’s stored on your browser whenever you visit a website. When enabled, the website will remember your preferences and any small changes you made during your last visit.
Are Cookies Normal and Necessary?
Cookies are a normal and necessary part of the internet. Without them, you couldn’t log into a website or fill your online shopping cart. However, too many cookies can become a threat to both your security and privacy.
“People need to be aware that cookies follow you online. Even if you hide your IP address with a VPN, cookies can track what you do online and form a partial ID of who you are. Moreover, third parties can sell your cookies. Some sites earn revenue by serving third-party cookies. These aren’t functional – their purpose is to turn a profit from your data. Also, cookies are a vulnerability. With the wrong browser settings or when visiting the wrong website, cookies can introduce security vulnerabilities to your browsing experience,” says Daniel Markuson.
68,5% of Canadians feel that their online data is used for targeted ads
NordVPN research shows that Canadians feel the consequences of collected cookies:
68,5% feel that their online data is used for targeted ads;
66% feel that it’s being sold to other companies.
Moreover, 57% and 53% respectively believe that their data is analyzed by websites for their internal use and that it’s used by social media platforms for people to find the most relevant information
“Canadians must be pretty aware of the constant pop-up requesting them to ‘Accept all cookies?’ while visiting online websites. It happens in order to comply with data privacy laws, which were designed to protect users’ personal information and force companies to state what kind of data is being collected and how it is being used,” says Daniel Markuson.
How to stop cookies from tracking you
There are plenty of tools and tips to make your online activity more private.
“First, navigate to your browser’s settings and choose to delete all the cookies stored in your browser. Most browsers also offer features to block unnecessary cookies automatically. Second, use incognito mode. While incognito mode does not equal privacy, this is exactly what it was made for — setting aside a single browsing session that won’t save cookies and your history.
Finally, use a VPN. One of a VPN’s core features is to hide your IP address, which is critical if you want your online searches to stay private. Quite recently, NordVPN launched the Threat Protection feature, which offers a tracker blocker. That means that third-party cookies won’t be able to gather data about people’s browsing habits and create a detailed profile on you. So you can use online services in privacy,” says Daniel Markuson.
Methodology: Though the survey was commissioned by NordVPN and conducted by the external company Cint on October 4-12, 2021, the results and browsing trends continue into today. The survey’s target group was residents of France, the USA, Canada, Australia, Germany, Spain, the Netherlands, and Poland aged 18+ (nationally representative), and the sample was taken from national internet users. Quotas were placed on age, gender, and place of residence. 7800 people were surveyed in total, made up of 800 people from Spain and 1000 people from each of the remaining countries.
The trouble is that automobiles, like everything else, are subject to the law of entropy.
“Preservation” is about more than just keeping the odometer reading low. “Like-new” means something different after one, two, or three decades, even if the car still has plastic wrap on the steering wheel. The paint, upholstery, and trim may look flawless—but what about the bits you can’t see, like the complex systems and different materials that make up the driveline? Just because a car is like-new doesn’t mean it actually is new, or that you can just hop in and drive it home. We decided to call up some experts across the industry to answer a big question: What exactly is happening to a car when it sits?
The Henry Ford Museum/Wes Duenkel
First off, what’s happening to it while it sits depends on where it sits.
Imagine a car in a museum—perhaps the Le Mans–winning Ford Mark IV at the Henry Ford Museum in Dearborn, Michigan. Now, think of that old pickup you once saw sitting in a field. Technically, they’re both decaying. One is just decaying far more slowly than the other.
The race car lives in a perfectly curated world. The temperature in the museum is consistent and the humidity is just so: Low enough to deter moisture-loving insects and mold, high enough to prevent the tires and other rubber seals from drying out. A museum car’s tires may barely touch the ground, because the chassis sits on jack stands. The fluids in the car—fuel, coolant, oil—have either been drained or supplemented with stabilizing agents. The upholstery is regularly vacuumed to eliminate pests. Dust barely gathers on the body before someone gently sweeps it off.
The wheel of The Henry Ford’s 1967 Ford Mark IV race car, with its original tire. The Henry Ford Museum
The pickup, meanwhile, has been at the mercy of the weather for who knows how long. The tires have cracked and rotted. Salty air might be corroding metal. Insects and/or rodents might be living inside the cabin and engine bay. The engine’s cylinders may be dry, the gas in its rusty fuel tank a kind of goo, the oil gray instead of honey-colored. Its paint may be bubbling, its carpets mildewing.
Those are two extreme examples, of course, but when it comes to the condition of a car, the storage (or display) environment makes all the difference, whether the car is Henry Ford’s original Quadricycle from 1896 or a brain scientist’s sporty Sentra from 1992. To keep a “like-new” car living up to its descriptor, the temperature must be consistent; otherwise, even the most immaculate car will bake, sweat, and/or freeze. The moisture in the air needs to be high enough to slow the decay of organic materials like tires but low enough to protect from rust. The room itself needs to be well-sealed to deter pests. The vehicle also needs a barrier (or two) between the paint and the dust, dirt, and grime that will accumulate. And that’s only the parts of the car you can see …
The Odometer Doesn’t Tell the Whole Story
Tom’s 16,000-mile/ 25,750-kilometer Porsche, where he found it. Youtube / Hagerty
The Barn Find Hunter
No one is more familiar with finding automotive diamonds in rough storage situations than Tom Cotter, known as The Barn Find Hunter. When I called him to discuss this story, the consequences of bad storage were especially fresh on his mind: He had just bought a barn-find car (a 1986 Porsche 930 Turbo) with 16,000 miles. “That’s the good news,” he said. “The bad news is that it has not been driven since 1996, so nearly 30 years. And even though it had a plastic sheet on it, somehow it got filthy. Filthy. My heart breaks.” Even worse, the windows were open, and the car was infested with mice. It needs a thorough recommissioning: brakes, gas tank, fuel lines, fuel injection unit, fuel injector, fuel pump—and those are just the major areas, says Tom. He’s still in the process of figuring out how much the car needs, but if everything needs to be replaced, the work could cost as much as $40,000 usd/ $58,000 cad. Oh, and he’ll need a new set of tires—the car was parked on its original set from 1986.
“Just because a car has low miles doesn’t mean it was well cared for,” says Cotter. “Cars go bad when they sit.” A perfect storage environment and a sedentary life don’t guarantee stasis, either: “There are things that happen inside the systems of a car that break down, like the rubber in a brake system or the rubber in our fuel system. It doesn’t matter if the car is hot or cold or clean or dirty, those things are going to break down.” One interesting system that is especially prone to degrading when a car sits is the exhaust, he says. “For every gallon (3.785 liters) of fuel that’s burned in a car, a gallon of water comes out the tailpipe. It’s just part of the combustion process. And so if you run the car and then turn it off and park it for 20 years, you’ve got at least a gallon of water (3.785 liters) sitting in the exhaust system—most of it, in the muffler. Unless it’s made of stainless steel or something, it’s going to just rot right out. There’s really nothing you can do about that.”
The fluids and the metals in a car are often conspiring against each other.
“One of the biggest challenges you have managing large collections—and with cars that sit, too—is coolant system corrosion,” says Scott George, curator of collections at the Revs Institute in Naples, Florida, who knows a thing or two about keeping old cars in peak health. “You’ve got brass, copper, aluminum, iron, steel, all coming in contact with water, and it can create a battery of sorts. It can almost create its own internal energy, which can attack certain metals that are most vulnerable,” like the vanes in a water pump, which are often made of a different metal than the pump itself. Using antifreeze doesn’t eliminate the problem: Those systems can corrode, too, damaging hose connections and water chambers in cylinder heads. “Corrosion in radiators, and things that attack solder and solder seams, are also a big challenge for anybody with large collections.”
Proper storage requires understanding of the car’s construction, because certain materials require special attention and/or precautions. Wool and horsehair, materials that are especially common in the upholstery of cars built before World War II, can attract cloth moths and carpet beetles. Cuong Nguyen, a senior conservator at The Henry Ford, who is heavily involved in the care of the museum’s 300-car collection, suggests vacuuming such cars each season. He also warns that some more modern wiring harnesses are made with soy-based materials that, while eco-friendly, attract mice. Sticky traps, he says, especially those without pheromones, can be good preventive measures for furry pests.
Understanding how a car is built also helps set expectations for how it ages, even in the best conditions. For instance, different sorts of paints wear differently: Lacquer-based paint, used on most cars built before the late 1980s or early ‘90s, doesn’t hold up as well as the more modern, urethane-based version. Another notoriously finicky modern material covers the soft-touch buttons found in some Italian exotics from the 1990s or early 2000s. The black material gets sticky over time.
Cotter, who owns a storage facility called Auto Barn in North Carolina, encourages enthusiasts to store their vehicles thoughtfully because they’re protecting their financial investment. “It might take you a half-day to get a car ready to lock up, but put a little bit of effort into it. You are maintaining your investment. It’s a mechanical portfolio. A car that’s parked haphazardly will more than likely go down in value.”
The best place to store a car—with any odometer reading—is in a clean, dry place with temperature and humidity control. To avoid flat spots on the tires, which can develop within a year, the car should be elevated, just slightly, on jack stands (as mentioned above, a trick used by museums) or lowered onto a set of tire cradles. If the fuel isn’t drained, it should be ethanol-free; the regular stuff turns into a gummy, gooey mess when it sits. If the fuel in the tank does contain ethanol, it should be supplemented with a fuel stabilizer. If the car was driven regularly before storage, the carpets in the driver’s side footwell should either be completely dry or propped up, away from the floorboards. Cotter explains why: moisture from the driver’s shoes may get onto and under the carpets, and it may mold the carpets or, worse, become trapped between the rubber backing and the sheet metal underneath, which may begin to rust.
Some sort of rodent protection, even a Bounce sheet, should be taken. (This nifty device, called Mouse Blocker, uses sonic pulses to keep the critters at bay.) One moisture-absorbing trick that Cotter recommends is cheap, and readily found at your local hardware store: charcoal, which absorbs moisture and odors. Ideally, the paint should be waxed and the car put under a cover. Feeling fancy? Look into a Car Capsule, the “bubbles” that the Detroit Historical Society uses to store its cars.
YouTube / Hagerty
While in Storage
Of course, not all low-mile cars are barn finds like Tom’s Porsche. Many of them present amazingly well. Scott George weighs in. There’s an excitement, he says, about buying a car that appears locked in time and cosmetically perfect—free of nicks, scrapes, bumps, wrinkles. But some people, he says, may not think about what they’re getting into at a mechanical level: “Every time I see a later-model car sell with low mileage, what often goes through my mind is ‘cha-ching, cha-ching, cha-ching.’” He’s seen what can happen when cars sit for 25 or 30 years: “Everything functioning part of the automobile, maybe except for a total engine rebuild, has to be redone.”
Not all buyers may want to drive their pristine, low-mile prize, he admits—some may simply want to be the next owner, to park the car in their climate-controlled showroom as a trophy. There is nothing wrong with that, of course, but down the road, it may be a very costly one—if not for them, for the next person who buys it and wants to drive it. “Cars are operating machines,” George says. “They like to drive.”
At the very least, a car should be started once in a while, and run for more than 5 or 10 minutes—half an hour or so, at least, so that the engine and oil can come up to temperature and cooling fluids can fully circulate. Starting a car and quickly turning it off, says Cotter, “does more damage than if you just leave it alone because the cylinders are dry—there’s not enough oil in the system.”
Acids and moisture can build up, warns George, if a car doesn’t run long enough, “and exhaust systems can corrode from the inside out, and so forth.” He practices what he preaches: The Revs Institute has an unusually high commitment to keeping most of its 120-something collection running, and that means driving the cars—on a circuit loop, for the road cars, or on track, for the race cars, whether that’s at a historic racing event or during a test day where Revs rents out a facility.
Where a car is stored may make the most difference in preserving its condition, but how it is maintained during that period is a close second. “I have witnessed actually cars that 25 or 30 years old that literally sat,” says George, “and I’ve seen it firsthand: every functioning part of the automobile, maybe except for a total engine rebuild, has to be redone. The fuel systems, the fuel injectors, all of that stuff.” Maintaining a low-mile car in driving condition requires a balance of commitment and restraint: “There are some people that have just had these wonderful low-mileage cars,” says George, “and they have done annual maintenance and they have cared for the mechanical systems. They’ve just been cautious about how many mile miles they’ve put on.”
In short, the best way to keep a car in driving condition is to, well, drive it.
“Just because a car has low miles doesn’t mean it was well cared for,” says Cotter. “Cars go bad when they sit.” A perfect storage environment and a sedentary life don’t guarantee stasis, either: “There are things that happen inside the systems of a car that break down, like the rubber in a brake system or the rubber in our fuel system. It doesn’t matter if the car is hot or cold or clean or dirty, those things are going to break down.” One interesting system that is especially prone to degrading when a car sits is the exhaust, he says. “For every gallon of fuel that’s burned in a car, a gallon of water comes out the tailpipe. It’s just part of the combustion process. And so if you run the car and then turn it off and park it for 20 years, you’ve got at least a gallon of water sitting in the exhaust system—most of it, in the muffler. Unless it’s made of stainless steel or something, it’s going to just rot right out. There’s really nothing you can do about that.”
The fluids and the metals in a car are often conspiring against each other. “One of the biggest challenges you have managing large collections—and with cars that sit, too—is coolant system corrosion,” says Scott George, curator of collections at the Revs Institute in Naples, Florida, who knows a thing or two about keeping old cars in peak health. “You’ve got brass, copper, aluminum, iron, steel, all coming in contact with water, and it can create a battery of sorts. It can almost create its own internal energy, which can attack certain metals that are most vulnerable,” like the vanes in a water pump, which are often made of a different metal than the pump itself. Using antifreeze doesn’t eliminate the problem: Those systems can corrode, too, damaging hose connections and water chambers in cylinder heads. “Corrosion in radiators, and things that attack solder and solder seams, are also a big challenge for anybody with large collections.”
Proper storage requires understanding of the car’s construction, because certain materials require special attention and/or precautions. Wool and horsehair, materials that are especially common in the upholstery of cars built before World War II, can attract cloth moths and carpet beetles. Cuong Nguyen, a senior conservator at The Henry Ford, who is heavily involved in the care of the museum’s 300-car collection, suggests vacuuming such cars each season. He also warns that some more modern wiring harnesses are made with soy-based materials that, while eco-friendly, attract mice. Sticky traps, he says, especially those without pheromones, can be good preventive measures for furry pests.
Understanding how a car is built also helps set expectations for how it ages, even in the best conditions. For instance, different sorts of paints wear differently: Lacquer-based paint, used on most cars built before the late 1980s or early ‘90s, doesn’t hold up as well as the more modern, urethane-based version. Another notoriously finicky modern material covers the soft-touch buttons found in some Italian exotics from the 1990s or early 2000s. The black material gets sticky over time.
Best-Case Storage Scenario
Cotter, who owns a storage facility called Auto Barn in North Carolina, encourages enthusiasts to store their vehicles thoughtfully because they’re protecting their financial investment. “It might take you a half-day to get a car ready to lock up, but put a little bit of effort into it. You are maintaining your investment. It’s a mechanical portfolio. A car that’s parked haphazardly will more than likely go down in value.”
The best place to store a car—with any odometer reading—is in a clean, dry place with temperature and humidity control. To avoid flat spots on the tires, which can develop within a year, the car should be elevated, just slightly, on jack stands (as mentioned above, a trick used by museums) or lowered onto a set of tire cradles. If the fuel isn’t drained, it should be ethanol-free; the regular stuff turns into a gummy, gooey mess when it sits. If the fuel in the tank does contain ethanol, it should be supplemented with a fuel stabilizer. If the car was driven regularly before storage, the carpets in the driver’s side footwell should either be completely dry or propped up, away from the floorboards. Cotter explains why: moisture from the driver’s shoes may get onto and under the carpets, and it may mold the carpets or, worse, become trapped between the rubber backing and the sheet metal underneath, which may begin to rust.
While in Storage
Of course, not all low-mile cars are barn finds like Tom’s Porsche. Many of them present amazingly well. Scott George weighs in. There’s an excitement, he says, about buying a car that appears locked in time and cosmetically perfect—free of nicks, scrapes, bumps, wrinkles. But some people, he says, may not think about what they’re getting into at a mechanical level: “Every time I see a later-model car sell with low mileage, what often goes through my mind is ‘cha-ching, cha-ching, cha-ching.’” He’s seen what can happen when cars sit for 25 or 30 years: “Everything functioning part of the automobile, maybe except for a total engine rebuild, has to be redone.”
SPOTLIGHT: The Casio SK series keyboards, carries great nostalgia for many who grew up in the 80s and 90s.
My friend got one for his birthday, and after spending an entire day at his place sampling burps, coughs and farts, I knew I was destined to become an electronic musician. If this is your story too- let us know below in the comments section.
The SK line’s distinctive design and sound evoke memories of early bedroom-made electronic music and hip-hop production, making it a sought-after collector’s item. The SK sound quality is characterized by its lo-fi charm. Everything sampled into it sounds like crap, but in a good way!
Used prominently on my 2008 release of AUDIOCOSM by Jarrod Barker, the SK-8 was used as a sampling beat box and also one or two of its famous presets were used in a loop to create swirling matrices of sound on a number of tracks. I found this keyboard in a thrift store in 2007 buried in the children’s electronic toys. It was $2.99 CAD and even had the battery cover. This fortuitous discovery was the spark that led to the writing and recording (on a boat no less!) of AUDIOCOSM.
The rare white version of the SK-10.
At their absolute basic, the SK line are fun keyboards and a great introduction tool to lo-fi sampling. But there is much more.
After recording a short audio sample (recorded either via the built in monophonic microphone or by plugging in an audio source using the 1/8″ female jack) you can choose from various envelopes (settings that affect how the sound starts, how long it sounds and how it ends) and also select whether to reverse or loop samples. These toy synthesizers are a treat when connected via guitar effects pedals. A good outboard effect can transform these keyboards into something much more powerful and believable. If that isn’t enough you can explore the factory preset sounds some of which sound more realistic than others but all have usefulness in the correct setting.
Most SK’s have a decent enough piano, vibraphone, flute, trumpet and clarinet sounds. There are also built-in speakers that are loud enough for mobile use such as camping or beach hang outs and of course the SK’s run on batteries. They also have line out feature which bypasses the onboard speakers allowing you to record them into your favorite DAW or standalone recording machine….an analog 4 track is a great bedfellow.
The Mod community and the SK (circuit bending)
Due to it’s relative affordability (used prices have continued to rise in the past 10 years) the SK series of keyboards have been embraced by electronic musician modifiers. Their basic construction and ease of internal access makes modifying them a lot of fun. The creativity of modders seems to be endless- everything from MIDI control to individual audio outputs to real time control of sound chips using dip switches or rotary controls.
Join that thriving community by buying this one from our friend at Tone Tweakers today! For the Silo, Jarrod Barker.
April, 2026 – Capital spending on AI has surged into the hundreds of billions, yet the economic payoff remains elusive. Despite rapid investment and widespread experimentation with generative AI tools, measurable productivity gains have yet to show up clearly in aggregate data across advanced economies – raising an important question: who will be first to turn this momentum into measurable gains?
In “From Hype to Output: How AI Investment Translates to Real Productivity Gains,” I discovered that while AI offers a path to stronger economic performance and could help address Canada’s long-standing productivity challenges, realizing these gains will require policies that accelerate business adoption and diffusion, which remain uneven across most industries and regions. This includes removing barriers, ensuring access to data resources and encouraging integration across firms and sectors.
Artificial intelligence has renewed optimism about improving Canada’s long-standing productivity problem, but history shows that general-purpose technologies often take decades to produce measurable economy-wide gains. Early adoption typically produces modest improvements as firms experiment and invest in complementary assets such as data, skills, and organizational changes.
Canada performs reasonably well in international AI rankings and produces strong research output, but it lags leading countries in computing capacity and commercialization. Canadians are among the most frequent users of generative AI tools globally, yet business adoption remains uneven and relatively limited.
Canadian data show that about 12 percent of businesses currently use AI, and most report little change in employment following adoption. Many firms say AI is not relevant to their operations or lack the knowledge needed to implement it effectively, suggesting adoption barriers remain significant.
Policy should therefore prioritize accelerating AI adoption and diffusion across sectors while maintaining Canada’s research and infrastructure capacity. Governments can support this by improving regulatory clarity, expanding data access, strengthening AI literacy, and encouraging firms to experiment and integrate AI into their operations.
Introduction
Canada faces a persistent productivity challenge.
Growth in output per work-hour has stagnated for decades, and the gap with the United States continues to widen.1 Policymakers have long sought levers to reverse this trend, and the rapid emergence of artificial intelligence (AI) – particularly generative AI since late 2022 – has prompted renewed optimism that a transformative technology might finally deliver the productivity gains that have proved elusive.
This Commentary discusses the impacts of AI technologies, with a focus on more recent generative AI. In particular, these technologies are unique in their low barriers to adoption and use in terms of both skill and cost as generalized tools. With such low barriers to entry, there is potential for rapid adoption and scaling of AI technologies across many sectors of the economy. Yet enthusiasm must be tempered by evidence: general-purpose technologies (such as AI) historically take decades to reshape economies, and the path from adoption to measurable productivity growth is neither linear nor guaranteed.
This Commentary examines AI’s potential contribution to Canadian productivity growth through an evidence-based policy lens. It begins by establishing what AI technologies are and how technological change translates into economic output, drawing on the concept of the “productivity J-curve” to explain why early-stage adoption often fails to register in macroeconomic statistics. The paper then situates the current AI investment boom in a historical and international context and summarizes research quantifying both the infrastructure-driven and adoption-driven channels through which AI may affect GDP. A comparative analysis positions Canada among its international peers, revealing a paradox: world-class research output coexists with middling commercial translation and infrastructure capacity. Detailed examination of Canadian business adoption data shows significant variation across industries and provinces, with early signs that initial experimentation may be giving way to more selective, sustained implementation.
The central argument is that maximizing the likelihood that AI technologies will boost Canada’s productivity growth requires policy focused on accelerating AI adoption and diffusion across sectors. While government investment in computing capacity supports the domestic development of AI technologies (and democratizes access to computing power), government resource constraints, significant uncertainty about AI development trajectories, and the relatively smaller size of the Canadian AI economy suggest that AI infrastructure policies should focus on maintaining and improving Canada’s relative international competitiveness. Policies that encourage firms to experiment, learn, and eventually reimagine their operations around AI capabilities can position Canada to capture productivity gains as the technology matures. AI, as a generalized technology, can be deployed across many industries and is linked to other economic development and industrial policy priorities, including small- and medium-sized business growth and international trade diversification. This paper concludes with policy recommendations that balance the uncertain timeline of AI’s macroeconomic impact against the risk of falling further behind more aggressive international competitors.
The Current AI Boom in Context
The emergence of generative AI since late 2022 has triggered an unprecedented wave of capital investment and rapid enterprise adoption. This technological shift is reshaping economic growth dynamics through two channels: the direct contribution of infrastructure investment to GDP and longer-term productivity gains from AI adoption across industries. Understanding the magnitude, timing, and distribution of these effects is essential for policymakers seeking to position their economies to benefit from AI’s transformative potential. Much of this section refers to the US economy, where more data on AI investment and GDP effects are available.
Capital expenditure on AI infrastructure has reached historic proportions. Hyperscaler companies – Amazon, Google, Meta, Microsoft, and Oracle – allocated about $342 billion to capital expenditures in 2025, a 62 percent increase from the previous year (Aliaga 2025). Estimates suggest AI-related capital expenditures could reach US$527 billion in 2026 (Goldman Sachs 2025). This spending encompasses semiconductors, data centres, networking equipment, and the power infrastructure required to support “compute”-intensive AI workloads.
In Canada, the federal government announced $2 billion over five years starting in 2024-25 for the Canadian Sovereign AI Strategy, including $705 million for “compute” infrastructure. Microsoft has also announced it is spending $19 billion on AI infrastructure investment in Canada between 2023 and 2027, with $7.5 billion of that over the next two years (Smith 2025). Industry categories related to AI2 accounted for $195 billion in 2021 and grew to $229 billion in 2024, representing 9.3 to 10 percent of Canada’s GDP, respectively.
The impact of AI investment on the US economy is significant, though estimates vary widely. In the first nine months of 2025, GDP product categories related to AI investment (such as computing and communications equipment, data centre structures, software, and research and development) represented 37 percent of real GDP growth and 8 percent of real GDP (Levine 2025).3 Other estimates suggest AI contributed roughly 1 percentage point to US GDP growth in 2025 (Boussour 2025; Goldman Sachs 2025; Aliaga 2025), making it the second-largest contributor to growth after consumption (Singh 2026).4 The scale of investment in AI infrastructure in the US has led to debate about whether it is fueling an equity market bubble (BNP Paribas 2025; Barnette and Peterson 2025). There have been multiple “AI winters” in the past – periods of significant decline in enthusiasm, funding, and progress in the field of AI.5
However, much of the spending on AI infrastructure does not translate directly into domestic GDP because many inputs are imported – for example, semiconductors manufactured in Taiwan. This is particularly important for Canada, since both infrastructure inputs and the outputs of dominant AI companies (AI products and software) are predominantly located abroad. Secondary economic effects and labour dynamics associated with the expansion of infrastructure investment are also important to consider. Data centre construction has had significant impacts on the construction industry in the United States. The top 50 contractors by size have doubled revenues within a year, and salaries for trades workers are 32 percent higher for data centre projects compared to other construction (Paoli 2025). Once built, however, data centres require relatively few permanent workers.
There are also counter-balancing factors to consider. Corrado et al. (2025) show that while investment in data as an intangible asset can improve efficiency, the growing importance of proprietary datasets slows the diffusion of innovation. So far, the negative impact on diffusion outweighs the efficiency gains from intangible data capital.
Currently, the main channel through which AI is measurably increasing US GDP is capital expenditures. Over the longer term, however, these investments must translate to products and services that meaningfully increase productivity to have a sustained effect on growth. So far, the acceleration of AI development and diffusion has not been associated with higher productivity growth at the macroeconomic level across G7 countries (Filippucci et al. 2024; Andre and Gal 2024; Goldin et al. 2024). As with earlier general-purpose technologies, widespread productivity gains may take years to materialize.
Estimates of AI’s long-term productivity impact for the US vary widely – from 1.5 percent labour-productivity growth annually (Goldman Sachs 2025) to less than 1 percent cumulatively over a decade (Acemoglu 2024), as shown in Figure 1. Some researchers argue that the long-run impact may instead arise from persistently faster growth rather than a one-time productivity shift (Baily, Brynjolfsson, and Korinek 2023). The timeline and magnitude of significant macroeconomic growth related to AI adoption depend on continued improvements in AI capabilities, widespread adoption, and complementarities with human skills and other technologies (Filippucci et al. 2024).
AI Already Affecting Labour Market
There is some evidence that AI is already having labour market effects: Brynjolfsson, Chander, and Chen (2025) estimate that early career workers in AI-exposed occupations experience a 16 percent relative employment decline while employment remained stable for more experienced workers. Across occupational categories in the US, 2.6-75.5 percent of occupations could have at least 50 percent of their tasks affected by GenAI (Arnon 2025). Research on the UK labour market finds that 11 percent of occupational tasks are exposed to generative AI automation/augmentation as part of “low-hanging fruit” implementation cases, and up to 59 percent of tasks will be exposed to Gen-AI as it develops into more integrated systems (Jung and Desikan, 2024). Heneseke et al. (2025) find that the price premium for AI-exposed tasks declined by 12 percent from 2017 to 2023/24 and that job postings were 5.5 percent lower in 2025-Q2 than if pre-GPT hiring patterns had persisted.
As AI technology is adopted, some labour market disruption is inevitable, but that does not mean that AI necessarily leads to widespread unemployment. Job losses can occur only if innovation outstrips growth in demand for new products and services. Further, the potential for automation does not necessarily translate into actual automation: the decision to automate depends on factors such as firm size, competitive pressure, and the cost of a machine versus the cost of human labour. As technology diffuses and improves productivity, GDP and wages increase, which increases demand for goods and services, creating new employment. Rapid technological progress is regularly accompanied by fears of widespread unemployment. In reality, however, markets adjust dynamically to technology adoption over time, and widespread unemployment is unlikely (Oschinski and Wyonch 2017).6
At the firm level, growing evidence suggests AI can improve labour productivity in many contexts (Figure 2, Table A1). Meta-analysis of research measuring the productivity effects of generative AI shows mixed results across studies and applications. But on average, the use of GenAI tools increased labour productivity (in particular, tasks or departments) by 17 percent (Coupe and Wu 2025).
Despite these gains, there is a notable divide in the wide adoption of tools like ChatGPT and enterprise-grade AI systems (Challapally et al. 2025). Nearly 80 percent of organizations report exploring or piloting large language model (LLM) products, and 40 percent report deployment. These tools primarily enhance individual worker productivity but are not deployed for core business functions.7 By contrast, 60 percent of companies have evaluated enterprise or custom systems, yet only 5 percent reach production.
Tools that succeeded had low configuration barriers and immediately noticeable value, while those that require extensive upfront customization often stalled in the pilot stage. The core barrier to scaling is not infrastructure, regulation, or talent. It is GenAI’s lack of capacity to learn or remember over time (particularly static enterprise tools relative to rapidly evolving consumer-facing tools).8 Aside from enterprise-level adoption and development, there is significant adoption of AI technologies by individual workers to enhance personal productivity. In 2024, 40 percent of the working-age population in the US was using GenAI, 23 percent used it for work, and 9 percent used it every workday (Bick, Blandin, and Deming 2025). The high failure rate of AI pilots can be explained by the productivity J-curve and the current stage of development and adoption (intangible capital accumulation that leads to future productivity improvement). A high failure rate of pilots shows experimentation and contributes to ongoing development on the one hand. On the other, companies that experiment with AI and abandon it might be less likely to adopt it in the future, despite rapid evolution.
Uneven Gains
Productivity gains from new technologies are uneven across sectors and difficult to predict because they depend on where technological change occurs.9 Adoption is also shaped by market competition, regulation, and the current distribution of technology within industries (Howitt 2015). Given the uncertainty around AI’s trajectory and the sectors where it may generate the largest gains, productivity improvements are possible, but expectations may also exceed outcomes. Bridging from the initial development and experimentation phase to widespread adoption, eventual integration and process changes can be accelerated by addressing technical, institutional, and bureaucratic barriers (Ouimetter, Teather, and Allison 2024). Empirical modelling suggests that people, process, and data readiness are required in addition to technology/capital investment to achieve long term operational success (Uren and Edwards 2023). Government policy should be economically broad-based and not narrowly focused on particular industries or applications. It should also be cautious and balance uncertain long-run productivity gains with maintaining competitiveness in a rapidly developing global technology market.
How Canada Compares Internationally
Canada performs reasonably well in international AI rankings, placing eighth overall across five different international AI rankings (Figure 3).10 Rankings vary widely depending on their focus and data sources (Table A3). For example, China’s rank ranges from second in the Global AI Index ranking but 32nd in the Global Index on Responsible AI (GCG 2024). Canada ranks highest in the Global AI Index (eighth) and lowest on the IMF’s AI Preparedness Index (18th). Canada has also fallen in the rankings over time – from fourth in 2021 to eighth in 2025 on the Global AI Index (White and Cesareo 2025) and from fifth in 2022 to 12th in 2025 on the Government AI Readiness ranking (Rogerson et al. 2023; Iida et al. 2026). Notably, Canada’s score improved across categories measured in the Oxford AI Readiness Index, suggesting that advancements in AI adoption, development, and public policy have been made, but they have not kept pace with some international peers.
In terms of development and infrastructure, Canada is a high performer, but not a clear leader among the metrics tracked by the OECD’s AI Policy Observatory. More AI research is produced in Canada than in the US or UK (relative to population size). Canada has higher venture capital investment (as a share of GDP) in AI startups than many peer countries, but falls far behind the US and Israel, the clear leaders in the category (OECD.AI 2026a,b). Canada also maintains a respectable presence in computing infrastructure, with 19 of the world’s top 500 supercomputers (Top500 2025) and public cloud regions (Lehdonvirta et al. 2025). Unfortunately, the processing power of those computers ranks only 18th out of 20 comparator countries (Top500 2025).
Strong Research But Weak Commercialization For Canada
Taken together, these indicators reflect a familiar pattern in Canada’s innovation system: strong research output but weaker commercialization. Continued investment in data and processing infrastructure will help maintain competitiveness, but public policy should also encourage private investment.11 Given the scale of investment in countries such as the United States and China, Canada is unlikely to match their computing capacity regardless of policy choices.
Evaluating the usage of major LLMs by country shows that the US and India account for the largest proportions of total users and interactions. After accounting for population size, however, Canada, Australia, and France show the highest usage rates among individuals (Figure 4).12 While individual use does not directly translate to higher productivity in the production of goods and services, familiarity and comfort with AI tools among the general labour force will improve enterprise adoption prospects. A labour force with AI skills reduces enterprise training costs related to adoption and improves the likelihood of employees generating ideas for reorganizing business processes. Conversely, differences between consumer and enterprise applications can create barriers to workplace adoption (Challapally et al. 2025). Even so, if individual workers are using AI tools to increase their personal productivity, there will be marginal productivity effects from using publicly available tools for work tasks.
High individual adoption in Canada contrasts with lower rates of business adoption.
Based on the most recent comparable data, Canada falls below the OECD average overall and for the proportion of medium and large businesses adopting AI (Figure 5). In Korea, Denmark, and Finland, more than half of large companies are using AI.
International data on the businesses’ adoption of AI is highly variable. The OECD estimates 20.2 percent of businesses (with more than 10 employees) use AI,13 while the McKinsey Global Survey finds that 88 percent of businesses experiment with AI in at least one function (McKinsey 2025; OECD 2025). However, only 10 percent of businesses in G7 countries were using AI for core business functions in 2024. Only 2 to 6 percent of firms across G7 countries have high intensity adoption related to core business functions (Fillipucci et al. 2025). High-intensity adoption is highest in the US, followed by Canada, the UK, and Germany.
There are common features of AI adoption across countries:
Firm size: larger businesses are using AI at higher rates than medium or small businesses.14 This could be related to factors including fixed costs of adoption, larger data resources, lower financing constraints, and complementary intangible assets such as information and communication technology (ICT) skills and research capacity (Calvino and Fontanelli 2023).
Industry concentration: adoption is highest in ICT, followed by professional, scientific and technical services, and communications and marketing (OECD 2025).15
Firm characteristics: higher productivity and younger enterprises are more likely to adopt AI (Calvino and Fontanelli 2023; Calvino, Costa, and Haerie, forthcoming).16
Modelled projections suggest that high-intensity AI adoption among enterprises could reach 13 to 63 percent across G7 countries over the next decade, depending on adoption rates and technological progress (Fillipucci et al. 2025). The US is projected to have the highest adoption rates and the largest annual productivity growth related to AI, while Japan is projected to see the lowest. Canada ranks second in projected adoption across scenarios, but third or fourth in projected labour productivity growth, meaning that productivity gains will likely be relatively modest compared to international peers with similar (and slightly lower) adoption rates (Figure 6).17 Estimates suggest that Canada will reach 32-62 percent enterprise adoption in the next 10 years, contributing 0.35 to 1.13 percentage points to annual labour productivity growth.
Overall, available data show that Canada is about average in terms of adoption and development capacity, and the US is a clear leader. Canada has a lower capacity for development related to AI infrastructure than some peer countries, but remains above average. Canadian individuals have higher adoption rates than those in most other countries. Business adoption is less clear-cut. Some indicators place Canada below the international average, while others rank Canada second in the G7 for high-intensity AI adoption in core business functions. For Canada to close the productivity gap, it will need sufficient AI infrastructure to remain competitive, broad adoption, but most importantly, more rapid or effective AI-enabled innovation to develop adaptations of business processes and new products and services.
Canada’s AI Adoption Landscape
Having compared Canada with international peers, this section examines business adoption within Canada.
In the third quarter of 2025, 14.5 percent of businesses were planning to use AI within the next 12 months, a 3.9 percentage point increase from the previous year. As of the second quarter of 2025, 12.2 percent were already using AI. But two-thirds of businesses report no plans to adopt AI, and 18.9 percent were uncertain (Bryan, Sood, and Johnston 2025a). About six in 10 businesses think that AI investment is not important or not relevant to their business.
Planned adoption is highest in Ontario, British Columbia, Nova Scotia, and New Brunswick, with New Brunswick seeing the largest growth in the proportion of businesses planning to use AI compared to the previous year (Figure 7). Adoption is highest in information and cultural industries; finance and insurance; professional, scientific, and technical services; and healthcare and social services. It is lowest in mining and resources extraction, transportation and warehousing, and construction (Table A1).
Comparing previous and planned AI use shows that the share of businesses planning to adopt AI over the next 12 months is only 2.3 percentage points higher, compared with a 6.1 percentage-point increase from 2024 to 2025. In several sectors – including manufacturing, resource extraction, wholesale and retail trade, and professional services – planned adoption is lower than current usage levels in Q2 2025 (Table 1). Adoption is most likely to increase in accommodation, food services, and real estate over the next year.
Provincial patterns are also uneven. Planned AI use in the information and cultural industries declines in five provinces (including a 39.7-percentage-point drop in New Brunswick) but rises in Ontario, Alberta, and Saskatchewan. In Q2 2025, businesses in Ontario, Quebec, and Manitoba were using AI at higher rates than the national average. By Q3 2026, however, only businesses in Ontario intend to use AI at higher rates than the national average. Businesses in Quebec and Alberta show little appetite for further AI adoption, while those in Prince Edward Island report plans to reduce AI use in 2026 compared with 2025.
Businesses engaging in some international activities are adopting AI at higher rates. Across all provinces, businesses that export services were using AI at higher rates than average. The same is true for importing services in all provinces except Nova Scotia. Businesses that relocated activities outside Canada or made investments outside Canada are also more likely to be using AI at the national level (though these same businesses show the largest declines in intended use over the coming year). Importing and exporting goods has no clear association with AI adoption across provinces.
Overall, businesses involved in international services trade or cross-border investment show higher rates of AI use. This gap will likely close slightly over the year: firms without international activities report higher intentions to adopt AI than the overall business average (3.6 percent compared with 2.3 percent). Meanwhile, firms relocating employees or operations abroad, or investing internationally, report declining intentions to expand AI use.
Canada’s AI adoption landscape (as of Q2 2025) generally mirrors international trends. Younger businesses (10 years or less) adopt AI more frequently than older firms, and large firms adopt more than small ones. The highest adoption rates are concentrated in ICT, finance, and professional, scientific, and technical services. Private enterprises had significantly higher adoption than government agencies and non-profits.
Planned adoption over the next year (reported in Q3 2025) suggests both continuation of these trends and broader diffusion. Government agencies and non-profits serving businesses plan to increase the use of AI at higher proportions than private enterprises. Only 0.1 percent of government agencies reported using AI in early 2025, but 24.3 percent plan on using it within the next year. Younger firms plan to continue to adopt AI at higher rates than older firms.
Planned adoption by firm size varies across provinces. In New Brunswick and Saskatchewan, small (5-19 employees) and medium-sized (20-99 employees) companies report adoption intentions above the national average, while larger firms show declining adoption. In Quebec, by contrast, larger firms continue to adopt AI more rapidly than smaller firms, widening the adoption gap.
Turning to employment effects, most businesses using AI report little change in staffing levels. Among firms that adopted AI in the previous 12 months (12.2 percent of businesses in Q2 2025), 89.4 percent reported no related change in employment (Bryan Sood and Johnston 2025b). Similarly, about 70 percent of firms planning to adopt AI expected no employment change, while another 10 percent are uncertain (Bryan Sood and Johnston 2025a). These results suggest firms may overestimate potential labour savings before implementation. After adoption, 15.1 percent of firms reported no reduction in employee tasks, while 47.2 percent reported only small impacts.
For businesses that do not plan to use AI in the next year, the most common reason is that the technology is not relevant to their products or services (78.1 percent). Only 1.5 percent of businesses said that previous use of AI did not meet expectations. Other common barriers include limited knowledge of AI, privacy, or security concerns, and the technology’s perceived immaturity. Industries with fewer firms reporting AI as irrelevant tend to report lack of knowledge as the primary barrier to adoption.18
Government agencies report the highest rates of disappointment with AI performance (14.8 percent citing unmet expectations as the reason for non-use).19 Regionally, businesses in British Columbia, Alberta, and Ontario report the lowest rates of saying AI is irrelevant to their activities (74.1-76.7 percent), while New Brunswick reports the highest share (88.3 percent). Notably, laws and regulations preventing or restricting the use of AI are one of the least commonly reported reasons for not using AI. This shows that existing industry regulations are not playing a strong role in prohibiting adoption in most industries.
Overall, Canadian data suggest that AI adoption continues to grow but at a slower pace than in 2024. In some sectors, AI use is likely to decline, suggesting that some businesses piloted or implemented AI and did not realize sufficient benefits to continue using the technology. While individuals in Canada use generative AI tools more frequently than those in many peer countries, business adoption remains comparatively limited, and most firms report little measurable labour savings from AI use so far.
Although these trends could indicate declining enthusiasm or unmet expectations, they are also consistent with the early stages of adoption for past general-purpose technologies, where experimentation precedes widespread productivity gains.20
Policy Discussion
Policymakers must recognize that maintaining Canada’s competitive standing requires deliberate, differentiated strategies for AI infrastructure, development, and adoption – objectives that demand distinct policy approaches, skill sets, and resources. While the country currently performs respectably in international rankings, declining relative performance across multiple indices signals cause for concern.
There is significant uncertainty in the trend observations within Canada and across countries – from the beginning of 2024 to the present, we have only two observations of business AI adoption and intended use (from the Canadian Survey of Business Conditions). The OECD international comparisons also depend on this singular survey, and the most recent publicly available Canadian data is for 2023. Given the rapid changes to AI adoption and development, and its potential to have significant growth and productivity effects, we have shockingly little information about how AI is being deployed over time. Statistics Canada is ending the Canadian Survey on Business Conditions (CSBC), with the last scheduled release in August 2026. Budget 2025 allocated $25 million over six years and $4.5 million ongoing for Statistics Canada to implement the AI and Technology Measurement Program (TechStat) to support data and insights to measure how AI is used by organizations and understand its impact on Canadians, the labour force, and the economy. There is significant value and need for national statistics agencies to develop a standardized approach to measuring AI adoption to compare rates across countries, sectors, and over time. This expansion in data monitoring of technology adoption will enable social and economic policy research and inform evidence-based policymaking.21
Temporal considerations must also inform policy design. The substantial productivity gains that AI promises remain, by most credible estimates, a decade or more away. Current measurable benefits, while real, derive primarily from infrastructure buildouts and the “replace” phase of technology adoption, wherein AI-enabled tools substitute for existing technologies within established workflows and processes. These incremental improvements, averaging around 17 percent in labour productivity across various studies, represent meaningful but modest gains. The transformative potential of AI will materialize only when industries advance to the “reimagine” phase, restructuring business models, production processes, and organizational architectures around AI capabilities. History suggests this transition requires substantial complementary investments in training, organizational restructuring, and supporting infrastructure – investments whose returns may not register in productivity statistics for years.
Infrastructure and Data
Data centres have near-immediate positive impacts on GDP and employment while they are being built, but then become an input to production themselves, while requiring significant energy inputs and minimal labour.22 This means that government expenditure directed toward AI development and infrastructure faces inherent limitations as an ongoing economic stimulus. This reality does not argue against infrastructure investment, but rather for calibrated expectations about its short and long term macroeconomic impact and for complementary policies that maximize domestic value creation where possible. Infrastructure represents an investment in the foundational inputs that enable AI and future AI development, with direct GDP impacts occurring in the near term. Data centres themselves do not directly contribute to ongoing productivity growth; they increase the total raw computing capacity. How that capacity is used and deployed determines the longer-term growth and productivity impacts.
The government has a significant role to play in developing its own internal capacity for AI development and adoption, as well as ensuring reasonable access to computing and data resources across economic sectors and business sizes (in particular, for non-profit social enterprises and academic research). The latter objective will be achieved through a combination of policies, including direct spending on infrastructure, funding for low-cost and/or targeted borrowing programs to encourage business investment, and accessibility for small, social and non-profit enterprises. In addition, complementary development of open data assets and investment in initiatives that aggregate high-value administrative and public sector data assets while maintaining appropriate privacy and quality controls would enable AI development activities and improve accessibility for smaller- and lower-resource enterprises.23
Since large companies are already making significant investments in AI infrastructure around the globe, government policy should target improving Canada’s attractiveness for that investment and development. For example, in November 2025, the government tabled Bill C-15. It includes accelerated capital cost allowance and expensing measures. The proposed measures are time-limited and include immediate capital cost deductions for certain productivity-enhancing assets.24 In addition to investment, data centres require land, building/permit approvals, and potentially environmental, energy, and Indigenous impact assessments (and the skilled labour to construct them after approvals). Once they are built, they require significant energy resources for ongoing operations.
A comprehensive strategy will require all levels of government to streamline regulatory approvals and, where possible, implement parallel instead of sequential regulatory steps to speed development timelines. Reducing administrative development costs and shortening approval timelines would benefit general economic development, but could take significant time to implement. In the short term, a targeted strategy could involve identifying suitable development sites at the local or regional level and pre-screening them for energy capacity, required environmental impact assessments, and other considerations.
Adoption and Diffusion
Adoption-focused policy, by contrast, may offer marginal immediate benefits but has higher potential to generate productivity growth in the long term.25 The analysis of business intentions to use AI in the future shows that the majority do not think it is currently relevant to their products or services. Further, the limited data available shows AI adoption across industries is slowing and could possibly decline in five industries over the year.
For companies that do think AI could be relevant to their business but do not plan to use AI, the most commonly cited reasons are a lack of knowledge about the technology, concerns about privacy and security, and that the technology is not yet mature enough. Manufacturing and wholesale trade, in particular, show a lower proportion of firms thinking that AI is not relevant to their products/services, and over 10 percent of firms are not planning to use AI due to a lack of skilled labour.
Given the relatively early stage of adoption and development, these barriers provide a target for government policy intervention. In particular, the government has signalled that it plans to update Canada’s privacy legislation for AI, and it should do so sooner rather than later. An updated privacy policy could have the dual benefit of reducing the uncertainty of potential adopters and providing clarity for companies planning to develop AI technologies using Canadian data.26 Similarly, governments have a role to play in increasing AI literacy and knowledge about the technology (see C.D. Howe Institute, forthcoming). Accelerating the adoption and development of AI in Canadian businesses is also supported by various general and specific tax subsidies, including the Scientific Research and Experimental Development (SR&ED) credit and capital cost allowances discussed above. While employee-training costs are generally tax-deductible, there is a need for a more comprehensive skills investment strategy, particularly in content development and availability for mid-career professionals, with a focus on practical applications. Increasing the labour force capable of implementing AI solutions across different industries is a critical complement to infrastructure investment and to encourage broad adoption and process innovation.
The evidence presented in this analysis shows that adoption in Canada generally follows international patterns – larger and younger firms tend to adopt AI at higher rates. This highlights that targeted policies encouraging technology uptake and growth in small and medium-sized enterprises could speed diffusion across sectors. In addition, it appears that engaging in international trade is associated with higher use of AI, though the intended future use is increasing for companies with no international business activities. In November of 2025, Canada, Australia, and India agreed to enter into a trilateral technology and innovation partnership that includes green energy, resilient supply chains for critical minerals, and the development and mass adoption of AI to improve welfare. Canada should continue to collaboratively secure critical input supply chains and enhance international cooperation on AI development and adoption.
The findings in this Commentary suggest that policies promoting trade diversification and encouraging a broader base of Canadian businesses to engage internationally are interrelated with AI adoption goals. Rather than viewing AI policy in isolation, governments should recognize how existing priorities around business growth, trade promotion, and export development can reinforce technology adoption objectives.
Conclusion
The uncertainty about AI’s development trajectory must be balanced with its potential to be revolutionary and a significant source of ever-elusive productivity growth. The country cannot afford to miss an opportunity that may substantially improve living standards and economic competitiveness over time. On the other hand, the uncertainty surrounding AI’s ultimate productivity impact – credible estimates range from less than 1 percent to 15 percent cumulative GDP gains over the next decade – counsels against excessive concentration of public resources. This suggests a multi-pronged strategic approach that includes investment in infrastructure, enhancing research and development policy,27 and updating privacy legislation. In addition, the government needs to rapidly implement the TechStat initiative to improve monitoring of the diffusion of AI and the associated economic effects. Many policies supporting AI infrastructure, development, and adoption are in the works, while data to monitor their effects is highly limited. The evidence base needs to expand to inform comprehensive and coordinated policy.
Policy should continue to pursue a balanced approach: support for infrastructure development and research capacity to maintain Canada’s standing as a credible AI nation, combined with robust efforts to accelerate adoption across sectors and firm sizes. However, governments should resist the temptation to overemphasize AI at the expense of broader economic priorities.28 Government policy can support AI development and diffusion without direct spending by focusing on a supportive regulatory environment based on principles to manage risk and potential harms, and some stimulus in the form of demand-side policies focusing on potential adopters.29 AI represents one important element of Canada’s productivity agenda, but not its entirety. Maintaining perspective on AI’s current limitations and its uncertain trajectory will help ensure that policy balances risks and limited government resources while remaining responsive to emerging evidence.
The author extends gratitude to Peter MacKenzie, Anindya Sen, Daniel Schwanen, Andrew Sharpe, Tingting Zhang, and several anonymous referees for valuable comments and suggestions. The author retains responsibility for any errors and the views expressed.
Acemoglu, D., and P. Restrepo. 2019. “Automation and New Tasks: How Technology Displaces and Reinstates Labor.” Journal of Economic Perspectives 33(2): 3–30.
Agrawal, A., J. Gans, and A. Goldfarb. 2023. “Similarities and Differences in the Adoption of General Purpose Technologies.” NBER Working Paper 30976.
Blit, J. 2025. Replace, Reimagine, Recombine: Building an AI Nation to Fix Canada’s Productivity Crisis. https://www.uwaterloo.ca/scholar/sites/ca.scholar/files/jblit/files/blit_ai_3rs.pdf
Boussour, L. 2025. “AI-Powered Growth: GenAI as a New Engine of U.S. Economic Performance.” EY Parthenon. November 17. https://www.ey.com/en_us/insights/ai/ai-powered-growth
Brynjolfsson, Erik, Daniel Rock, and Chad Syverson. 2021. “The Productivity J-Curve: How Intangibles Complement General Purpose Technologies.” American Economic Journal: Macroeconomics 13(1): 333–372.
Chatterji, Aaron, Thomas Cunningham, David Deming, Zoe Hitzig, Christopher Ong, Carl Yan Shan, and Kevin Wadman. 2025. “How People Use ChatGPT.” NBER Working Paper 34255. September. https://www.nber.org/papers/w34255
Coupé, Tom, and Weilun Wu. 2025. “The Impact of Generative AI on Productivity: Results of an Early Meta-Analysis.” Working Papers in Economics 25/09. University of Canterbury, Department of Economics and Finance. https://ideas.repec.org/p/cbt/econwp/25-09.html
Eloundou, Tyna, Sam Manning, Pamela Mishkin, and Daniel Rock. 2023. “GPTs are GPTs: An Early Look at the Labor Market Impact Potential of Large Language Models.” arXiv.
Filippucci, Francesco et al. 2024. “The Impact of Artificial Intelligence on Productivity, Distribution and Growth: Key Mechanisms, Initial Evidence and Policy Challenges.” OECD Artificial Intelligence Papers No. 15. Paris: OECD.
Filippucci, F., P. Gal, K. Laengle, M. Schief, and F. Unsal. 2025. “Opportunities and Risks of Artificial Intelligence for Productivity.” International Productivity Monitor 48. https://www.csls.ca/ipm/48/OECD_Final.pdf
Harberger, A.C. 1998. “A Vision of the Growth Process.” American Economic Review 88(1): 1–32.
Heneseke, G., R. Davies, A. Felstead, D. Gallie, F. Green, and Y. Zhou. 2025. “How Exposed Are UK Jobs to Generative AI? Developing and Applying a Novel Task-Based Index.” https://arxiv.org/pdf/2507.22748
Maslej, Nestor, Loredana Fattorini, Raymond Perrault, Yolanda Gil, Vanessa Parli, Njenga Kariuki, Emily Capstick, Anka Reuel, Erik Brynjolfsson, John Etchemendy, Katrina Ligett, Terah Lyons, James Manyika, Juan Carlos Niebles, Yoav Shoham, Russell Wald, Tobi Walsh, Armin Hamrah, Lapo Santarlasci, Julia Betts Lotufo, Alexandra Rome, Andrew Shi, and Sukrut Oak. 2025. The AI Index 2025 Annual Report. Stanford, CA: Institute for Human-Centered AI, Stanford University. April.
McElheran, K. et al. 2023. “AI Adoption in America: Who, What, and Where.” NBER Working Paper 31788.
OECD.AI. 2026a. Data from Preqin, last updated January 5, 2026. https://oecd.ai/
————. 2026b. Data from OpenAlex, last updated September 30, 2025. https://oecd.ai/
OECD/BCG/INSEAD. 2025. The Adoption of Artificial Intelligence in Firms: New Evidence for Policymaking. Paris: OECD Publishing. https://doi.org/10.1787/f9ef33c3-en
OECD. 2026. ICT Access and Usage Database. January.
Yotzov, Ivan, Jose Maria Barrero, Nicholas Bloom, Philip Bunn, Steven J. Davis, Kevin M. Foster, Aaron Jalca, Brent H. Meyer, Paul Mizen, Michael A. Navarrete, Pawel Smietanka, Gregory Thwaites, and Ben Zhe Wang. 2026. “Firm Data on AI.” NBER Working Paper 34836. https://www.nber.org/papers/w34836
Avril 2026 – Les investissements en IA ont atteint plusieurs centaines de milliards, mais les retombées économiques se font encore attendre. Malgré des investissements rapides et une expérimentation répandue des outils d’IA générative, les gains de productivité mesurables ne se reflètent pas encore clairement dans les données agrégées des économies avancées, ce qui soulève une question importante : qui sera le premier à transformer cette dynamique en gains tangibles?
Dans « From Hype to Output: How AI Investment Translates to Real Productivity Gains » (De l’engouement à la production : comment les investissements dans l’IA se traduisent par de réels gains de productivité), l’auteure Rosalie Wyonch constate que si l’IA offre une voie vers de meilleures performances économiques et pourrait contribuer à relever les défis de productivité auxquels le Canada est confronté depuis longtemps, la concrétisation de ces gains nécessitera des politiques favorisant son adoption et sa diffusion par les entreprises, lesquelles restent inégales dans la plupart des secteurs et des régions. Cela implique notamment de supprimer les obstacles, de garantir l’accès aux données et d’encourager l’intégration de l’IA au sein des entreprises et par tous les secteurs.
















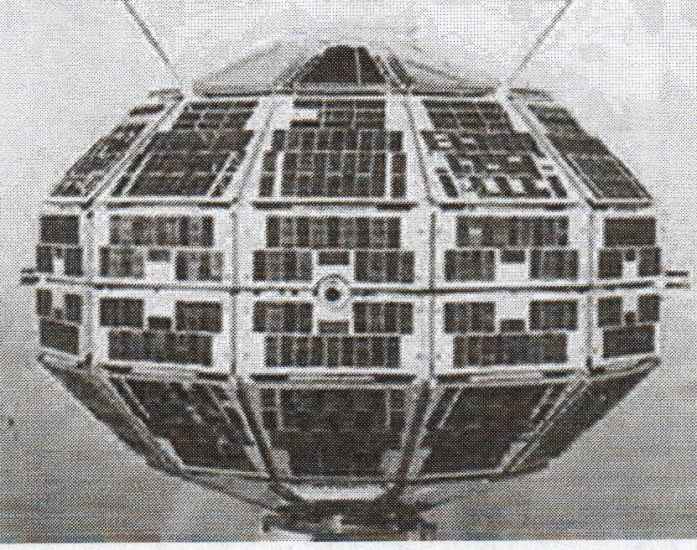
















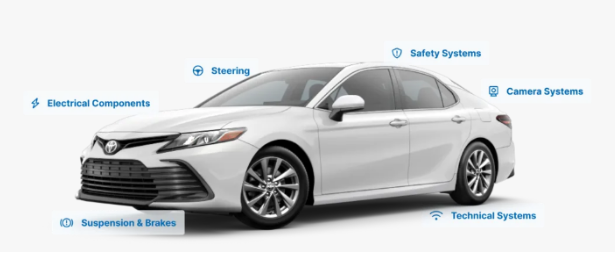



 What a real, targeted person sees: The full fake Google Play page — here spoofing Crown Melbourne
 Google Authenticator spoofed on playrosario[.]site (Google LLC · Tools)
 On the left PWA “Installation” on Android, on the right Official app installation. The process also silently signs the device up for push notifications, which fire gambling reminders directly to the lock screen and are deliberately difficult to disable. Even the back button is rigged. Instead of returning users to the previous page, it reroutes them to the casino offer.
  Unlicensed casino registration with an offering of 150% up to €3,000/ $4,830 CAD + 150 FS dazard[.]com