Tag Archives: wealth

Cracks In Future For Canada Retirement Income

“Warning signs include declining private-sector pension coverage and the gradual erosion of Old Age Security’s income-replacement role, as benefits indexed to inflation fall behind wage growth.” C. D. Howe Institute
  • Canada’s retirement income system has generally served seniors well. Average income replacement rates remain high, poverty among seniors is low, and seniors’ median net worth has more than doubled in real terms since 1999.
  • But cracks are emerging. Public and private pensions now replace 10 percentage points less of pre-retirement income than two decades ago, low replacement rates are becoming more common among lower-middle earners, private-sector pension coverage is declining, and OAS is steadily losing ground as a source of income replacement.
  • The authors argue that Canada should rethink how the system delivers income replacement and poverty protection. They propose exploring a targeted “Canadian seniors benefit” combining OAS and GIS, shifting OAS’s income-replacement role to an expanded CPP/QPP, and strengthening employer-based retirement savings for workers without workplace pensions.

The authors wish to thank Xavier Dufour-Simard and Francois Laliberté-Auger for their assistance in carrying out some of the analyses contained in this paper. The authors also extend their gratitude to Sebastien Betermier, Colin Busby, David Dodge, Malcolm Hamilton, Sarah Hobbs, Abid Kazmi, Sébastien LaRochelle-Côté, Alexandre Laurin, Bernard Morency, James Pierlot, William B.P. Robson, Allan Shapira, Richard Shillington, John Stapleton, Michael Veall, and several anonymous referees for valuable comments and suggestions. The analyses contained in this paper were carried out at the Quebec Inter-university Centre for Social Statistics (QICSS), a member of the Canadian Research Data Centre Network (CRDCN). The activities of QICSS are made possible by the financial support of the Social Sciences and Humanities Research Council (SSHRC), the Canadian Institutes of Health Research (CIHR), the Canada Foundation for Innovation (CFI), Statistics Canada, the Fonds de recherche du Québec and all the Quebec universities that contribute to their funding. Conclusions, interpretations, and possible errors remain our own.

Introduction

Over the past decade, there has been little investigation into how seniors are faring with respect to the retirement system’s two key objectives: helping individuals sustain their standard of living in retirement (income replacement) and protecting them from financial hardship at older ages (poverty alleviation).

This stands in contrast to the rich policy discussion that led to the 2016 federal-provincial agreement to enhance the Canada (and Quebec) Pension Plan (CPP/QPP). Discussions focused on several major developments. The arrival of the first cohorts with full CPP/QPP earnings histories had helped lower poverty among seniors (Milligan 2008). Increased generosity in the Guaranteed Income Supplement (GIS) and CPP/QPP also contributed significantly to declining poverty rates (Schirle 2013). As Veall (2008) argued, the retirement income system was largely accomplishing its poverty alleviation objective. On income replacement, the debate leading to CPP/QPP enhancement made clear that overall rates were high in the population (LaRochelle-Côté et al. 2008; Ostrovsky and Schellenberg 2009). However, mid-earners without employer pension coverage were most at risk because public pensions offer relatively low replacement rates for them1Throughout, “public pensions” refers to the first two pillars of the system – OAS/GIS and CPP/QPP – and not to employer pension plans for public-sector workers, which belong, like private-sector plans, to the third pillar. (Ostrovsky and Schellenberg 2010). That extensive discussion took place less than two decades after another successful CPP/QPP reform took effect in 1998 (Little 2008).
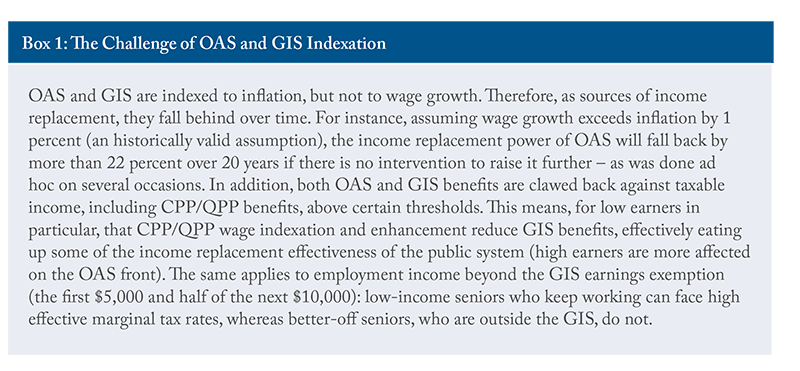
Since the discussions leading to the 2016 agreement, much has occurred, including a pandemic, a surge in inflation, and significant financial market fluctuations. Although the CPP/QPP multi-decade expansion has been rolling out effectively, retirees have faced setbacks elsewhere. The continuing decline in defined benefit (DB) plan coverage in the private sector has turned off the “automatic pilot” for many workers’ retirement savings. Meanwhile, Old Age Security (OAS) and the GIS continue to protect against poverty despite the recent inflation surge because they are indexed to prices. But they are losing ground as sources of income replacement. Unlike CPP/QPP, whose benefits at retirement reflect wage growth over a worker’s career, OAS and GIS amounts are only indexed to prices and fall behind wage growth (see Box 1). Future retirees who rely heavily on OAS/GIS will therefore see lower replacement rates than today’s retirees. These trends suggest that Canada’s retirement income system risks falling behind.

Because of the importance of the retirement income system and the growing size of the senior population, public claims abound that seniors cannot make ends meet, live in poverty, or struggle with the cost of living. These sentiments are often behind proposals to further expand pension coverage and to increase benefits for older Canadians, such as OAS. There are also those advocating the opposite; namely, that retired babyboomers fare much better than prior generations of retirees and that, as a result, OAS should be curtailed for higher-income earners and left to play only a poverty alleviation role, potentially freeing up financial resources for other uses.

This Commentary, drawing heavily on Boisclair et al. (2025a), has two aims.

  • First, it investigates the financial outcomes of seniors over two decades (2002 to 2022), comparing their retirement incomes to prior earnings and taking a look at household balance sheet data. It finds that seniors have, on average, fared rather well financially, both in terms of flows (income/consumption) and of stocks (net wealth).
  • Second, the paper illustrates and acknowledges the changes in income composition and income replacement at older ages in recent decades – in particular, decreasing private sector pension coverage and a retreating role of the first pillar (OAS/GIS) of the retirement income system. It then discusses some options to reform the system and refocus it on its objectives.

Data Sources to Assess Seniors’ Financial Situation

To evaluate whether the retirement income system met its objectives in the past 20 years, we mainly rely on Statistics Canada’s Longitudinal Administrative Databank (LAD). The LAD offers detailed financial information derived from the tax records of 20 percent of the Canadian population. It allows us to obtain precise income measures at multiple points over a taxpayer’s lifetime and provides information on household composition. As a complement, we use Statistics Canada’s Survey of Financial Security for balance-sheet analysis. Both datasets are subject to substantial lags: LAD data are available through 2022 and SFS data through 2023. Readers should keep these lags in mind when interpreting our findings.

When inflation peaked in 2022, interest rates rose sharply, and housing prices fell from their peak in some major markets, while financial markets rose strongly. Because public pensions are indexed to prices, seniors’ income from OAS, GIS, and CPP/QPP was largely protected; financial and pension assets have generally grown; housing wealth, by contrast, may be somewhat overstated for owners in the most affected markets.

Poverty alleviation: With respect to poverty alleviation, we use key measures of poverty that can be constructed with tax data. As is clear from the literature, there is no single perfect measure of poverty (Government of Canada 2018). We mainly use the low-income cut-offs, after tax (LICO-AT) measure, created by Statistics Canada. The LICO-AT has not been updated since 1992 and relies on meeting expenditures on housing, food, and clothing but does not account for the growing share of expenditures on transportation and communications (Noël 2017).2 But it is easily computable from LAD data.

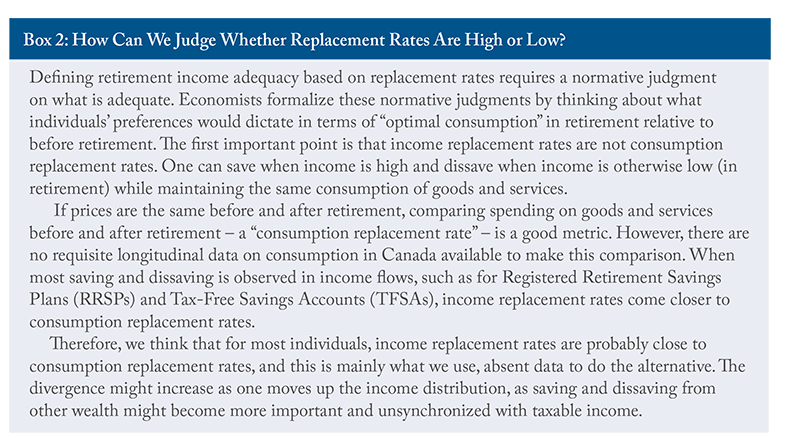
Income replacement: To evaluate the retirement income system in terms of income replacement, we calculate replacement with a measure of pre- and post-retirement income at some given ages. For this analysis, we define pre-retirement income as the average income in the age range 50 to 54, so as not to rely on a single year of income in the denominator of the replacement rate.3 We define the post-retirement window as the tax year in which the taxpayer turns 70.4
Income Replacement in Retirement

Family replacement rates (RR) on average are high, ranging from 80 percent to 90 percent (Figure 1).5 They increased by almost 10 percentage points (pp) between the 2002 and 2014 cohorts, before declining to roughly their levels at the beginning of the period. That hump-shaped pattern is mostly the result of changes in the denominator: pre-retirement earnings (at ages 50-54) declined slightly in real terms for cohorts turning 70 up to 2012, then rose by about 10 percent between the 2016 and 2022 cohorts (Boisclair et al. 2025a).
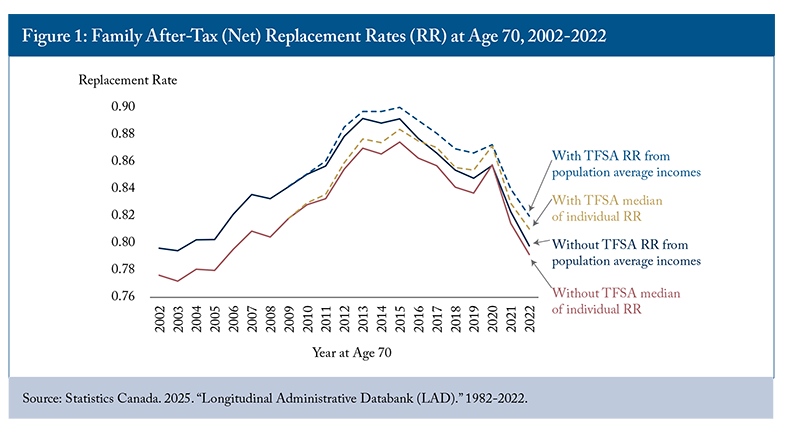
Retirement incomes, by contrast, increased steadily over the period. Including TFSA net withdrawals as income increases the RR by only 2 to 3 percentage points, with little effect on replacement rates, although this could change as TFSA use increases. Replacement rates are higher on an after-tax basis, since tax rates are lower at older ages due to several tax measures and to the progressivity of the income tax schedule.6

Figure 2 shows that despite similar gross replacement rates, individual incomes at age 70 have changed composition over the past decades.7 Public pensions, defined as the sum of OAS/GIS and CPP/QPP, are a very important source of income for seniors on average, but the share of pre-retirement income they replace has been declining from 31 percent of total pre-retirement income in 2002 to 27 percent in 2022. We observe a similar declining trend for private pension income (27 percent to 21 percent).8 What may seem surprising is that private pension income is declining for these cohorts, but changes to Registered Retirement Income Funds (RRIFs) over time could explain at least part of this phenomenon. Overall, public and private pension incomes have gone down from representing 58 percent of pre-retirement income to 48 percent, a drop of 10 percentage points in less than 20 years. This is a large drop coming from the three pillars of the retirement income system.
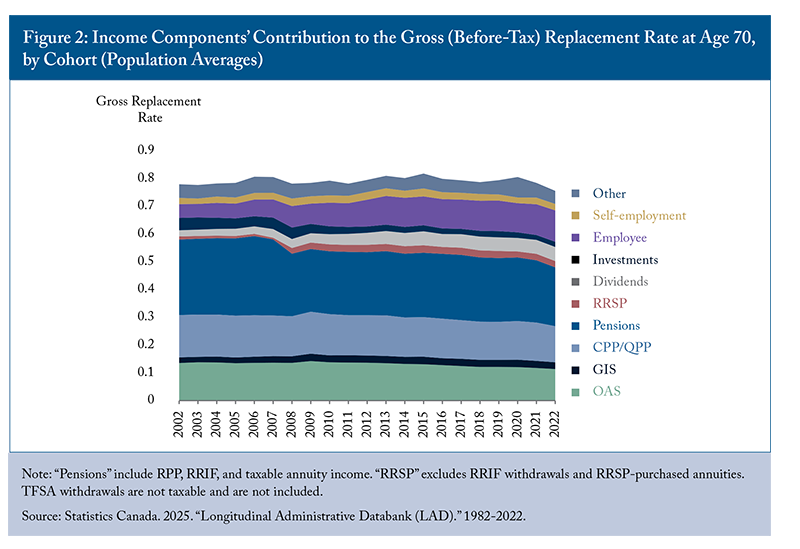
If the contribution of these sources to replacement is falling, what is keeping gross replacement rates constant? A closer look reveals that gross replacement rates do not decline accordingly because of an increase in several other income sources, notably employment (+6 pp), dividend (+3 pp), and RRSP (+1 pp; excluding RRIFs and RRSP-purchased annuities) income. Employment income at 70 is not concentrated among the better off: relative to pre-retirement income, it contributes more to replacement in lower deciles (14 pp in the third decile versus 9 pp in the eighth in 2022), although it forms a larger share of retirement income in the top decile (Boisclair et al. 2025a, Table 3).9 We also observe a decline in investment income (-3 pp), which could reflect the growing importance of tax-favoured savings vehicles (RRSPs and TFSAs) over time. One can conclude that there is more diversity in income sources at age 70 than there was 20 years ago and that traditional retirement income, coming from public and private pensions, has eroded substantially as a percentage of pre-retirement income.
Income Replacement Across Income Groups

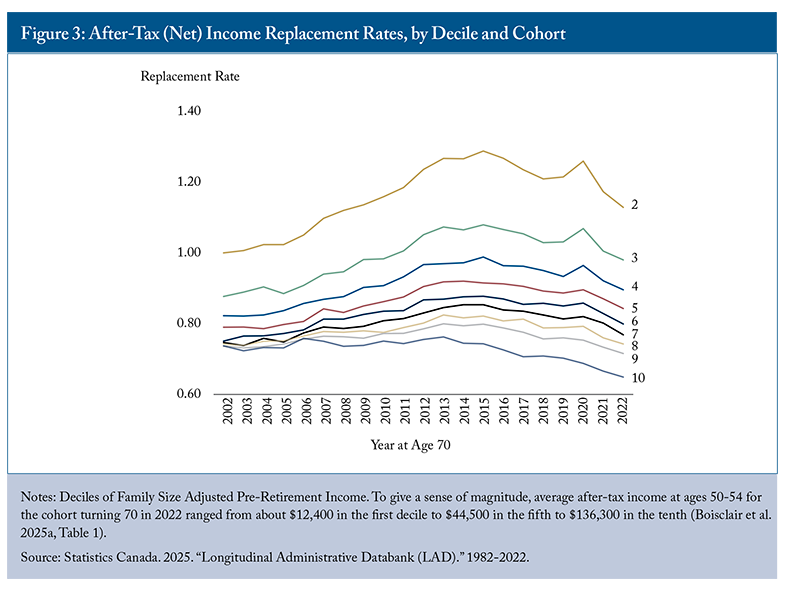
Replacement rates from public pensions decline as income rises, a well-known feature of Canada’s retirement income system. To examine how this relationship is evolving, we divide the income distribution into cohort-specific deciles of pre-retirement after-tax income and compute the RR for each decile over time. The RR for the first decile hovers around 2 and is omitted to enhance readability (Figure 3). This means that someone in the first decile sees their real after-tax income double at age 70 relative to ages 50-54. Replacement rates are thus very high at the bottom of the income distribution.
The RRs generally decrease as pre-retirement income increases. At the very top (10th decile), the replacement rate remains above 60 percent. Because saving and dissaving outside registered accounts matters more at higher incomes, income replacement rates are a less reliable guide to consumption replacement in the upper deciles, and relatively low rates there are not necessarily a sign of inadequacy. Most deciles increase until 2014 to 2016, followed by a decrease of a similar magnitude. Deciles 2 and 3 exhibit no net variation from 2002 to 2022, whereas higher deciles have positive net variations, ranging from 3 percentage points (decile 4) to 6 percentage points (decile 7) over the entire period. The only decile that sees a net negative variation is the 10th (highest earners), whose RR drops by almost 6 percentage points over the period. The decrease for this decile again reflects faster growth in pre-retirement income from 2016 onward, suggesting that this group is faring increasingly well before retirement and is therefore of less concern from a retirement-income policy perspective.

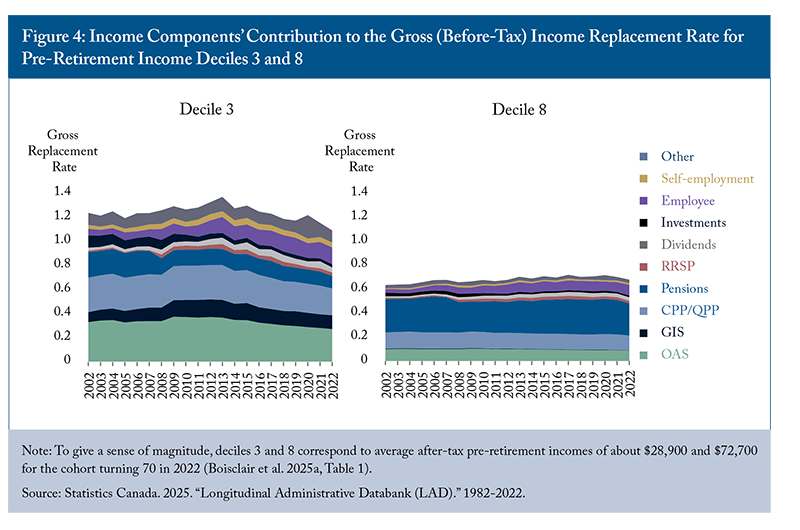
Figure 4 illustrates the difference in gross RR magnitude between the ends of the income distribution. The graph shows how lower deciles depend on public pensions (OAS, GIS, and CPP/QPP), which replaced almost 80 percent of their gross income in the early 2010s. On the other hand, the upper deciles rely a lot more on private pensions (including RRIFs). We observe in the decile 3 that public pensions have not followed the increase in pre-retirement income, resulting in a decreased contribution to the gross RR by more than 19 percentage points over the 2013-2022 period (from 80 percent to 61 percent). This trend is much less pronounced for the 8th decile, where the decline is 2 percentage points (23 percent to 21 percent) over the same period. This suggests that the deteriorating income replacement function of the public pension system is disproportionately affecting lower-income taxpayers. Overall, this leaves the bottom of the distribution most vulnerable to the erosion of public pensions and the top to the retreat of Registered Pension Plans (RPP).

Averages also mask dispersion within deciles. The share of taxpayers with replacement rates below 60 percent – a level that is hard to reconcile with standard consumption-smoothing preferences – rose by 7 to 13 percentage points across cohorts in deciles 3 to 5, and up to a third of seniors below the median have low replacement rates (Boisclair et al. 2025a). Earlier work with the same data shows that low replacement rates are concentrated among middle earners without employer pension coverage (Ostrovsky and Schellenberg 2010).

Poverty Protection in Retirement

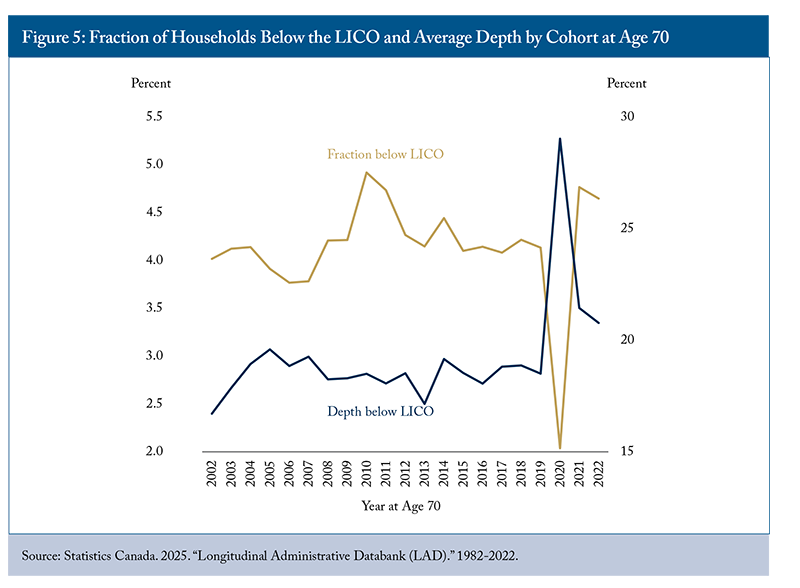
We find that the fraction of retired seniors below the LICO-AT is low (about 4 percent) and has remained very stable over cohorts, abstracting from the effect of the pandemic. The average depth, or shortfall, below the LICO over the period is also stable at around 18 percent (Figure 5). Thus, very few seniors fall below an absolute low-income threshold such as the LICO: Canada has been highly successful in protecting seniors from very low incomes. The same cannot be said for all Canadians, namely youth and working-age adults, however.

By comparison, in 2024, 5.4 percent of seniors lived below Canada’s official poverty line (the Market Basket Measure), compared with 11.5 percent of children and 12.6 percent of adults aged 18 to 64 (Statistics Canada, Table 11-10-0135-01). The dip in the low-income rate for 2020 is probably a reflection of larger transfers to households, such as the Canada Emergency Response Benefit (CERB). Overall, poverty rates are low among seniors because of the combined effect of OAS and GIS.10 In this light, it is notable that so much of the policy discussion revolves around poverty alleviation, when the erosion of the income replacement role of OAS is well underway and should be a cause for concern.

The Balance Sheet of Seniors

Income flows can be different from spending flows. When income flows include withdrawals from RRSPs and TFSAs, one also captures spending coming from the decumulation of these accounts (unless these monies are then transferred to taxable savings or to another investment use). This is therefore a good proxy, as argued above, but this will not include decumulation from other accounts and, more generally, consumption out of wealth. This can be important since a wealthy individual or household with a modest income may be better off financially, and spend more, than a counterpart with a high income but no wealth.
The most comprehensive source of data currently available on wealth holdings is Statistics Canada’s cross-sectional Survey of Financial Security (SFS).11 Since this is not longitudinal data, Table 1 shows cross-sectional statistics over time in constant 2023 dollars for households aged 65 and older. Specifically, the table reports both the proportion of households holding various types of assets and debts as well as the median value among households with positive balances. Median total assets and median net worth are also included and are calculated across all senior households, including those with zero or negative net worth. Conditional medians for individual assets cannot be added up to obtain the totals.
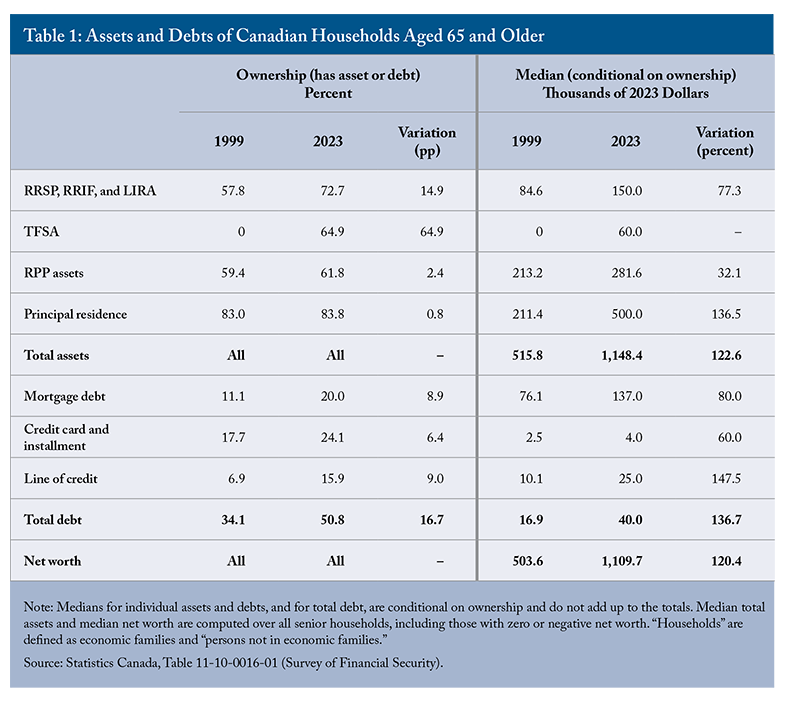
The median household net worth (assets minus debt) of those age 65+ has risen from $503,600 in 1999 to $1.1 million in 2023, or by 120 percent. This doubling over 24 years is a significant increase in the potential living standards of seniors. Of course, there is considerable dispersion, but the median senior household has a very high net worth. The share of seniors with RRSP assets rose from 57.8 percent to 72.7 percent, while the median value of those assets increased substantially, by more than 77 percent in real terms. TFSAs were introduced in 2009, and by 2023, 65 percent of households with at least one member aged 65 or older held TFSA assets, with a median value of $60,000. Importantly, while the share of households with RPP assets increased slightly over the period, the median value of those assets increased by 32 percent on average. Overall, traditional retirement savings, through pension plans and tax-favoured saving vehicles, increased substantially over time. Principal residences, held by 83 percent of senior households, also increased substantially in value: the median value among homeowners rose by 136 percent in constant dollars.12

Median debt increased as well by 136.7 percent over the period. But since debt is low relative to assets, its evolution does not significantly impact net worth. A few interesting changes occurred – for example, lines of credit, in particular home equity lines of credit, have more than doubled in prevalence and in median value – but traditional mortgage debt still accounted for the lion’s share of senior debt in 2023. Over the period, the share of households with mortgage debt nearly doubled to one in five (20 percent); households may have been able to borrow more on account of larger assets and rising income, but also lower interest rates (Bédard and Michaud 2021).

On average, seniors now have much higher net worth and financial equity, from which to finance consumption in retirement if they wish to do so. Even though counting home equity probably overstates the increase in net consumption opportunities coming from wealth, the overall portrait is quite positive for many in terms of non-government savings for retirement. However, this may not be available to some who have very few assets (Baldwin 2022). Notably, there is an important divide between homeowners and renters. The divide is stark: among families whose main earner was 55 to 64 in 2023, homeowners with an employer pension had a median net worth of $1.4 million, compared with $11,900 for renters without one (Statistics Canada 2024). Household type matters as well: seniors living alone, many of them widowed, had a median net worth of $475,900 in 2023, less than half that of senior families. Further complicating the interpretation of wealth differences is the increase in the average length of the retirement period, implying that one needs more financial wealth to sustain a given regular flow of consumption expenditures in retirement.

The Policy Challenges Ahead

To summarize the findings for policy, we must first note that the bottom income deciles rely on the public system (OAS, GIS, and CPP/QPP), while above the median, RPPs and other private retirement savings account for a much larger share. Hence, two issues warrant attention: 1) the future evolution of public pensions and its impact on the bottom deciles (and, perhaps less importantly, higher deciles due to CPP/QPP enhancement); and 2) the evolution of RPPs and other retirement savings arrangements and their impact on the replacement rates of individuals above the median. We discuss each in turn.

The Eroding Income-Replacement Role of OAS/GIS

With price indexation instead of wage indexation, the income replacement role of OAS/GIS has been slowly eroding, as indicated by Figure 2 – especially so for lower deciles, as shown in Figure 4. The 10 percent increase in OAS for those aged 75 and over introduced in 2022 partly offset this erosion for older seniors, but did not change the underlying indexation mechanism. And without further intervention, this will continue in the future, reducing OAS’s income replacement value by more than 22 percent over 20 years if real wage growth is 1 percent above inflation. The CPP/QPP expansion already underway will barely offset this decline in aggregate – roughly offsetting it for workers with earnings close to the Year’s Maximum Pensionable Earnings (YMPE), but not for lower earners, whose gains are smaller and partly clawed back through the GIS, while higher earners see a net gain (Boisclair et al. 2025a).

There are several possible options to adapt OAS, including a few known proposals. One would see OAS increase in generosity; another would see it curtailed; and a third would see it reshaped entirely. We review these proposals below as potential options or starting points for further policy discussions.

Option 1: Expand OAS for Those Aged 65-74

This idea was originally put forward in 2021 in a private member’s bill, Bill C-319, which died when the previous Parliament was dissolved. The content of the bill has moved to Bill C-261, which was first read in Parliament on February 9, 2026.13 A 2022 enhancement increased OAS by 10 percent for Canadians aged 75 and over; the current proposal would extend the same increase to Canadians aged 65-74.

We do not think this is the right approach for two reasons. First, an across-the-board increase is poorly targeted: poverty among seniors is now low relative to other age groups, and most of the cost would go to seniors who are not at risk of poverty. Second, it would not solve the underlying problem: a one-time increase restores some income replacement today, but with price indexation the erosion simply resumes, inviting further ad hoc increases. Relying on such raises on top of legislated inflation indexing leaves this important program – perhaps more than others due to its size and salience, as well as its single-government nature – at the mercy of political and public finance pressures.

Option 2: Start OAS Clawbacks at $100,000 of Family Income

A proposal from Generation Squeeze would cut OAS for better-off seniors – effectively lowering the clawback threshold by combining family incomes rather than treating them individually and/or increasing the rate compared to the current situation.14 Using the “family income” concept, contrary to individual income, which is currently the case for OAS clawback, would ensure that single or widowed individuals are not disadvantaged (the current 15 percent clawback starts at an individual income of $93,454 in 2025).

We share the premise of this proposal: any reform that refocuses OAS will, and should, ask more of better-off seniors. Our concern is rather with its design. While this would ease financial pressures on the program while protecting the poverty alleviation function for lower-income seniors, we believe this would come down to turning OAS into a “taxable GIS.” Indeed, the GIS’s very function is to ensure that seniors with little or no income other than OAS are lifted to just above some low-income threshold. It is unclear to us that duplicating this function is the best way forward. While a family-income test avoids disadvantaging single or widowed seniors, it would also end the individual character of OAS. Since its introduction as a universal benefit in 1952, OAS has provided lower-earning spouses – mostly women – with an independent source of income and could discourage couple formation later in life. Moreover, this proposal in itself is incomplete, as it does not address the erosion of income replacement above the median.

Option 3: Create a Canadian Seniors Benefit and Expand CPP/QPP

This proposal was made by one author of this paper in the Financial Post in late 2024 and in L’actualité.15 It would combine OAS and GIS – the OAS supplement – into a more streamlined “Canadian seniors benefit,” aimed solely at poverty alleviation, while only using CPP/QPP to achieve income replacement objectives. Canada has taken a similar approach elsewhere, for example with the Canada child benefit (CCB). This option has two distinct components: (a) replacing OAS and GIS with a targeted, federally funded “Canadian seniors benefit”; and (b) expanding CPP/QPP benefits, financed by higher contributions from workers and employers, to take over the income replacement function currently played by OAS. The two components fall under different jurisdictions – the first is federal, while the second requires federal-provincial agreement – but they are designed to go together: implementing the first without the second would amount to a cut in retirement income for middle-income workers.

More specifically, the idea consists in closing OAS as it currently exists, stripping it of its income replacement function – which has been in constant decline in recent and future decades – and moving its poverty alleviation function to an expanded GIS. The latter, which would become a targeted “Canadian seniors benefit,” would ensure that all seniors have an income at least equal to the low-income threshold. This is similar to what OAS and GIS currently accomplish together for lower-income seniors.

Consider an illustrative design for a single senior. The new benefit could guarantee the current combined maximum of OAS and GIS – about $22,800 a year in late 2026 – and be reduced by 40 cents for each dollar of other income. It would then be fully phased out at about $57,000 of other income between the current GIS cut-off ($23,112) and the OAS recovery threshold ($93,454). The reduction rate would thus be higher than the 15 percent OAS recovery tax but lower than the 50 percent to 75 percent GIS reduction rates, which would also improve work and saving incentives for low-income seniors. An earnings exemption similar to the current GIS one should also be preserved. Parameters for couples would need to be set separately. The first pillar would thus become a pure anti-poverty transfer program.

Such a redesign would have important distributional consequences, which hinge on a key difference between the two programs: OAS and GIS benefits depend on residence and current income, whereas CPP/QPP benefits depend on lifetime earnings. Keeping the new benefit tied to residence and current income is what protects seniors with low incomes, whatever their work history – including many with interrupted employment histories, caregivers, persons with disabilities, low lifetime earners, and immigrants with incomplete Canadian residence – since it would guarantee an income at least equal to the low-income threshold. By contrast, the income replacement function moved to CPP/QPP would accrue in proportion to lifetime earnings. Seniors whose current income places them above the range of the new benefit, but whose lifetime earnings were modest, would therefore lose OAS without an equivalent CPP/QPP gain. This is notably the case of lower-earning spouses in middle-income couples, often women, for whom OAS is currently an individual source of income; income testing on a family basis would remove it, unless the design preserves some individual entitlement.16

In any case, substantial savings would ensue for the federal government since OAS payments (excluding GIS) are planned to total nearly $68 billion in 2026/27. The actual size of the savings will depend on the specific parameter values for the redesigned “Canadian seniors benefit” and on the transition (see below), but would eventually amount to tens of billions of dollars a year. Then, a parallel increase in contributions would enhance CPP/QPP benefits to take over the income-replacement function of OAS. As a purely illustrative order of magnitude, replacing the maximum OAS pension for a worker with career earnings at the YMPE would require about 3 percentage points of additional contributions, split between employees and employers, on a fully funded basis.17This would effectively move the income replacement function of OAS “off-budget,” within a plan with strong governance, and bring it together with the rest of earnings-related income replacement in CPP/QPP. How this expansion is financed matters as much as its size. A fully funded expansion, like the one introduced in 2019, is fair across generations but takes about 40 years to mature, which, if OAS were closed at the same time, would leave middle-income workers retiring in the interim with neither OAS nor much additional CPP/QPP. A partially funded (pay-as-you-go) component would allow benefits to be paid sooner at the cost of transfers from future contributors.

Transition is the main challenge. Many workers have planned their retirement around OAS, and closing it abruptly would impose large and unforeseen losses on those who have already retired or are close to retirement – a retiree with $41,000 in income from a defined benefit pension and full CPP would lose about 15 percent of income – while a fully funded CPP/QPP enhancement would take decades to mature. The two must therefore move in step: OAS would remain in place for current retirees and cohorts close to retirement and be phased out gradually for younger cohorts as their CPP/QPP entitlements build up, with long advance notice. The CPP/QPP phase-in could also be accelerated, through two sources that can be combined: drawing on part of the assets accumulated in the base CPP and QPP and using part of the federal savings from closing OAS, for instance, to finance a partially pay-as-you-go component. Both involve transfers across generations to be weighed against the higher contributions they would imply later, and the latter would make federal savings correspondingly smaller in the short run. Beyond the transition, governments could decide whether to use the savings to lower taxes, reduce debt, or fund other priorities.

Clearly, such a major change would require careful and demanding coordination between the federal and provincial governments, at least with respect to the CPP/QPP part. Although such coordination is always a challenge in Canada, it is not unheard of. This is evidenced by the two important rounds of changes to CPP achieved in the past 30 years: in particular, the 1998 reform and the 2016 agreement to enhance the CPP; and by the contribution rate cuts announced in the federal Spring Economic Update.18 Cancelling those rate cuts could indeed be part of a broader remodelling under this option.

The Retreat of Private-Sector Pension Coverage

The landscape is changing rapidly for RPPs. Coverage in the private sector has eroded from an already low level, despite high hopes when Canada’s retirement system was established: 35 percent of private sector workers were covered in 1980, compared with fewer than one in four today (Boisclair et al. 2025a) – and only about 17 percent of core-age private-sector workers after correcting for double counting in official statistics (Dostie and Morris 2025). The quality of coverage has declined as well: in 1980, 90 percent of covered private-sector workers had a defined benefit plan, compared with 41 percent in 2023, so that fewer than one in 10 private-sector workers now has access to a DB pension (Boisclair et al. 2025a).19 As discussed, this is particularly concerning for above-median earners.

Although the primary goal of the CPP/QPP expansion currently underway was to cover workers without RPPs, this may translate into higher replacement rates for those with DB RPP coverage. Indeed, many public sector DB plans do have a so-called “integrated” structure with CPP/QPP20 – but it is too early to tell how many DB plans will have accounted for the CPP/QPP enhancement in the medium- to long-term.

However, middle- and higher-income earners without pension coverage have long been the group most at risk of inadequate income replacement. While solutions may exist to increase pension or retirement savings coverage for this target group, most are difficult or costly to implement or politically unpopular. For instance, a recent proposal in a C.D. Howe Institute Commentary (Ambachtsheer and Mazer 2026) suggests subsidizing small businesses to offer employee pensions. While this may help since cost is often a major concern for employers considering a pension plan, administrative burdens remain, and the subsidy could provide windfall gains to employers that would have offered a plan anyway. Furthermore, the very low take-up of Pooled Registered Pension Plans (PRPPs) illustrates that a stronger approach is required.

Quebec’s approach under its law on Voluntary Retirement Savings Plans (VRSPs), which requires employers to offer a basic savings plan with auto-enrolment, seems to be going in the right direction. Indeed, we have recently found that the law has resulted in increased savings in VRSPs but also in RRSPs and TFSAs (Boisclair et al. 2025b). However, enforcement is currently limited, and employer contributions remain voluntary, hampering more significant progress. Moreover, all workers are enrolled in the plans, even lower-income workers who might not benefit much or for whom an RRSP-type plan might even reduce future GIS benefits. In its most recent budget, the Quebec government has announced that it would study options to strengthen VRSPs, including a possible public VRSP managed by an independent organization, similar to the National Employment Savings Trust (NEST) in the UK.

If we are to address the income replacement gap for the target group, strengthening employer-based solutions will be needed to avoid an even larger CPP/QPP expansion than the one already underway and the one following the folding of OAS, based on option 3 above.

Conclusion

The evidence presented in this paper and elsewhere suggests that, on average, Canadian seniors have fared relatively well in recent decades and that the retirement income system has so far met its objectives in aggregate, both in overall income replacement and poverty protection. While some seniors continue to face hardship, this conclusion may surprise many and contrasts with the broader narrative of widespread financial difficulty among seniors.

Against this backdrop, the evidence also points to weaknesses that are already visible and likely to deepen:

  • public and private pensions now replace 10 percentage points less of pre-retirement income than they did two decades ago;
  • low income-replacement rates are becoming more frequent among lower-middle earners;
  • private-sector RPP coverage keeps declining; and
  • the income replacement function of OAS continues to erode and is not fully offset by the CPP/QPP expansion underway.

To date, other income sources – notably employment – have filled the gap, but they cannot be relied upon in the same way as pensions. One way forward, which we do not favour, would be to keep adjusting OAS on an ad hoc basis. Or Canada could, as we suggest, reshape OAS by folding its limited income replacement function into the CPP/QPP and merging the rest with GIS to create a “Canadian seniors benefit” that focuses solely on poverty reduction.

For income replacement above the median, private-sector RPPs and other employer-sponsored retirement savings arrangements could help bridge the growing gap, given their apparent value to workers (Dostie and Morris 2025). The enhanced CPP/QPP may also prove sufficient for this group following the current expansion and any changes that may come with the remodelling of OAS/GIS. If not, Canada could complement this approach with an “improved VRSP-like” system in which employers are encouraged or mandated to play a stronger role – as was always intended in the design of Canada’s retirement income system – or expand CPP/QPP even further still, this time above a certain level of earnings. In all scenarios, it is time to revisit Canada’s retirement income system.

For the Silo, Pierre-Carl Michaud and David Boisclair.

References

Ambachtsheer, K., and A. Mazer. 2026. Spreading the Benefits: A Targeted Tax Credit Is Needed to Expand Retirement Plan Coverage in Canada’s Private Sector. Commentary 704. Toronto: C.D. Howe Institute. https://cdhowe.org/publication/spreading-the-benefits-a-targeted-tax-credit-is-needed-to-expand-retirement-plan-coverage-in-canadas-private-sector/.

Baldwin, B. 2022. “The Evolving Wealth of Canadians: Who Is Better Fixed for Retirement? Who Is Not?” E-Brief. Toronto: C.D. Howe Institute. https://cdhowe.org/publication/evolving-wealth-canadians-who-better-fixed-retirement-who-not/.

Bédard, N., and P.-C. Michaud. 2021. “Playing with Fire? Household Debt near Retirement in Canada.” Canadian Public Policy / Analyse de politiques 47(1): 56–71. https://www.jstor.org/stable/27034142.

Boisclair, D., X. Dufour-Simard, and P.-C. Michaud. 2025a. “Retirement Incomes in Canada: Past, Present and Future.” Retirement and Savings Institute (RSI) Working Paper 19. September. https://ire.hec.ca/en/19-retirement-incomes-in-canada-past-present-and-future/.

______________. “La Loi RVER a-t-elle augmenté l’épargne des travailleurs au Québec?” Jacques-Parizeau Research Chair in Economic Policy Working Paper 5. October. https://cjp.hec.ca/en/5-la-loi-rver-a-t-elle-augmente-lepargne-des-travailleurs-au-quebec/.

Dostie, B., and T. Morris. 2025. “The Labour Market Impacts of Employer-Pension Plans.” Retirement and Savings Institute (RSI) Working Paper 18. August. https://ire.hec.ca/en/18-the-labour-market-impacts-of-employer-pension-plans/.

Financial Services Regulatory Authority of Ontario (FSRA). 2026. “Workplace Pension Membership Increases in Ontario, but Many Could Benefit from Additional Planning Steps.” News release. March. https://www.fsrao.ca/announcements/workplace-pension-membership-increases-ontario-many-could-benefit-additional-planning-steps.

Government of Canada. 2018. Canadian Poverty Reduction Strategy: What We Heard about Poverty So Far. Ottawa: Employment and Social Development Canada. https://www.canada.ca/en/employment-social-development/programs/poverty-reduction/reports/what-we-heard.html.

LaRochelle-Côté, S., J. Myles, and G. Picot. 2008. Income Security and Stability during Retirement in Canada. Analytical Studies Branch Research Paper Series 306. Statistics Canada.

Little, Bruce. 2008. Fixing the Future: How Canada’s Usually Fractious Governments Worked Together to Rescue the Canada Pension Plan. Toronto: University of Toronto Press. October.

Milligan, K. 2008. “The Evolution of Elderly Poverty in Canada.” Canadian Public Policy / Analyse de politiques 34(Supplement 1): S79–S94. https://doi.org/10.3138/CPP.34.4.S79.

Noël, Alain. 2017. “How Do We Measure Poverty?” Policy Options. November 9. https://policyoptions.irpp.org/2017/11/how-do-we-measure-poverty/.

Ostrovsky, Y., and G. Schellenberg. 2009. Pension Coverage, Retirement Status, and Earnings Replacement Rates among a Cohort of Canadian Seniors. Analytical Studies Branch Research Paper Series 321. Statistics Canada. https://www150.statcan.gc.ca/n1/en/catalogue/11F0019M2009321.

______________. 2010. A Note on Pension Coverage and Earnings Replacement Rates of Retired Men: A Closer Look at Distributions.

Schirle, T. 2013. “Senior Poverty in Canada: A Decomposition Analysis.” Canadian Public Policy / Analyse de politiques 39(4): 517–540. https://doi.org/10.3138/CPP.39.4.517.

Statistics Canada. 2024. “Survey of Financial Security, 2023.” The Daily. October 29. https://www150.statcan.gc.ca/n1/daily-quotidien/241029/dq241029a-eng.htm.

Veall, M. R. 2008. “Canadian Seniors and the Low Income Measure.” Canadian Public Policy / Analyse de politiques 34(Supplement 1): S47–S58. https://doi.org/10.3138/CPP.34.SUPPLEMENT.S47.

Wolfson, M. 2011. Projecting the Adequacy of Canadians’ Retirement Incomes. Institute for Research on Public Policy. https://irpp.org/research-studies/projecting-the-adequacy-of-canadians-retirement-incomes/.


Navigating the Great Wealth Transfer: What It Means for Families

The landscape of North American wealth is on the brink of a historic shift. Current research estimates that between $75 trillion usd and $125 trillion usd ($102.5 trillion cad and $170.8 trillion cad) will change hands over the next two decades in American alone as assets pass from the baby boomer generation to younger heirs. This unprecedented movement of capital, now widely referred to as the Great Wealth Transfer, is set to redefine family finances, generational relationships, and the future of estate planning across North America.

While the transfer represents an extraordinary opportunity for Millennials and Gen Xers, it also carries significant legal and emotional risks. Attorney Don Ford, a Board-Certified expert in Estate Planning and Probate Law with Ford + Bergner LLP, warns that without thoughtful preparation, the same wealth intended to provide security can just as easily fracture families and ignite costly disputes.

A Scale Never Seen Before


“The scale of this transfer is unlike anything we have seen before,” explains Ford, Managing Partner at Ford + Bergner LLP—a Texas-based boutique firm specializing in estate planning, probate, and guardianship. “And when large sums of money move quickly through families that are unprepared, conflict becomes far more likely.”

Why This Is Happening Now

Several forces have converged to accelerate this moment.

Americans are living longer, allowing assets to compound over extended periods. Many individuals entering their later years benefited from decades of sustained market growth, dramatically increasing the value of retirement accounts, real estate holdings, and privately owned businesses. Together, longevity and market performance have produced estates that are often far larger and more complex than families anticipate.

Yet wealth has grown faster than planning.

“Many estate plans are static while wealth is dynamic,” Ford notes. “People create documents years earlier and assume they will still work, even though their family structure, asset values, and risks have changed.”

Why Planning Is an Act of Care

Estate planning is often misunderstood as a tax exercise or paperwork requirement. In reality, it functions as a roadmap that protects families, preserves intent, and prevents conflict.

Effective planning allows families to address challenges before they escalate. Trust structures can provide what Ford describes as “training wheels” for heirs who are not yet equipped to manage significant portfolios. Clear language can reduce ambiguity in blended families, ensuring spouses and children from prior marriages are treated according to the individual’s wishes rather than default statutes.

Business continuity is another frequent flashpoint. Without an agreed-upon succession plan, profitable family enterprises can be forced into liquidation simply because heirs cannot agree on control or direction.

“Planning is not about control from the grave,” Ford says. “It is about clarity while you are still here.”

The Rising Tide of Probate Litigation

As wealth transfers accelerate, probate courts in America are bracing for an increase in estate-related litigation and similar situations are set to occur in Canada and Mexico. According to Ford, several recurring issues are already driving disputes.

Cognitive decline and undue influence are among the most common triggers. As older adults reach their eighties and nineties, dementia and other impairments become more prevalent. Late-life changes to wills or trusts are frequently challenged by heirs who believe a loved one was pressured or lacked capacity.

Blended family dynamics also play a major role. Modern families often include second marriages, stepchildren, and competing expectations. When individuals die without updated documents, intestacy laws can produce outcomes no one intended, fueling resentment and lawsuits.

Ambiguous or outdated estate plans remain another risk factor. DIY documents and boilerplate language often fail under scrutiny, leaving courts to interpret vague instructions. Fiduciary disputes are equally common when executors or trustees are accused of mismanagement, lack of transparency, or favoritism.

Family-owned businesses present some of the most complex conflicts. When multiple heirs disagree over leadership, equity, or control, litigation can become the only path forward, sometimes ending in forced sale.

“The tragedy is that most of these disputes are preventable,” Ford emphasizes. “They arise not from greed, but from silence, assumptions, and documents that were never meant to handle modern family realities.”

The Bottom Line

The Great Wealth Transfer is not merely a financial event. It is a social and legal reckoning that will test families’ communication, planning, and preparedness. As trillions of dollars move between generations, proactive estate planning has become less about wealth preservation and more about relationship preservation.

For families willing to plan with intention, the transfer can strengthen legacies rather than divide them. For those who do not, the cost may be far higher than they ever expected.

For the Silo, Merilee Kern.

North American Gold Adjusted Wages Reveal A Plummet Towards Traditional Poverty Level

Our friends at The InvestorsObserver research team have looked into how gold affordability has changed over years when compared to American wages. Parallels can be drawn between Canada wages and gold affordability.

They found that despite steady rises in US dollar salaries, the average American’s purchasing power, when measured in ounces of gold, has plummeted by 77% since 1998. 

Gold-adjusted income shows the real purchasing power.

Interestingly, by 2012, even the most prosperous states had wage levels equal to poverty thresholds from just 15 years earlier, revealing the erosion of real wealth, and a plummet to what used to be perceived as poverty level. 

What about Canada wages?

For the Silo, Sam Bourgi 

Florida Pirate Island Hideaway Now For Sale

This feature via our friends at toptenrealestatedeals.com

Black Sam Bellamy was one of the most notorious and wealthiest pirates of the Golden Age of Piracy in the early nineteenth century. In his short pirate career, he captured fifty-three ships, including the English slave ship Whydah Gally, which he used as his flagship.

The famous pirate’s island hideaway, now a stunning resort property, has been listed for sale at $50 million usd. Black’s Island is a seven-acre gem off the coast of the Florida Panhandle, sporting a four-star resort with twenty-six waterfront bungalows. Accessible only by boat, seaplane or helicopter, the white-sand island is about ten minutes from the mainland, offering a spectacular Caribbean adventure without leaving the United States.

The property can be operated commercially or retained as a family compound.

Born in Devon, England, he sailed with the Royal Navy before joining a crew of treasure hunters who turned to piracy when their mission to find a Spanish shipwreck failed. Bellamy served initially under Captain Benjamin Hornigold and his first mate, Edward Teach, later known as Blackbeard. When the crew became frustrated with Hornigold’s refusal to attack English ships, they mutinied and elected Bellamy as their captain instead.  He was generous with those he raided and loved by his crew, who called themselves “Robin Hood’s Men.” This “Robin Hood of the Sea” or “Prince of Pirates” developed a distinctive style, favoring long black coats and forgoing the then-fashionable powdered wig for a dark ponytail tied with a black satin bow.

His favorite weapons were four dueling pistols carried in his sash.

The pirate prince’s reign ended when a nor’easter storm capsized his ships, drowning the captain and most of his crew. The wreckage of the Whydah Gally was discovered in 1982, yielding over 200,000 artifacts, including a cannon loaded with gold and precious stones. 

1982 discovery of Black Sam’s booty made headlines worldwide. image: Irish Sun

The fully furnished bungalows come in one- and two-story models, 1,225 and 1,425 square feet respectively. Each unit includes two bedrooms, a loft bedroom area, two full bathrooms, a spacious kitchen with an island and top-notch appliances, a living room, a dining area, a laundry room and a balcony, while the two-story bungalows have an additional half bathroom. Boasting a classic look with blonde wood walls and grey stone floors, the bungalows were recently remodeled. A round floorplan offers 360-degree views of the gorgeous island from sunrise to sunset. 

In addition to the bungalows, the resort includes a four-story luxury clubhouse, a cabana with bar, beach volleyball courts, and a forty-by-sixteen-foot swimming pool. The island is in the middle of a marine estuary, offering sparkling clear water and numerous opportunities for bird-watching and duck hunting, plus kayaking, paddle boarding, jet skiing and relaxing on the beach. 

Private islands are all the rage among celebrities and the world’s elite. Beyonce and Jay Z are said to own two private islands in Florida, with Leonardo DiCaprio, Eddie Murphy, David Copperfield, and Mel Gibson just a few of the A-listers with private islands outside the USA. 

The listing is held by Jon Kohler of Jon Kohler & Associates. Photo credit: Jon Kohler & Associates.

How To Make Money Quickly?

Having side cash from time to time, or even better continually, is a great source of wealth. 

Not only that it enables you to collect money for something that you really need, but it really can boost your emergency fund, or just let you spoil yourself from time to time. 

To get extra money and get it fast you can do several different jobs from ride-share services to doing some online surveys – they all pay differently, but they all will get you extra money. 

Here are some of the best ways to earn money quickly this year. 

Start With Home Care Services

You will be surprised to learn that additional help in-home care areas are always more than welcome. 

With Boomers retiring and Millennials taking over the job market, it seems only logical for Millennials to provide additional care for senior citizens. Not only that you can find home care services jobs in Canada easily and fast, but next to quick money this type of job will also bring you a safe working environment, great companionship, and also provide you with a flexible work schedule, and an opportunity to learn new skills. 

Sell Your Used Items 

This is an old one, but a gold one. 

Use well-known offline and online marketplaces, such as Craigslist, to sell items that no longer serve you. 

You may not enjoy them anymore, but someone will be more than happy to welcome an original lamp from the 19th century or a preserved CD from ’90. 

Do your best to present the product well:

  • Take great photos
  • Provide an accurate and brief description
  • Post items online

Pro tip: High-quality clothes and perfumes are the first to sell

Think also about selling old electronics, including tablets, fitness trackers, game consoles, and laptops. 

The great thing about electronics is that if you cannot sell them, you can always trade them and get something that you can actually sell.

Freelance Online

Use large platforms for freelancers such as UpWork and Fiverr to get an online gig. 

These sites are more than packed with different opportunities for people of various skills to land a job. Think about a position such as a virtual assistant, or a data entry assistant. 

Good to know: It may take a while to get your first job, but in the long run this can be an ongoing source of additional money.

Can you guess how these gift cards tie in?

10 Ideas On How To Make Money Quickly

  1. Sell unused gift cards
  2. Be an affiliate marketer
  3. Take online surveys
  4. Tutor students
  5. Delivery 
  6. Sell on eBay
  7. Sell photos
  8. Teach English online
  9. Pet sitting
  10. Dog Walking

There are dozens of different ways to earn money quickly and continually. 

Before you start, be honest and know how much time you can invest in working on the side. 

Once you determine that know what skills you can actually use to get that extra money. From there, find a place where your skills can be put to good use and sold. 

In the meantime, check your loft and see what you have around collecting dust and sell.

Families That Fight Over Inheritance

The recently deceased don’t always ingratiate themselves with their survivors when it comes time to read the will.

“People want to control things from the grave, not just throw a bunch of money in a beneficiary’s lap,” says family wealth guru John Pankauski, author of the new book, “Pankauski’s Trustee’s Guide: 10 Steps to Family Trustee Excellence.”

It’s their money so that’s their right.Fighting Over Money

But family members aren’t always crazy about how the deceased divided up the money or, if the inheritance was put into a trust, the restrictions that are placed on how the money is spent.

And often ill feelings among family members can bubble to the surface when money is at stake.

“I deal with sibling rivalries, petty jealousies and childhood grudges played out by adults who are decades older, but no more mature,” says Pankauski, founder of the Pankauski Law Firm (www.pankauskilawfirm.com), which specializes in trust and estate law. “It makes me think that part of my job is to be a wealth psychologist.”

Often, an inheritance isn’t doled out immediately. Instead, it’s placed in a trust with a trustee to oversee it, making decisions on when and how to distribute the money based on the terms of the trust.

In many situations, that works out fine. But in seriously dysfunctional families, that can make a bad situation borderline intolerable.

Sense Of Entitlement

Pankauski says any number of factors can lead to family feuds or general disgruntlement over an inheritance. Here are just a few:

•  Sense of entitlement. Many beneficiaries have a misplaced sense of entitlement to an inheritance. They just expect that mom or dad will leave them money or property. In their minds, it’s what they have coming to them. “The truth is, you can dispose of your property any way you want,” Pankauski says. “There is no right to an inheritance and just about anyone can be disinherited.”

So if people want to leave their money in a trust for a family pet, or bequeath everything to a neighbor, a mistress or a charity, they have every right to do so, assuming they are competent and know what they are doing. “It’s their money,” Pankauski says. “They can do with it as they wish.” Other than dealing with a spouse, there are almost no restrictions.

•  The audacity of the trust. Family members often become frustrated and angry when they realize they inherited money, but it’s in a trust and there are strings attached.  “The beneficiaries view trusts as handcuffs on their money,” Pankauski says. “A trust takes all those family members’ personal feelings and emotions, all that baggage, and adds money to create a financial stew into which the beneficiaries are thrown.”

Often, because beneficiaries don’t like it that a trustee gets to make decisions on when and how they get a portion of their inheritance, family members will seek counsel and try to “bust the trust.”

•  An implied accusation of financial irresponsibility. At some point it may begin to dawn on beneficiaries that one reason the inheritance was placed in a trust is that the deceased didn’t view them as responsible with money. “That may seem insulting, but it doesn’t have to be,” Pankauski says. “Many would argue that most people are irresponsible with money, particularly a large sum of inherited money that appears out of the blue, much like winning a lottery.”
Sometimes at least a portion of the family animosity might be avoided by better planning when the will is being written and the trust created.
“When beneficiaries don’t get along,” Pankauski says, “it may make more sense to cut their financial ties by either creating multiple separate shares within the trust or creating separate trusts altogether.”

For the Silo, John Pankauski, LLP.


Should You Take Out a Second Mortgage?

With housing prices cooling off a bit but still generally soaring in cities across Canada, many homeowners are asking themselves how they can cash in on the market without actually having to sell their property. For many, a second mortgage will be the ideal way to do so.  

Second mortgages are one of the perfect mortgage solutions for homeowners who want to tap into their home equity to get lump-sum cash payments at low rates of interest. If you want to know if a second mortgage is right for you, here are three questions you should ask yourself. 

1. How Much Home Equity Do I Have? 

Before you start approaching mortgage brokers about a second mortgage, it’s a good idea to do some calculations around home equity, as the amount of money available to you through a second mortgage is determined by how much home equity you have.  

Fortunately, home equity is easy to calculate: simply subtract your existing mortgage from the current market value of your property. The difference is your home equity — the amount of your home value that you own outright.  

If you don’t know how much your home is worth, you can use a free calculator like this one to get a general estimate based on the going rate for properties in your neighbourhood. 

2. Should I Get a Home Equity Loan or Refinance? 

Generally speaking, there are two ways a homeowner can cash out a percentage of their equity: through refinancing or through a second mortgage. Both can be good ways to unlock capital, but which option you go for will depend in part on your financial situation. 

  • Refinancing: When you refinance your home, you replace an existing mortgage loan with a new mortgage loan. This new loan can be negotiated to include a cash payout based on your home equity, and while cashing out will likely extend the time it takes to pay off your mortgage, you will still only be dealing with a single mortgage loan.  
  • Second Mortgage: A second mortgage is an additional mortgage loan taken on against your home equity. Because it is an additional loan, it will usually come at a higher interest rate. 

In Canada, most mortgages are refinanced every five years, but they can also be refinanced more frequently. But if you already have a low interest rate on your existing mortgage and rates are increasing, a second mortgage may be the cheapest way to turn equity into cash. 

3. Will this Loan Save Me Money? 

A second mortgage can be a powerful financial tool, but it isn’t free money: you will still need to pay it back with interest, so you should be careful about how you use it.  

Taking out a second mortgage to consolidate debt, or to build an addition on your house, are smart investments because they put your money to work by reducing your interest payments or enhancing the value of your property. This puts you in a better financial position than you would have been if you didn’t borrow the money.  

Doing a cost/benefit analysis and working out how much money borrowing against home equity will save you is the key to making a strategic decision. 

Given how much real estate values have gone up over the past few years, figuring out how you can use your newfound wealth to improve your financial situation is essential for good money management. If you want to know more about whether a second mortgage is right for you, get in touch with a local mortgage broker to explore interest rates and options.  

Feautured image: Precondo CA Via Unsplash/ Silo Content Production

Who Owns Which Celebrity Mansion? Take The Quiz And Find Out

This piece quizzes you by presenting the interior of some of the most lavish celebrity homes and asking which celebrity owns the property.

Look closely and think before making your choices- there are clues hidden…..somewhere.


How You Feel About Money Affects Your Wealth

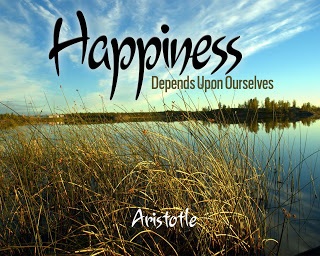
Ah, Aristotle- penchant of ancient greek wisdom. Nicely said, Dude. Although we live in the richest and most advanced society the world has ever known, many of us say we need more money in order to be happy, notes best-selling business book author Doug Vermeeren.

“Even some of those in the top percentile of earners often feel like they don’t have enough money,” says Vermeeren, (www.DouglasVermeeren.com), an international speaker who consults with celebrities, business executives and professional athletes.

“The math is simple: More money does not equal more happiness. It’s our attitude toward money, not the amount, that influences our happiness the most.”

Doug Vermeeren was interviewed earlier this year by Shaw. You can watch this by clicking on the link below at the end of the article. CP

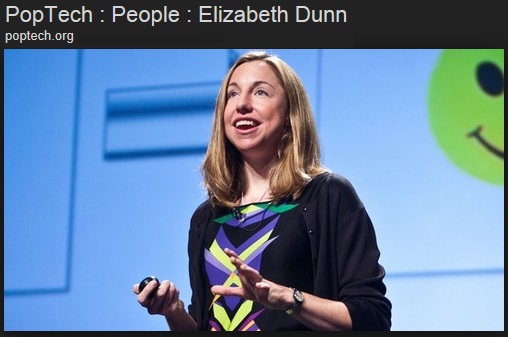
Happiness researchers Elizabeth Dunn and Michael Norton, professors at the Harvard Business School, recently published research indicating that it’s not money that makes people happy, nor the things people buy with it. Rather, it’s the experiences one has that ultimately account for happiness.

“How you experience your money on a day-to-day basis is what matters,” Vermeeren says. “If the software running in your brain is constantly reinforcing the message, ‘it’s not enough,’ then that is likely how you will see yourself and experience your life – as ‘not enough.’ ”

The world’s richest city- is it Tokyo or Dubai? The top ranking seems up for grabs and changes from year to year.

Harvard's Happiness researcher (we're not making this stuff up) Elizabeth Dunn
Harvard’s Happiness researcher  Elizabeth Dunn

Vermeeren reviews the three fallacies of abundance as it relates to happiness:

• We are all entitled to a certain amount of wealth: The feeling that we deserve or are owed a certain amount of wealth will always make us unhappy with whatever we have. While we are entitled to certain human rights, those do not include a winning lottery ticket. In reality, we are not owed any amount of abundance and, in fact, should count ourselves lucky if we’re able to meet our basic needs; many in the world are not. More of us, however, would be happier simply appreciating what we have.

• The result of our labors is money: Money is a means to an end, not an end in itself. This can be a challenge to keep in mind since so much of our lives are spent in the pursuit of money. We work and go to school to support ourselves and our families. We see things we want, and we know we need more money for them. Study after study shows, however, that what really makes us happy is what we do and who we do it with, and not how much money we spend.

• We’ll be happiest when we finally reach our goal: We are happiest when we are progressing toward a goal. When we lose sight of our goal, veer off the path toward our goal, and even achieve our goal, we’re less happy. Rather than setting one goal and deciding you will be happy when you meet it, you’ll be most happy if you continually set goals and relish your journey toward them.

Doug Vermeeren is an internationally renowned public speaker, author, movie producer and director. His life coaching strategies help those from all walks of life, with clients including business executives, celebrities, professional athletes and more. Throughout the last decade, Vermeeren has conducted extensive first hand research into the lives of more than 400 of the world’s top contemporary achievers, making him a sought-after commentator on news outlets including ABC, FOX, CNN and more. He has written three titles contributing to Guerilla Marketing, the best-selling business series in publishing, which is included reading in the Harvard Business School.

His documentaries include the award-winning film, The Opus, which has been published by Random House as a book in 23 countries. Vermeeren’s latest film, The Gratitude Experiment , has received critical acclaim.  For the Silo, Ginny Grimsley. 

Click to view on I-tunes

Toronto Drops To Sixth As Washington DC Enters World Safety City Index

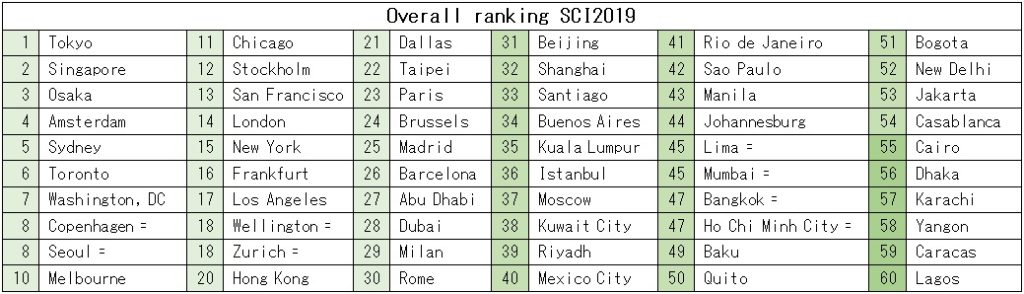
Tokyo edges Singapore (2nd) and Osaka (3rd) again to take the top spot globally in 2019.Two North American cities make up the top ten, including Toronto (6th) and Washington, DC, (7th).The remaining top ten cities are: Amsterdam (4th), Sydney (5th), Copenhagen and Seoul (tied 8th) and Melbourne (10th).The 2019 edition of the index includes ten new indicators, of which eight are related to environmental resilience. 

The Economist Intelligence Unit today releases the third edition of the Safe Cities Index (SCI) at the Safe Cities Summit in Singapore. The index, which is the centre piece of a research project sponsored by NEC Corporation, ranks 60 cities worldwide across five continents. It measures the multifaceted nature of urban safety, with indicators organised across four pillars: digital, infrastructure, health and personal security.  

Cities in the Asia-Pacific (APAC) region make up six of the top ten safest cities, with Tokyo taking the top spot for the third time in a row. Along with Tokyo, other APAC cities, as in the past, dominate the SCI2019. Singapore and Osaka come second and third, while Sydney and Melbourne also make the top ten.  

Toronto and Washington, DC, are the highest ranked North American cities in the SCI2019, with Washington, DC, entering the top ten for the first time. Overall, North American cities perform well in digital security, accounting for seven of the top ten cities in this category. These cities include Chicago, Washington, DC, Los Angeles, San Francisco, Dallas, New York and Toronto. 

Vaibhav Sahgal, consultant at The Economist Intelligence Unit, says: “US cities continue to perform well in digital security as the government strengthens its cyber-security regulations, while Canadian cities tend to fare better than their US counterparts in personal security. None of the cities in the US make it into the top 20 in the personal security category—Washington, DC, only ranks 23rd, together with Shanghai.” 

The SCI2019 benefits from a major revision designed to better capture “urban resilience”—the ability of cities to absorb and bounce back from shocks—a concept that has had an increasing influence on thinking in urban safety over the last decade, especially as policymakers worry about the implications of climate change. The 2019 edition is the third, following the 2015 and 2017 iterations.The SCI2019 scores are not evenly spread, with a large number of cities clustered at the top, and the rest showing wider variation in scores. Just ten points separate the overall scores of the top 24 cities, while the following 36 are 40 points apart. The research shows that levels of transparency in cities correlate as closely as income with index scores. 
Research shows that the performance of different safety pillars correlates very closely with each other, signifying that different kinds of safety are thoroughly intertwined. The top performers in each pillar are as follows: Digital security: Tokyo (1), Singapore (2), Chicago (3), Washington, DC, (4), Los Angeles/San Francisco (5)Health security: Osaka (1), Tokyo (2), Seoul (3), Amsterdam (4), Stockholm (5)Infrastructure security: Singapore (1), Osaka (2), Barcelona (3), Tokyo (4), Madrid (5)Personal security: Singapore (1), Copenhagen (2), Hong Kong (3), Tokyo (4), Wellington (5)
The leading cities got the basics right, including easy access to high-quality healthcare, dedicated cyber-security teams, community-based police patrolling and/or disaster continuity planning. The accompanying SCI2019 report explores the index results, incorporating 14 in-depth interviews with industry experts around urban safety. 

Naka Kondo, senior editor at The Economist Intelligence Unit, and editor of the SCI2019 report says: “Overall, while wealth is among the most important determinants of safety, the levels of transparency—and governance—correlate as closely as income with index scores. Our research shows the many ways that transparency and accountability are essential in every pillar of urban security, from building safer bridges to developing the trust needed for relevant stakeholders to share information on cyber-attacks. The research also highlights how different types of safety are thoroughly intertwined—that it is rare to find a city with very good results in one safety pillar and lagging in others. Policies, service planning and provision should also take this into account—and this year, we have decided to convene stakeholders from around the world in a Safe Cities Summit to discuss such matters around urban safety.”

How Societies Become Consumer Cultures Through Housing

Alfred Marshall’s (Principles of Economics, 1891) view of housing still goes right to the heart of what makes housing and built environment an important anthropological topic. No artifact is so clearly multi-functional, simultaneously a utilitarian object of absolute necessity, and an item of symbolic material culture, a text of almost unending complexity.

In every house the economic, social and symbolic dimensions of behavior come together. This may be why the analysis of housing has had such a wide appeal in disciplines as diverse as social psychology, folklore, economics and engineering. Anthropologists themselves have shown a new willingness to consider the house as a key artifact in understanding the articulation of economic and social change during economic development.

An ethnocentric home.

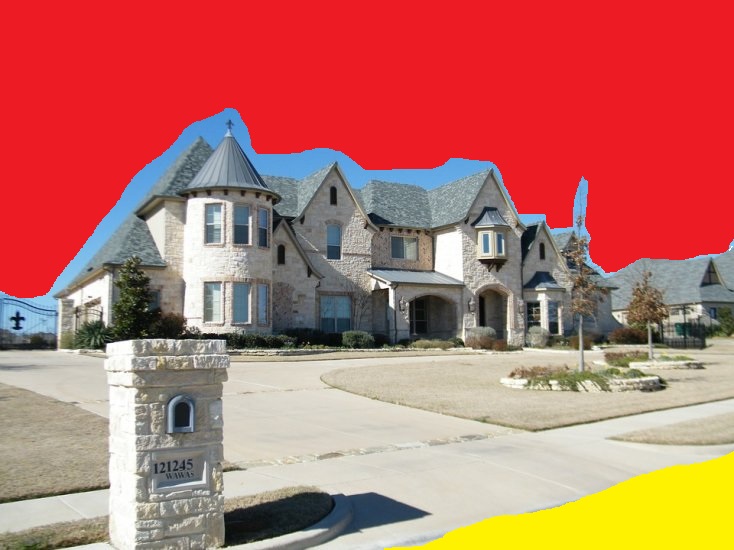
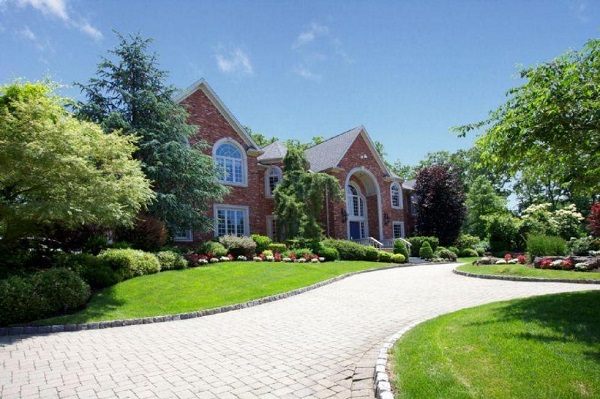
From the perspective of our own contemporary society, surrounded by houses of all shapes and sizes, where wealth and luxury are synonymous with housing, this seems obvious and commonplace. The 1980’s television show “Lifestyles of the Rich and Famous” and journals like “Architectural Review” are odes to the home as a shrine and symbol of wealth. But just as clearly, there are societies where all the houses look alike, even though all the people are not alike. Perhaps then, the assumption that there is something natural and obvious about spending on the house and home market as a marker of prestige is ethnocentric. Why the house instead of something else?

A number of anthropological approaches attempt to place the house in a theoretical context which answer this question by relating housing to social, economic, and psychological variation and change. For example, a utilitarian approach that views the house partially as a workspace links changes in the elaboration of houses to changes in the kinds of work done in the household (Braudel 1973:201). Or if the house is seen as a reflection of how all household activities are organized and divided, then the shape of the house will change as activities are modified, differentiated, or recombined (Kent 1983, 1984).

Utilitarian houses.

An even more utilitarian perspective relates the form of the house to climate, technology and the kinds of building materials that are available (Duly 1979).  For the Silo, Richard R. Wilk.

Read on..click here and read the full PDF document on your device.

Supplemental- Complete Text  Principles of Economics (London: Macmillan and Co. 8th ed. 1920).
Author: Alfred Marshall
About This Title: This is the 8th edition of what is regarded to be the first “modern” economics textbook, leading in various editions from the 19th into the 20th century. The final 8th edition was Marshall’s most-used and most-cited.

Top Ways Folks Go Broke

Being broke sucks and you don’t have to come from a wealthy family, have the next  billion-dollar idea or work 18-hour days to become rich, says self-made millionaire Mike Finley. In fact, you don’t have to be extraordinary in any of the headline-grabbing ways. What you need is the self-awareness to avoid wasting Financial Happiness.

“Money used wisely can give you financial security ”

Finley lists 10 of the most common money traps that lead to consumers going broke:

1- Making the appearance of wealth one of your top priorities by acquiring more stuff. The material trappings of a faux lifestyle, as seen in magazines and advertisements, are not good term happiness.

2- Working a job you hate, and spending your free time buying happiness. Instead, find fulfilling work Monday through Friday so you are not compensating for your misery with expensive habits during the weekend.

Even worse than living paycheck to paycheck- advance loan on your paycheck.

3-  Living paycheck to paycheck and not worrying about saving money. Don’t live for today, as if that’s all that matters. Have you already achieved all of your dreams by this moment? If not, embrace hope and plan for tomorrow. (Appreciating your life today doesn’t require unnecessary expenditures.)

4-  Stopping your education when someone hands you a diploma; never reading a book on personal finance. Just about any expert will tell you that the most reliable way out of poverty is education. Diplomas shouldn’t be the end of learning; they should be a milestone in a lifetime of acquiring wisdom.

5-  Playing the lottery as often as possible. While you’re at it, hitting the casino! Magical thinking, especially when it comes to money, is a dangerous way to seek  financial security.

6-  Running up your credit cards and making the minimum payments whenever possible. Paying interest on stuff you really don’t need is a tragic waste of money.

7-  When you come into some free money, spending it. Feeling like you deserve it. By that logic, you’re saying that a future version of you doesn’t deserve the money, which can be multiplied with wise investments.

8-  Buying the biggest wedding and the biggest ring so everyone can see just how fabulous you really are. Nothing says “Let’s start our future together” like blowing your entire savings on one evening.

9-  Treating those “amazing” celebrities and “successful” athletes as role models. Trying to be just like them whenever possible. As far as we know, there’s only one you the universe has ever known. Don’t dilute your unique individuality by chasing an image.

10-  Blaming others for your problems in life. Repeat after me: I am not a victim. The victim mentality is an attempt to rationalize poor habits and bad decision-making.

“If you’re feeling uncomfortable with your financial situation, don’t just sit there in a malaise of ‘If only I had more money,’ ” Finley says. “Instead, use it as motivation for a better life; that’s why the discomfort is there.”

Like most North Americans, Mike Finley was raised with no education in personal finances. Joining the Army out of high school, he realized he didn’t understand money management and began the task of educating himself. After 26 years in the service, during which he practiced the principles he learned, he retired a millionaire. Finley is the author of “Financial Happine$$,” and teaches a popular financial literacy class at the University of Northern Iowa.  For the Silo, Jarrod Barker.

New Millennial Trading App White Shark

Toronto, ON  — White Shark Fintech, Inc. (the “Company”) a revolutionary free artificial intelligence based trading platform that flourishes in volatility and allows its users to better control their assets, including crypto-currencies, launched recently across Canada. A popular tool among young traders looking for simple ways to buy and sell crypto-currencies, the app has created a waiting list to manage user demand.

The free-to-use app takes speculation out of trading by employing high performance algorithms that signal a user when markets for particular securities, including cryptos,  are likely “over bought” or “over sold”. With White Shark users no longer have to guess or rely on self proclaimed experts about the price at which they buy or sell cryptos and other securities.

“Fintech companies, like White Shark, that engage millennials have earned multi billion dollar valuations. With the growing hunt for millennial assets and engagement with other apps, we decided to make the White Shark experience fun, empowering and engaging – regardless of where they hold their assets.” said founder and chairman Marc Wade, “White Shark is truly a user experience company engaging millennials in the capital markets when and where they want.”

WhiteShark Fintech App“White Shark is a game changer.” White Shark app enthusiast Ryan Kesler of the Anaheim Ducks explains. “It’s so easy and fun to use.  Buying and selling crypto has become part of my daily routine. There’s no guess work in making money – the accuracy of the algo trading is the only way to go.”

White Shark’s machine learning algorithms compile market data trends and price book movements into 4 gauges that work together to signal market movements. The app provides the user the ability to respond to changes in market conditions before other traditional indicators.

Now users no longer have to trade blind. Gdax (Coinbase), with over 11.9 million users, is one of the exchanges that can be connected to White Shark.

“So called “experts” have been making speculative and incorrect calls on bitcoin and other cryptos for too long.” Said CEO Stuart Shanus

Stuart Shanus CEO White Shark
Stuart Shanus

“Our free trading app isn’t based on speculation. It’s based on mathematical models and machine learning algorithms – and it should be the go-to app for investors whether they are buying and selling crypto-currencies, fiat currencies or equities.”

Investors using the White Shark app connect their preferred broker account including tCoinbase (gdax) , Kraken, Bitfinex, Poloniex and Hitbtc.  For the Silo, Amy Saunders. 

About White Shark

White Shark is a revolutionary free artificial intelligence based trading app that pairs investors with  real time artificial intelligence (AI) to increase returns and mitigate risks.  White Shark’s high performance algorithms have been used for 17 years by professional traders who have achieved exceptional returns.

Interesting Book On Trade And Civilization Prehistory To Early Modern Era

This book provides the first global analysis of the relationship between trade and civilization from the beginning of civilization around 3000 BC including the Silk Road, the Indian Ocean trade, Near Eastern family traders of the Bronze Age, and the Medieval Hanseatic League, it examines the role of the individual merchant, the products of trade, the role of the state, and the technical conditions for the land and sea transport that created diverging systems of trade and developed global trade networks.

Trade networks, however, were not durable. The contributors discuss the establishment and decline of great trading network systems, and how they related to the expansion of civilization, and to different forms of social and economic exploitation. Case studies focus on local conditions as well as global networks until sixteenth century when the whole globe was finally connected by trade.
Trade and Civilization results from a three-step academic venture. The idea for this book originated in two Swedish interdisciplinary conferences on Global Histories held in 2011 and 2012, where a number of central research themes were identified and discussed. It inspired three editors to propose a carefully prepared international follow-up conference on the theme of trade and civilization that should lead to (this) a book.

Click here to continue reading full book text in PDF.  For the Silo, Christian Christiansen. 

Google Fined Billions By EU For Breaking Competition Law

Ariel Ezrachi, director of the University of Oxford Centre for Competition Law and Policy, says “it objects to Google leveraging its power in search to give itself an unfair advantage in price comparison.” That’s one in the eye for Silicon Valley’s “winner takes all” attitude. Google are well equipped to handle a fine though, even one that sounds so hefty. Alphabet, Google’s parent company, made a profit of almost £2 billion in the first six weeks of 2017 alone.

So, it sounds like that fine is just a drop in their considerably large ocean. But it’s still hard to imagine such a huge amount. Which got us thinking. If the average Joe were to be fined in a relative way, what would that look like? Maybe something like this infographic from credit.angel.co.uk.  Much easier to understand (and far less than I imagined to be honest!) For the Silo, Danielle Mowbray.


Real Estate Bubble? Celebrities Forced To Reduce Asking Price On Homes By Millions

Both Celine Dion and Puff Daddy have vastly reduced the prices on their mansion homes, featured this week at TopTenRealEstateDeals.com.

“Celine Drops Price on Florida Water Park Home” Grammy Award-winning Canadian singer Celine Dion and her manager husband, René Angélil, built their dream Florida home on Jupiter Island in 2010. The location offered the privacy the hard working couple wanted to relax with their children and friends and they designed an estate around a series of water features and outdoor sports activities that, along with pristine beachfront, took full advantage of the Florida sunshine and Atlantic Ocean breezes. But even for celebrities who seem to have achieved it all, life can throw curve balls.

For Sale -Now Reduced! Celine Dion's Florida home.
For Sale -Now Reduced! Celine Dion’s Florida home.

Though René had successfully fully recovered from a bout of throat cancer in 1999, it reoccurred in 2013 when he had surgery for another malignant throat tumor. Dion announced in 2014 that she would suspend her performances indefinitely due to her husband’s worsening health. In August of 2015, she resumed her Las Vegas residency at Caesar’s Palace, but lost René to cancer in January 2016 and her brother only two days later. The couple and their three children had made the Las Vegas bedroom community of Henderson their home while Dion was performing at Caesar’s Palace. She returned to the stage on February 23rd for the first time since René’s death and paid tribute to his memory and their life together in her first performance.

Their Bahamian-inspired Florida oceanfront estate was first put up for sale in 2013, the year that René was re-diagnosed, for $72.5 million. Over a period of time with no buyer interest, the price was cut to $62.5 million and recently reduced to $45.5 million.

Among many five-star features, the 5.5-acre beachfront property’s centerpiece is the 500,000 gallon water park highlighted by a slow-current lazy river connecting two pools, bridges and a twisting water slide. There is also another pool located beachside. The two-story, 10,000-square-foot main residence has five bedrooms with a second-level wraparound terrace with ocean views and multiple main level terraces. The luxurious master suite walk-in closet has automated carousels for quick access to shoes and clothing at the touch of a finger. The open-plan main level is light and airy in keeping with the subtropical climate. There are also two separate four-bedroom guest houses, tennis house, simulated golf range, pool house and beach house. Celine’s Jupiter neighbors include Michael Jordan and Tiger Woods, and Palm Beach is just a few miles down the road.

Now settled in Nevada at least until the end of her Caesar’s Palace residency in 2019, Celine has stepped up her effort to sell her resort estate by engaging a new brokerage and lowering the asking price. Fenton Lang Bruner & Associates in Jupiter Island holds the listing.

“Puff Daddy’s New Jersey Mansion” Whether called Puff Daddy, Puffy, P. Diddy, or his real name Sean Combs, the Grammy-winning rapper, actor and businessman is frequently in the news, whether for his recordings, his charity or his clothing line. Most recently, he has signed on as Pharrell Williams’ team adviser for season ten of “The Voice.” Listed as number one by “Forbes” as the wealthiest hip hop artist of 2015 with an estimated net worth of $735 million, Sean has reduced the price on his New Jersey mansion  several times, now at $7.89 million.

For Sale- Now Reduced!- Puff Daddy's NJ home.
For Sale- Now Reduced!- Puff Daddy’s NJ home.

Combs purchased his elaborate 3.25 acre estate in Alpine in 2004 for $6 million. Built in 1999, the home has all the glamour and amenities expected in the home of one of America’s most popular celebrities. The 8,000-square-foot home has six bedrooms, six baths, foyer with double staircase and expansive formal rooms with walls of glass filling the interior with light. The basement is the activity heart of the home with its own kitchen, wet bar, home theater, an aquarium and another bedroom with full bath. There is also an indoor basketball/racquetball court and a fully equipped gym with full bath. Outside is a swimming pool with waterfall, putting green, a lighted tennis court and a six-car attached garage. Originally, Sean put the property on the market in 2011 at $13.5 million. Without a buyer, he pulled it from the market and relisted it again in 2015 at $8.5 million. Again with no buyer, he has once again dropped the price to $7.89 million. The listing agency is Sotheby’s International in Alpine, New Jersey. For the Silo, Terry Walsh.

Visit TopTenRealEstateDeals.com for more famous, spectacular and celebrity homes and real estate news.

CNBC’s “Secret Lives of the Super Rich”

Secret Lives Of The Super Rich

CNBC’s half-hour primetime series “Secret Lives of the Super Rich,” premiered Tuesday, June 10th at 10PM & hour episodes began airing each Tuesday for four consecutive weeks.

Reported by CNBC’s Robert Frank and featuring New York City super broker Dolly Lenz, “Secret Lives of the Super Rich” unlocks the mansion gates and gives you rare access to a world inhabited by the wealthiest people on the planet. Here’s a sneak peek courtesy of The Silo:
http://video.cnbc.com/gallery/?video=3000236913.

Dolly Lenz
Dolly Lenz

In the first episode, we met a man who’s taken his lifelong Lamborghini obsession from land to water. Also, “Secret Lives of the Super Rich” gets a rare invite on a luxury safari where there’s no shortage of wild life, or champagne. And, an exclusive look inside a Star Trek mega-mansion that may have you wondering if it’s actually the Starship Enterprise (video: http://www.cnbc.com/id/101735785 also see Star Trek Home Theater profiled here at the Silo: https://www.thesilo.ca/beam-me-up-35000000-usd-home-theater-for-sale-in-boca-raton/)


Dover Cheese Shop