A print of George Washington by Valentine Green. (National Gallery of Art)
George Washington, who as a general led America to independence from Britain and who went on to serve as the first U.S. president, also nurtured a lifelong interest in men’s fashion.
Washington recognized his attire sent a signal about America’s standing in the world, according to Suited to Lead: The Lives of Six Presidents Through Fashion , an online exhibit of the White House Historical Association. (The exhibit also explores the fashions of presidents John Quincy Adams, Abraham Lincoln, Theodore Roosevelt, Harry S. Truman and Jimmy Carter.)
Washington “thought deeply about what his choices conveyed to the public,” says Fiona Hibbard, a graduate student in New York University’s Costume Studies program. Hibbard curated the exhibit while an intern at the society in 2025.
“Washington was interested in projecting an image of authority, unity and American identity,” she says.
The exhibit highlights how Washington’s sartorial choices conveyed leadership and created an early-American aesthetic that endured for generations.
Washington chose blue for the uniforms of the Continental Army to present colonial militias as unified and to clearly differentiate the fighters from British soldiers, known as “redcoats.”
Federal Gazette, January 7, 1789
As a military commander and later as president, Washington appeared in portraits wearing a blue coat trimmed in yellow, with matching waistcoat and breeches.
Blue and yellow remained the colors of the United States Army until the Civil War in the 1860s.
Washington also adapted military uniforms to better suit soldiers to their environment by replacing breeches, which only came to the knee, with full-length trousers that better protected the soldiers’ legs as they climbed or scrambled on difficult terrain.
Washington supported American manufacturers, Hibbard says, “something most Americans can relate to and take pride in.”
Before being sworn in as the country’s first president, he ordered high-quality American wool from a Connecticut manufacturer for his brown inaugural suit . He had deliberately avoided using British-imported fabric, according to the Mount Vernon Ladies’ Association, which runs Washington’s Virginia estate. Though commonly known as “London Brown,” Washington’s fabric became known as “Congress Brown,” a nod to the new country’s representative form of government.
“George Washington’s inaugural suit was more than attire — it was a statement of national identity,” the association says.
Washington wore American-made wool for his April 30, 1789, inauguration as the first U.S. president. (Library of Congress, Courtesy of the Mount Vernon Ladies’ Association)
As the blessed month of Ramadan approaches—bringing with it the values of mercy and solidarity—this year arrives amid a profoundly harsh humanitarian reality across vast regions of the Arab world.
Among the scattered tents of displacement that have become refuge for the uprooted, and in homes reduced to rubble—leaving behind only ruins, grief, and the names of the missing—some fasting individuals will observe Ramadan at meager tables, continuing their daily struggle to secure the simplest iftar meal after long hours of fasting. Others will fast without knowing how they will obtain their next meal.
Millions of Meals and Thousands of Beneficiaries
Humanitarian initiatives multiply each year, yet their impact varies. Some alleviate hardship, while others fall short of addressing the depth and complexity of ongoing crises.
For 33 years, LIFE for Relief and Development has mobilized its efforts to fulfill its humanitarian mission during the holy month of Ramadan by implementing relief programs focused on meeting the basic needs of the poorest and most vulnerable families. Through the distribution of food parcels and the organization of communal and individual iftar meals, LIFE’s assistance reaches hundreds of thousands of families in need worldwide.
LIFE teams were present in 37 of the 60 countries where the organization operates sustainable development and relief projects. During Ramadan 2025, nearly 6 million meals were distributed through 16,000 nutritionally balanced food baskets. Additionally, 51,000 freshly prepared hot meals were provided, benefiting approximately 97,000 fasting individuals in need.
Gaza: A Communal Iftar Amid the Rubble
Gaza stood at the forefront of LIFE’s efforts. Amid the devastating landscape and the remnants of war, displaced families recall memories of past Ramadans—when loved ones gathered around one table and smiles preceded the meal. Though those scenes now seem distant, LIFE continues to revive the spirit of solidarity, instilling a glimmer of mercy and hope in hearts exhausted by crisis.
LIFE worked to provide food security for 2,883 families—sufficient to sustain them for three months—alongside organizing communal iftar gatherings open to anyone in need. Despite being held atop the rubble, these gatherings brought moments of joy to attendees.
In addition, Eid celebrations were organized for orphans, benefiting 7,660 orphaned families, including 1,200 families at a special Gaza orphan event. Iftar and suhoor meals were also distributed at Al-Aqsa Mosque.
Confronting Famine in Sudan
From Sudan, we spoke with Ms. Rima Bakir, LIFE’s Projects Coordinator in Sudan, who described the scale of suffering:
“Ramadan will arrive for many children in Sudan not with joy, but with hunger and deprivation. They will welcome the month with empty stomachs, fear, exhaustion, and severe food shortages.
Pregnant and nursing women suffer from malnutrition and increasing health risks, while widows bear a doubled burden in securing food for their children after losing the family breadwinner amid rising living costs. They are living through daily hardship and a continuous struggle for survival.
Over the past year, we tracked displaced families in Kassala, where we provided suhoor and iftar meals to 845 families affected by the war. We also distributed nutritionally integrated food baskets weighing approximately 30 kilograms to support children’s healthy growth, in addition to providing clothing for orphans.”
Targeting the Poorest and Most Remote Communities
Regarding this year’s anticipated activities, Omar Mamdouh, Director of Projects, stated:
“We will intensify our teams’ efforts in the poorest areas facing potential famine, according to United Nations reports. We plan to support vulnerable families and displaced populations in crisis zones by strengthening social solidarity and spreading joy through food assistance projects, organizing iftar gatherings, and distributing hot meals and food baskets in remote areas often beyond the reach of charitable organizations.
Before Eid, we will also implement orphan sponsorship initiatives by providing Eid clothing, gifts, and financial and food assistance. We will distribute zakat and charitable donations to the most deserving beneficiaries, in addition to facilitating fidya and kaffarah contributions.”
Ranked Third Among the Best Organizations Fighting Poverty and Hunger
Vicky Robb, Director of International Programs, added:
“We will expand our food assistance projects in developing countries, particularly in displacement camps where children are suffering—such as those along the Pakistan-Afghanistan border, in war-affected regions of Sudan and parts of Africa, and in countries facing silent poverty in Southeast Asia.
LIFE distinguishes itself by strategically targeting areas inaccessible to most relief organizations—whether due to the severity of war, as currently in Gaza, Sudan, and Lebanon. Our teams have delivered Ramadan meals and food baskets on foot. In Bangladesh, they navigated deadly floods by boat to reach the hungry. In Afghanistan, despite mud and extremely difficult terrain, food was transported on horseback. In Tanzania, our teams left their own families for days to reach remote communities where hunger persists and infants cry silently from malnutrition. They relied on multiple forms of transportation to ensure aid reached beneficiaries before the start of the holy month.”
PS Audio Introduces Its First-Ever Subwoofer: the Foundry F12 With DSP Room Correction–
New subwoofer features a custom high-excursion woofer, built-in amplification and versatile DSP room correction technology–
Boulder, Colorado, February, 2026 – our friends at PS Audio have just the introduced the Foundry F12 subwoofer, the company’s first ever subwoofer.
The Foundry F12 is a ground-up design featuring a high-excursion 12-inch woofer, 1,000 watts of built-in amplification, and advanced room mode correction technology that works in conjunction with PS Audio’s new Foundry control app.
“Designer Chris Brunhaver and I have been working on an ultimate-quality subwoofer for a long time,” said Paul McGowan, PS Audio CEO. “The Foundry F12 is the logical complement to our Aspen series loudspeakers – or any high-quality speaker. With the Foundry F12, reference-quality bass is not limited by room size, placement constraints, or compromise, and the built-in DSP room correction makes it easy to achieve accurate in-room low-frequency response.”
The PS Audio Foundry F12’s driver is a completely new design. It has an extremely long throw – greater than 2-1/2 inches – with a large 10-inch graduated Nomex spider. The motor structure utilizes large magnets, dual shorting rings and other elements to maintain a constant magnetic field throughout the driver’s excursion. The driver employs a paper cone with a carbon fiber dust cap, for high stiffness, low mass, and internal damping.
Ultimate High Current Subwoofer
The Foundry F12 includes a built-in 1,000-watt-continuous high-current amplifier with a massive 1,800-watt power supply. The result is a driver that delivers clean, articulate bass to below 20 Hz, with a fast, accurate response even at high output levels.
The Foundry F12 can be thought of as not just a subwoofer, but a solution to the low-frequency response anomalies every room has. The F12 employs the new Foundry control app, a purpose-designed app for iOS and Android that enables easy setup right from the listening chair. The Foundry app compensates for a listening room’s peaks and dips, (areas of bass reinforcement and cancellation) where most room problems occur.
The user can adjust the Foundry app’s settings either manually or via an auto EQ function. Comprehensive control is provided of volume, crossover point, delay, and parametric EQ. To use the automatic EQ, no external measurement mic is required; the listener just has to point their phone from the listening position and the app does the rest.
If desired, the user can tweak a variety of settings including EQ, high- and low-pass filters, phase, and more, and create custom user presets – for example, one preset for music and another for movies, or a setting for late-night low-volume listening. In addition to remote operation, the Foundry F12 offers rear panel controls, and a comprehensive set of balanced, single-ended and speaker-level connection options.
As an option, a wireless transmitter module is available, to eliminate the need for connecting cables. The transmitter utilizes WiSA E 24/96 wireless technology for extremely low latency and exceptional fidelity, and is compatible with other WiSA devices. For larger rooms and systems, an optional stacking kit enables multiple Foundry F12 subwoofers to be securely connected together for increased output and headroom.
The PS Audio Foundry F12 subwoofer is currently available in satin black or satin white at a suggested US retail price of $2,749 usd/ $3,721 cad. The optional wireless transmitter is available at $199 usd/ $269 cad and the stacking kit for $99 usd/ $132 cad .
Custom 12-inch ultra-long-throw driver in sealed enclosure with 1,000 watts continuous of built-in high-current amplification
Extensive manual or automatic DSP control of EQ, delay, volume and other functions via the PS Audio Foundry app
Full complement of rear-panel connections to accommodate any system
Optional WiSA transmitter available for ultimate-quality wireless connectivity
Optional stacking kit allows multiple subwoofers to be connected together
Maximum output: 113 dB @2 meters
Frequency response: -6 dB @ 20 Hz anechoic (ground plane), flat to below 20 Hz in-room with room gain; ±0.5 dB to 500 Hz
Available in satin black and satin white finishes
Compact size for easy placement in any room
Dimensions (H x W x D): 14.75″ W x 16.75″ H x 17.5″ D (18.125″ with grille)
Net weight: 77 lbs.
About PS Audio Celebrating 50 years of bringing music to life, PS Audio has earned a worldwide reputation for excellence in manufacturing innovative, high-value, leading-edge audio products. Located in Boulder, Colorado at the foothills of the Rocky Mountains, PS Audio’s staff of talented designers, engineers, production and support people build each product to deliver extraordinary performance and musical satisfaction. The company’s wide range of award-winning products includes audio components, loudspeakers, power regenerators and power conditioners.
A growing paradox is reshaping the 2026 workforce: strong performers are still losing their jobs. According to a January 2026 HR Dive survey, nearly 50 percent of companies expect layoffs in Q1, even as most plan to hire selectively for growth roles, exposing a market where competence alone no longer protects careers. Strategic growth advisor and ‘The CodeBreaker Mindset‘ author Chitra Nawbatt warns this moment marks the rise of a “competence trap,” where professionals optimize output while organizations quietly reprice value around speed, adaptability, and influence. The result is a workforce operating by outdated rules in a system that has already moved on. Below are more of her insights.
How to Stay Relevant in 2026
Across industries, a growing number of professionals share the same uneasy feeling: despite strong performance and proven competence, job security feels increasingly fragile. That anxiety is not imagined. The rules of work are shifting in plain sight, and the changes are cutting through roles that once felt insulated from disruption.
Layoffs
Layoffs are no longer limited to underperformers or redundant teams. They are appearing in the middle of organizational charts, within core functions, and among employees who were recently labeled essential. According to strategic growth advisor Chitra Nawbatt, author of “The CodeBreaker Mindset: The Unwritten Rules for Success,” this signals a deeper structural change in how companies define value.
“Competence used to buy you time,” Nawbatt explains. “In 2026, competence is table stakes. The market is rewarding a different set of behaviors, and many professionals are still playing by the old rules.”
This shift is often mischaracterized as a simple story about machines replacing people. In reality, the more immediate force is organizational redesign. Companies are flattening decision layers, reducing bureaucracy, and repricing labor around speed and adaptability.
Reuters already reported that Amazon was preparing additional corporate job cuts as part of an effort to streamline its structure and remove management layers, even as it continues to invest selectively in priority roles tied to long term strategy.
“The narrative is convenient,” says Nawbatt. “Blaming technology masks the harder truth. Many organizations are still figuring out how to operate efficiently in a volatile environment, and people get caught in that recalibration.”
Data shows a contradiction
Data from HR leaders underscores the contradiction. A January 2026 survey cited by HR Dive found that nearly half of companies expect layoffs will likely occur in the first quarter, while most also plan to hire selectively for roles tied to growth initiatives.
This dual track of hiring and cutting reveals why performance reviews alone no longer predict job security. The system itself is changing faster than individual output can keep up.
Rise of the CodeBreaker
Nawbatt describes the professionals who thrive in this environment as CodeBreakers. The term does not refer to rule breakers for their own sake, but to people who understand that success is governed by both written rules and unwritten ones.
“Written rules tell you how things are supposed to work,” she says. “Unwritten rules tell you how decisions actually get made when pressure hits. In periods of reorganization, the unwritten rules are what determine who stays and who goes.”
Based on her work advising leaders and teams across multiple industries, Nawbatt outlines five shifts that separate those who remain relevant from those who become interchangeable.
1. Stop optimizing and start reading patterns
Efficiency can feel reassuring in unstable times, but it can also be misleading. Nawbatt emphasizes that productivity without direction often leads professionals deeper into roles that are quietly being deprioritized.
“The winners are not the busiest people,” she notes. “They are the ones who can see where budgets are tightening, where automation is accelerating, and where their work is becoming easier to replace.”
2. Treat unwritten rules as the real operating system
Most professionals are trained to follow job descriptions and formal processes. During restructurings, however, informal dynamics take over. Who is protected, which narratives leadership repeats, and how risk is managed become far more important than stated policies.
“When written and unwritten rules diverge,” Nawbatt says, “the people who notice early have options. Everyone else is reacting.”
3. Build a nonlinear value stack
The traditional career ladder assumed stability and long time horizons. In today’s environment, resilience comes from a portfolio of relevance that spans skills, relationships, and credibility across contexts.
“You are not competing for a seat anymore,” Nawbatt explains. “You are trying to become a node in an ecosystem. The goal is to create value that travels with you when structures change.”
4. Focus on information quality, not quantity
Modern organizations are saturated with dashboards, metrics, and opinions. According to Nawbatt, the ability to distinguish data driven insight from perception driven or manipulation driven narratives is becoming a defining leadership skill.
“Clarity is power,” she says. “The person who can say what is true, what is assumed, and what is being spun becomes indispensable when decisions must be made under uncertainty.”
5. Replace ladders with loops
Career progress in 2026 is less linear and more iterative. Learning, testing, building proof, and compounding impact now matter more than waiting for titles or recognition.
“High performers often get stuck waiting to be noticed,” Nawbatt observes. “CodeBreakers build evidence. They create work that can be demonstrated, taught, and scaled.”
A Market That No Longer Rewards Comfort
If this moment feels uncomfortable, that discomfort may be the point. The market has stopped rewarding stability for its own sake. The professionals most likely to thrive are those who confront change early and adjust with intention.
AI will continue to improve. Organizations will continue to thin. The defining question is not whether people can outwork machines, but whether they can outgrow outdated playbooks.
As Nawbatt puts it, “The CodeBreaker mindset is not about fear. It is about clarity. It is about understanding how systems really work and moving with discernment when those systems shift.”
Here is a recent Substack post from U.S. Secretary of State Marco Rubio on the next era of nuclear arms control.
The Cold War
During the Cold War, few negotiations proved as complex as those between the United States and the Soviet Union to limit and reduce their vast nuclear arsenals. They required trust between adversaries who had little reason to believe each other’s words, and they relied on intricate, constant systems to verify compliance. American statesmen persevered and reached a series of agreements first with the Soviet Union and then the Russian Federation that left the United States safer.
Everything has its season though and yesterday, New START expired.
Arms control advocates and many voices in the media have tried to cast the expiration as a sign that the United States is initiating a new nuclear arms race. These concerns ignore that Russia ceased implementing the New START treaty in 2023, after flouting its terms for years. A treaty requires at least two parties, and the choice before the United States was to bind itself unilaterally or to recognize that a new era requires a new approach. Not the same old START, but something new. A treaty that reflects that the United States could soon face not one, but two, nuclear peers in Russia and China.
China Arsenal
China’s rapid and opaque expansion of its nuclear arsenal since New START entered into force has rendered past models of arms control, based upon bilateral agreements between the United States and Russia, obsolete. Since 2020, China has increased its nuclear weapons stockpile from the low 200s to more than 600 and is on pace to have more than 1,000 warheads by 2030. An arms control arrangement that does not account for China’s build-up, which Russia is supporting, will undoubtedly leave the United States and our allies less safe.
President Trump has been clear, consistent, and unequivocal that future arms control must address not one, but both nuclear peer arsenals.
Our call for multilateral nuclear arms control and strategic stability talks, presented today in Geneva, reflects the principles President Trump has laid out.
No Longer A Bilateral Issue
First, arms control can no longer be a bilateral issue between the United States and Russia. As the President has made clear, other countries have a responsibility to help ensure strategic stability, none more so than China. Second, we will not accept terms that harm the United States or ignore noncompliance in the pursuit of a future agreement. We have made our standards clear, and we will not compromise them to achieve arms control for arms control’s sake. Third, we will always negotiate from a position of strength. Russia and China should not expect the United States to stand still while they shirk their obligations and expand their nuclear forces. We will maintain a robust, credible, and modernized nuclear deterrent. But we will do so while pursuing all avenues to fulfill the President’s genuine desire for a world with fewer of these awful weapons.
We understand that this process can take time. Past agreements, including New START, took years to negotiate and were built upon decades of precedent. They were also between two powers, not three or more. However, just because something is hard does not mean we should not pursue it or settle for less. No one understands that difficult deals are often the only ones worth having more than President Trump, who has repeatedly underscored the awesome power of nuclear weapons and his desire to reduce global nuclear threats. Today in Geneva, we are taking the first steps into a future where the global nuclear threat is reduced in reality, not merely on paper. We hope others will join us.
Marco Rubio was sworn in as the 72nd Secretary of State on January 21, 2025. The Secretary is creating a Department of State that puts America First.
Over 80% of the deep ocean remains unexplored. And you can see why. With sub zero temperatures, freaky alien-looking creatures, pressures that can crush steel, and the abyss, it’s not the most welcoming.
For divers operating in the coldest, darkest and most hostile environments on Earth – where the water temperature drops below 10°C– the survival system of anyone who values their life is the drysuit.
An impermeable shell that creates a seal of warm air around the body, wearing a drysuit is a bit like wearing an actual seal.
British Special Forces, S Squadron SBS (Special Boat Service) on patrol during an exercise – “By strength and guile”
And at the heart of this underwater system you won’t find foam, rubber, or blubber. But fleece. Insanely thick, astonishingly warm, flexible, fleece.
Naturally you’ll find the most badass drysuit fleece on the planet belongs to the British Special Forces – guys who don’t mind a bit of a splash about in some cold water. So we took their fleece – after asking them nicely – and turned it into the Deep Sea Diver Hoodie and the Deep Sea Diver Vest.
Model is 6ft 2 / 189cm with a 40 inch / 101cm chest, and wears size Large.
Denser than dense
At 539 grams / 1.2 pounds ! per square metre, this is the densest fleece we’ve ever used. And that means the Deep Sea Diver Hoodie traps more heat than any other hoodie we’ve made. It breathes, wicks, and is fast-drying and odour-resistant. We added egg-shaped pockets for warmth, and a double-lined snorkel hood creates a protective microclimate around your head, sealing in warmth and blocking out the elements.
While traditional heavy fleeces sacrifice mobility for warmth, ours is engineered for both.
Its four-way elasticity means it bends, stretches and rebounds in any direction. It moves like a baselayer but insulates like a winter shell. You can climb in it, sleep in it, or disappear into a snowstorm in it.
Technical Details
Previous slide
Fabric: Polartec® Power Stretch™ (91% polyester, 9% elastane)
Material weighs: 539 g/m²
Vest weighs 700g
Four-way stretch
Two-way centre-front zip with faux-suede garage and grosgrain guard
Exposed zip hand pockets with internal facing
Elasticated binding at hem and armholes
Flatlock and cover-stitched seams
Machine wash 30°C
Constructed in Portugal
For the Silo, Nick and Steve Tidball- founders Vollebak.
The path of pursuing a career in the arts for the last fifteen years has taught me that the journey is both as simple and as complex as you can imagine. Early on, I spent so much time wrestling with what to do, what to paint, later on what to post online, and who to reach out to. I was constantly hoping for some miraculous event that would finally put me on the path to my dream life.
I used to think that when someone finally noticed me, I would do the work. I thought that once the work sold, I’d paint bigger, or once I got the grant, I’d finally start that new body of work. But the reality is always the other way around.
The Science of Starting with Joy
We often think that success leads to happiness, but psychological research suggests the opposite is true. According to the “Broaden-and-Build” theory developed by Dr. Barbara Fredrickson, positive emotions like interest and love do more than just make us feel good in the moment. They actually broaden our sense of possibility and our ability to process information.
When you start from a place of doing what you love, your brain is chemically primed to see opportunities that a stressed or “discipline-only” mind would miss. This isn’t just fluffy advice. It is about how our biology responds to interest. Love and curiosity trigger the release of dopamine, which enhances creative problem-solving and cognitive flexibility. By starting with the thing you love, you are literally building the mental resources needed to sustain a career.
Moving Beyond the “When/Then” Trap
The real secret is that the vision must always come before the validation. We often wait for a sign to start, but devotion is required long before the proof arrives. It is not about a hardcore, drill-sergeant lifestyle of waking up at 4:00 AM. It is about really loving what you do and wanting to spend more time doing it. As a byproduct of that time, you get better. You articulate your vision more clearly, and people eventually respond to that.
Just this morning, I received a payment for paintings sold last month. While that feels normal to me now, it was once a burning hope for a younger version of myself who just wanted someone to want the things I loved creating. I’ve realized that I am only responsible for nurturing my own vision and falling in love with the process. People can sense when things are forced or formulaic, but they truly feel passion and love. When you resonate with your own work, the world eventually starts to resonate with it too.
Making the Day a Work of Art
Moving forward, my focus isn’t just on scaling a business or “growing my art career,” but on a deeper question: How can I make my day a work of art?When the path is enjoyable, you don’t have to force yourself to show up. It is kind of like how no one has to force you to get ice cream in the summer. You want that sweet, creamy, delicious dessert. If you are struggling with a creative or even business block, ask yourself if you are making the work for you or if you are following external pressure.
When you make something you are proud of, you naturally want to share it with the world. The social media and the newsletters happen on their own because they are just a byproduct of that excitement.
CATALINA ISLAND, Calif. (Feb. , 2026) — In Defense of Animals is expressing profound outrage and sorrow following the California Department of Fish and Wildlife’s (CDFW) decision to approve the Catalina Island Conservancy’s deadly, controversial, and unpopular plan to eradicate the island’s entire mule deer population. Despite widespread public opposition and a previous victory that forced the abandonment of a helicopter-gunning scheme, state officials have now greenlit a ground-based massacre that will pay professional sharpshooters to hunt down and kill every one of the island’s deer.
Opposition being ignored
This decision ignores the pleas of thousands of residents and the objections of Los Angeles County Supervisor Janice Hahn, who previously led the Los Angeles County Board of Supervisors to oppose the Conservancy’s killing plan. It also disregards the expert caution of L.A. County Fire Chief Anthony Marrone, who has stated that removing the deer could actually increase fire risks by allowing vegetation fuel loads to grow unchecked — directly contradicting the Conservancy’s primary justification for the slaughter.
“Today is a dark day for California’s wildlife and a betrayal of the public trust,” said Lisa Levinson, Campaigns Director for In Defense of Animals. “The Conservancy has rebranded a massacre as ‘restoration,’ swapping helicopters for ground squads to make the bloodshed more palatable to the public. But the result is the same: the senseless violent death of a beloved herd that has lived peacefully on the island for a century. We are heartbroken that the state has chosen bullets over biology and compassion.”
Mule Deer Generations On Island
Mule deer have been living on Catalina Island for over one hundred years and have integrated into the ecosystem. Despite this, the approved plan allows the Conservancy to hire private contractors to systematically kill the deer over several years, beginning with a fenced “pilot zone” of 10 acres near the Airport in the Sky before expanding to a 105-acre zone and eventually the entire island. While the Conservancy claims, without scientific proof, that the deer threaten native plants and increase fire danger, In Defense of Animals argues these claims are ideologically driven rather than actually proven.
Jack Gescheidt, Wildlife Consultant for In Defense of Animals, condemned the approval as a symptom of a larger industry problem.
“This plan is a sad product of the restoration industry, which often expends huge sums of public dollars to exterminate entire species under the tragically ironic guise of ‘conservation,’” said Gescheidt. “The mule deer integrated into Catalina Island’s ecosystem decades ago. Scapegoating them for climate change and drought-driven vegetation loss is scientifically dishonest. It is madness to authorize and finance wildly expensive and bloody animal extermination campaigns that do nothing to solve the larger ecological problem that is being ignored — the climate crisis. Just leave the deer alone.”
Deer Being Blamed
In Defense of Animals notes that the deer are being blamed for ecological changes driven primarily by human development and climate change. The Conservancy aims to protect “native” vegetation; yet the deer have lived peacefully on Catalina Island for nearly 100 years without suddenly threatening the entire ecosystem. No third-party scientific studies have validated the group’s “invasive” claims.
Furthermore, the Conservancy has made wild, inaccurate estimates of the mule deer population to justify the slaughter. Their estimate of 1,700-2,000 deer was based on a 2021 spotlight survey that extrapolated data from a small subset to the entire island. Islanders, who live nearest the deer, estimate the population is actually between 400 and 800.
“These exaggerations are typical of the ‘exterminate-to-restore’ mentality that falls back on controlling, managing and almost always killing wild plants and animals,” added Gescheidt.
In Defense of Animals has long championed the rights of wildlife on Catalina Island. Photo: In Defense of Animals
In Defense of Animals has been defending the Catalina Island wildlife for years. It is part of the island’s citizen group, The Coalition to Save Catalina Island Deer with the joint aim of protecting the island’s wild mule deer from any killing or interference, including hunting or sterilization. Over 13,600 In Defense of Animals supporters wrote to the California Department of Fish and Wildlife, Governor Gavin Newsom, and other officials asking them to oppose this brutal plan.
In Defense of Animals is now calling on its supporters to voice their continued opposition to the Conservancy and state officials.
Levinson called for further action, saying, “We urge the public to keep contacting state officials to tell them this lethal, sham ‘restoration’ sets a deadly precedent for wildlife management across the state.”
There are an insane variety of camouflage patterns. From subtle and understated but effective (solid polar white for snowy battlefields) to ostentatious and loud but surprisingly battle proven (the Belgian jigsaw pattern anyone?).
Main camo patterns of the world.
A Few Interesting Examples. Be Sure To Click On The B/W Images To View In Color.
You get the idea. But what is the best camouflage pattern?
That is an objective question and no doubt everyone has a personal favorite. Our friends at the kommandostore.com make a pretty solid case for the Rhodesian brushstroke pattern. Let’s take a closer look at the history of the Rhodesian Army and the buildup towards the Bush War where said pattern was dutifully employed.
Rhodesia Leading Up To The Bush War: An Overview
What we now know as Zimbabwe was Southern Rhodesia was one of three states merged in 1953 to form the British-administered Federation of Rhodesia and Nyasaland (also known as the Central African Federation). This union was largely a marriage of convenience, as the British protectorates of Northern Rhodesia and Nyasaland were significantly less developed than self-governing Southern Rhodesia.
However, the Federation balkanized and dissolved in 1963 amid ethnic tensions, political instability, and deep cultural divides. Simultaneously, changing political winds in London favored a policy of rapid decolonization and majority rule. The collapse of the Central African Federation was viewed as proof positive that failing to quickly implement majority rule would result in the collapse of European-lead African governments.
An early type brushstroke pattern.
The reality was more complex.
Western-style democratic republics require a certain level of social infrastructure in order to function as intended. While the white population of the Central African Federation carried western traditions with them from Europe, the myriads of African ethnic groups had long traditions of tribal organization along ethnic lines, with their own rivalries and blood feuds.
To address this, Southern Rhodesia had created the best educational system in Africa, spending enormous sums on literacy programs, primary and secondary schools, vocational education, technical colleges, and universities. On a GDP adjusted basis, Southern Rhodesia’s expenditures on education were not just the best in Africa, they were world leading. By 1959 this approach yielded incredible results with roughly 85% native children enrolled in school, a trend that would only accelerate through the 60s. Similar initiatives had developed road and rail networks, the best healthcare system in Africa, modern water purification, and cheap, plentiful electricity.
The British governed protectorates of Northern Rhodesia and Nyasaland enjoyed little of this economic or social development. In these areas western ideas held no hope for the future and only served to destabilize traditional power structures. These communities, dominated by subsistence farming and rural poverty, contrasted sharply with the economic miracle happening just across the border.
Fresh from the bloody partition of India, English politicians failed to appreciate the likelihood of a similarly violent outcome in the push for immediate majority rule in their African colonies.
Amid intense pressure to solve Britain’s problems at home, the UK’s rush to divest its colonies created a power vacuum that China and the USSR were more than happy to exploit by funding, training, and arming the Marxist-nationalist ZANU and ZAPU groups in Northern Rhodesia and Nyasaland.
Southern Rhodesia unilaterally declared independence (known as “UDI”), from Britain, forming the state of Rhodesia in 1965. And almost in unison, the Bush War began.
Formed around a small cadre of 10,000 highly experienced WWII combat soldiers and airmen, the Rhodesian military benefited from extensive counter-insurgency experience serving alongside British forces in the Malayan Emergency of the 1950s. Due to the stability, security, and prosperity in Rhodesia, the military had no problem recruiting a racially-integrated and majority native fighting force. The 60s and 70s would also see an influx of adventure seeking British and American expats, including many Vietnam veterans…
Cool Camouflage. Where Can I Get Some?
I thought you’d never ask. Made in South Africa, this legendary camo has been brought back to life by kommandostore and it is epic.
A Blank Canvas
Rhodesian camouflage, often referred to as “Rhodesian Brushstroke” or simply “Rhodie camo” is a distinct and highly effective pattern created during the height of the Cold War. Its development was driven by the unique circumstances of the Rhodesian Bush War (1964-1979), a conflict characterized by high tempo counterinsurgency operations and great power proxy warfare.
Prior to the widespread adoption of Rhodesian Brushstroke, the Rhodesian military primarily used camouflage patterns from allied British and Belgian forces. Specifically, the British WWII Denison, Belgian Moon and Ball, and Belgian Brushstroke patterns. Looking at these camouflages it’s easy to see how they influenced the development of Rhodesia’s indigenous camouflage.
Cut Off
Sanctions after ‘UDI’ aimed to isolate Rhodesia economically and politically, but paradoxically spurred swift industrial and economic development in Rhodesia, including production lines for vital military equipment. Without these sanctions, Rhodesian manufacturer David Whitehead Textiles Ltd, would not have been contracted to develop and manufacture a uniform for the nascent Rhodesian military.
2nd Time’s the Charm
The print itself was Designed by Dianana ‘Di’ Cameron, an young print designer at David Whitehead in Salisbury. Di hand painted different patterns and presented her canvases directly to senior military officials. This rapid iteration allowed Rhodesian camo to be put into production quickly, and changes continued to be made over several years.
Di’s ultimate ‘2nd pattern’ design was distinctly organic, with large, high-contrast of light and dark. Together these elements create a layered three-dimensional effect which was more effective than previous British and Belgian designs. Sadly, Di passed away in South Africa due to a stroke around 1995.
Pictured: Our remix of 2nd pattern brushstroke with a few minor differences.
Design Details
The fabric used in original Rhodesian uniforms was a 100% cotton twill available in two weights: a heavy denim-like fabric for use in hats, smocks, and some pants, and a lighter twill for shirts, trousers, shorts, and the like.
Throughout the Bush war, a half dozen local producers manufactured ‘official’ uniforms in these two David Whitehead fabrics. However, due to the ad-hoc nature of military procurement in Rhodesia, a handful of smaller companies and cottage producers also made their own copies and derivatives in various forms. The quality of these original uniforms varied widely; for example, early ‘1st pattern’ Rhodesian camo was infamous for totally washing out in the sun, and throughout the war fabric quality varied significantly.
Rhodesian uniforms were constructed in a variety of styles with different finishing, and trims. However most garments shared the same generous cut which prioritized range of motion, user comfort, and airflow in the hot African climate. Although some ‘arid’ versions of the Rhodesian uniforms were prototyped and trialed, the vast majority of Rhodesian forces simply used fresh uniforms with vibrant colors in the rainy season, and switched to their ‘salty’ sun-faded uniforms during the dry season.
A Stroke Of Genius?
Over the course of the Bush war, Rhodesian Security Forces became known for their military prowess. So much so that their distinctive camouflage acquired a certain prestige in Southern Africa. This association was so strong that the pattern was retained by Robert Mugabe after his successful conquest of the country. While attempts to field other camouflages were made, a variant of Rhodesian Brushstroke remains the current standard uniform to this day, presumably to lend credibility to the Zimbabwe Defense Forces.
Outside of Rhodesia, elite South African units adopted the print for clandestine cross border raids during Border War years. Due to its popularity, commercial manufacture of the print continued in South Africa after the fall of Rhodesia.
Among the most famous post-war manufacturers was Adder (aka. Adro), a company founded by Johan Niemoller in 1981 after he finished service as a SADF Recce. Known for his legendary contributions to innovative SADF webbing systems, Niemoller became an established military outfitter in the 1980s, supplying both the SADF and ‘other interested parties’ like Executive Outcomes. Niemoller’s businesses also enjoyed substantial commercial sales, with Adder Brushstroke appearing in stores and on the pages of Soldier of Fortune in the late 80s and early 90s.
All-Over-The-Globe
Outside of Africa, Rhodesian Brushstroke also made a notable appearance in the year 2000 during the USMC camouflage trials (which would culminate in the development of the MARPAT family of patterns.) Brushstroke was deemed one of the world’s most effective patterns and was evaluated alongside CADPAT and a modified US Tiger Stripe print.
In the US, Brushstroke can also be credited with inspiring the ‘All-Over Brush’ pattern featured in the US Army’s universal camouflage trials which took place between 2002 and 2004.
North Equipment
The dawn of the ANC government in 1994 shuttered most of South Africa’s defense industrial base, including Niemoller’s textile businesses. At this time all of Niemoller’s manufacturing equipment was moved to his property for storage.
Years later Niemoller’s neighbor, a former SADF Parabat with a keen interest in sewing, approached him with a proposal to restart textile manufacturing work in South Africa for the commercial and private security industry. In short order, all of Niemoller’s equipment was moved just across the road.
Our History With Brushstroke
‘Brushstroke’ camo has been in high demand with survivalists, outdoorsmen, and even militaries worldwide since it’s inception — we even had some of our own made in the early days of our business.
Nowadays, an average Google search brings up a minefield of low-quality, Chinese, drop-shipped casualwear — a minefield for anyone who hasn’t properly done their homework.
On the contrast, we can appreciate the passion that goes into actual high-quality reproduction equipment on the market, but it’s certainly scarce.
Our main aim was to do something a little different than everyone else. When it was finally our turn to try our hand at making ‘Brushstroke’, we wanted to make it in Africa, just like it was in its heyday.
Giving It Our Best Shot.
With the aid of local contacts in South Africa, we stumbled across this local business in 2021 while sourcing manufacturers for South African webbing and clothing.
It would take several years, but this working relationship would eventually evolve into the North Equipment brand and our exclusive, locally made 2nd-pattern-inspired Rhodesian Brushstroke using much of the same equipment and staff used by Adder in the 1980s.
Cold, wintry and stormy weather in February can feel overwhelming. Its drab and grey and icy and it seems like warm days are a vast memory of the past. But there is light at the end of the tunnel.
Imagine a quiet February day in a snowy State or Province.
The sky is a seamless blanket of dull grey, stretching endlessly and merging with the horizon. The sun is a mere suggestion behind thick clouds, offering no warmth or light to the landscape below. Bare trees stand like silent sentinels along the empty streets, their branches reaching out like skeletal fingers against the monochrome backdrop. Patches of old snow cling stubbornly to the frozen ground, now more slush than powder, dulled by the passage of time and footsteps.
The air is crisp and biting, carrying a faint hint of dampness that seeps into your bones. The world feels paused—no birds chirping, no leaves rustling—just the distant hum of a car braving the cold. Sidewalks are lined with puddles reflecting the somber sky, and the occasional streetlamp flickers as if struggling against the gloom. It’s that in-between time where winter refuses to release its grip, yet spring feels like a distant hope.
On days like this, it’s easy to feel a sense of ennui, a kind of restless boredom that settles in like the overcast sky. But sometimes, in the midst of all the grey, you might catch a glimpse of something quietly beautiful—a warm light glowing from a window, the intricate patterns of frost on a windowpane, or the simple joy of a hot drink warming your hands.
A Turn?
These drab February days have a way of making us turn inward, reflecting on the past and dreaming of the future. Have you found any small comforts or surprises that brighten up these grey days?
Read
It may be obvious, but ask yourself this: when was the last time you actually sat down and read something good? We’re not talking about an old hard copy magazine or newspaper (remember those?) or scrolling through your social media accounts – we’re referring to an actual book with a great story that allows you to escape to another world. The merits of reading a book are known universally, yet so many of us have neglected these merits – so why not start now? If you’re thinking of what you can read, try searching online for recommended book lists; we’d start with a list of classic novels which people have enjoyed for years, even centuries.
Start a journal
Starting a journal is related to reading, in a way, but if you’ve never had a diary or your last one was way back in high school, now’s the perfect time to start (or re-start). The mere act of writing in a diary or journal is relaxing and reduces stress, and it’s a brilliant way to get a better perspective on an issue or problem. In addition, by writing in a journal, you can effectively release your concerns, ideas, feelings, and emotions so they don’t have to stay repressed inside you.
Play an easy game or two
It may also be the ideal time to unleash your love for gaming – and if you’ve spent many hours playing games as a child, then you know exactly what we mean. For example, you can play a board game with your loved ones, or if you are flying solo, you can play a nice and easy online game like those casino games that are so popular nowadays (you may even win a prize or two!). Look for the best online casino in Canada, and you can’t go wrong if you choose a popular and trustworthy site. Moreover, playing a game helps you de-stress since you’re concentrating on another thing that’s entirely different from your work or home concerns, and it can definitely put you in an excellent mood if you win.
Listen to your favorite tunes
If you’re finding it increasingly difficult to concentrate, you may need to rejuvenate yourself and recharge – and what better way to do it than by listening to your favorite tunes? So bring out your playlist and spend an hour or two getting lost in the music you love – and if you want something more relaxing, try looking for relaxation or meditation songs online. Listening to music can lower your heart and pulse rate and reduce your stress hormone levels. For the Silo, Diane Hutton.
Moltbook, an AI-exclusive social media platform launched just days ago and dubbed the “Reddit for AI agents,” has exploded in popularity online. Within its first week, Moltbook attracted over 1.5 million registered AI agents and more than a million human spectators watching the agents interact with each other, sparking countless posts across human social networks.
The project originated with OpenClaw, an open-source AI agent created by Peter Steinberger that runs locally on a user’s machine. The software allows bots to use a computer and internet services just as a human would. Building on this, entrepreneur Matt Schlicht developed his own OpenClaw agent, named Clawd Clawderberg, and tasked it with coding, moderating, and managing the entire Moltbook platform. Now most moltbots on the platform run on OpenClaw.
Vulnerability of Moltbook
Cybersecurity professionals warn that this setup is terribly insecure and creates massive security vulnerabilities. However, most agree that it’s impossible to suppress public curiosity and discourage experimentation. Instead, they are calling for caution and offering some safety tips.
Karolis Arbaciauskas, head of product at the cybersecurity company NordPass, comments:
“Moltbook and OpenClaw have attracted tech-savvy tinkerers with unprecedented opportunities for experimentation because these tools have virtually no built-in security restrictions but have broad access to users’ computers, apps, and accounts. For example, you can connect to your OpenClaw bot through a messaging app to interact with it while you’re away. It can remember your conversations, read and write files on your computer, browse the web, build applications, and even consult other bots on Moltbook for advice on how to do it best.”
Curiosity Killed The Cat
“While it’s exciting and curious to see what an AI agent can do without any security guardrails, this level of access is also extremely insecure. Therefore, please run Moltbook and your personal bots only in secure, isolated environments.
“Do not give your AI agents access to your real accounts. Instead, create disposable alternatives for them to use. Do not let them use your main browser, especially if you store passwords on it. You should also be cautious with enabling autofill because it creates the risk of the agent having permanent remote access to your credentials. If you want an agent to build something autonomously and anticipate it may need to purchase software or rent server space, link it to a disposable payment card.
“Avoid running Moltbook or OpenClaw agents on your personal or work computers. These AI agents are unpredictable and highly vulnerable to prompt injection attacks. This means if your agent processes an email, document, or webpage containing a hidden malicious instruction, it will likely execute that command in addition to its original task. For example, it could be instructed to send all the credentials, personal data, and payment card information it has access to directly to an attacker.
“The risk isn’t limited to hackers with malicious intent. AI agents could leak users’ data unintentionally. And this is just the tip of the iceberg. Cybersecurity researchers have already identified critical flaws in Moltbook, including an unsecured database that could allow unauthorized users to take control of any AI agent on the site.
Launching Bots That Con?
“It would not be surprising if threat actors, trolls, and scammers have already found their way onto Moltbook and launched bots tasked with conning other AI agents into cryptocurrency schemes or luring them into hidden prompt injections.
“That’s why it is best to buy a separate, dedicated machine and use disposable accounts for any experimentation. It is also advisable to use encryption and a private mesh network as well as to try to harden your bot against prompt injections.”
Why on earth do you collect old Simmons electronic drums?” At some point I stopped counting how often I was asked this question. But probably the following story is a part of the answer.
Years ago, in May 2015, a scientific assistant of the National Museum of Music Research in Berlin contacted me. He explained that his institute is running a musical instruments museum. They were planning a special exhibition about the history of electronic musical instruments and if I would be willing to provide a Simmons exhibit. Of course I was!
Presenting Simmons gear is always better than storing it until the end of days. But nothing happened. He did finally contact me again and we negotiated the conditions. He was interested in an SDSV and I preferred to bring it by car (600km) rather than unromantically sending it with a carrier. Although the exhibition was from March to June, the institute needed the exhibits at the end of November in order to make the catalogue in time. So just a week before that deadline, I jumped into my car with a blue SDSV with brain and cymbal pad plus my Suitcase Kit and headed for Berlin.
Incidentally at the same time there was another SDSV for sale in Berlin.
I took the opportunity to bring one kit to the museum but also to bring a new kit back home. However… I had the chance to visit the museum and I am glad that I did. It was extremely cool!
Musical instruments representing all centuries.
Musical instruments I have never heard of. Very impressive. If you happened to have been in the Berlin area between March 25th and June 25th at that time and managed to visit the special exhibition “Good Vibrations – A story about electronic musical instruments” you know exactly what I am talking about. If you missed out- there is always this video to fill the void:
Early in the morning… Don’t make appointments at noon if you have 600km to go
At least not much traffic at that time
12:30. We are about to land soon
First stop in Berlin: Appointment with the seller of a white SDSV pad set. To be honest: A friend of mine asked me NOT to buy those pads and leave them for him. I agreed. He had been waiting for years to find a pad set for his brain. A round of applause for my modesty, please…
There is still some time until I meet the guy from the museum. Time to discover some essential buildings
Finally! The hall of fame!
After we brought the gear inside I explained how to set up the kit right
Inside the box on the left there’s a Mini Moog. The exhibition will include around 70 exhibits
I am invited to visit the museum.
It is much much bigger than I thought. It shows classical instruments from the 17th century as well as contemporary gear. But the focus is on classical instruments. My favorite exhibit is a “Trautonium”, a predecessor of the synthesizer
This is the space for the special exhibition. In some special events some of the gear will be explained and played
The craziest musical instrument I have ever seen. The organ is only the controller of a hall full of instruments like percussion, snares, timpanies, chromatic percussion, organ pipes… all triggered by compressed air.
I counted more than 20 harpsichords. All vintage and all restored in the institutes own workshop
I really recommend this museum if you are interested in music.
I will come and visit again (Will any of the instruments still recognize me?) and of course I went back to pick up my SDSV once the exhibition had ended. For the Silo, Wolfgang Stoelzle. Read much, much more about Simmons drums at Wolfgang’s blog here.
Missoku is a traditional Japanese breathing practice rooted in Zen philosophy, emphasizing slow, intentional breaths to cultivate calm, focus, and inner awareness. This article explores its origins, cultural significance, and practical steps for integrating Missoku into modern life.
Akikazu Nakamurabegan his professional journey as a quantum chemist, having graduated from the Department of Applied Chemistry at Yokohama National University. However, it wasn’t long until he turned to the shakuhachi for his future career.
Akikazu studied under numerous shakuhachi masters, including Katsuya Yokohama. He then went on to study composition and jazz theory at Berklee College of Music, USA, graduating summa cum laude. He finished his tertiary studies at the New England Conservatory of Music as a scholarship student in the Master of Music Composition and the Third Stream program.
His compositions are diverse and include orchestral music, choral music, chamber music, big band music, and traditional Japanese music.
He has established a performance method that makes full use of overtones, multiphonics, the traditional Japanese breathing technique of ‘Missoku’, and his own originally developed method of circular breathing, which involves exhaling and inhaling at the same time.
The Zen Origins of Missoku
ミソク
While staying true to the traditions of the Komusō monks and collecting, analyzing, and performing their repertoire, he also performs rock, jazz and classical music using a (previously unknown to the English-speaking world) Japanese Zen breathing technique of Missoku. Realizing that others will benefit from this technique and use it to pave a path towards a peaceful and mindful life, he has shared this zen secret of Japanese culture in this comprehensive book.
Final Thoughts: Rediscovering a Cultural Treasure
The interest in all things Japan, as well as the increasing effort to center both physical and mental health as a core value of any flourishing society, leads to the nexus explored in this book, Missoku, a unique breathing method that has been handed down through Japanese Zen tradition.
Missoku is a form of breathing in which the pelvis is tilted and the abdomen is in an expanded state. It’s proven to be effective in sports, martial arts, dance, theatre, and playing musical instruments. The benefits to overall health and stamina are bountiful. One incentive includes an increase in respiration capacity, which in turn stimulates the brain, balances autonomic nerves, and improves immune defenses.
People Also Ask
Q: Is Missoku the same as meditation?
No. Missoku is a breathing technique that can be used within meditation but also stands alone as a physical and mental discipline.
Q: How often should I practice Missoku?
Beginners can start with 5–10 minutes daily, gradually increasing as comfort grows.
Q: Is Missoku used in martial arts?
Yes. Many Japanese martial traditions incorporate controlled breathing to enhance focus, timing, and calmness.
Q: Can Missoku help with stress?
Yes. Slow, intentional breathing activates the parasympathetic nervous system, reducing stress and improving emotional regulation.
Why Missoku Matters in Modern Life
Missoku is a lesser‑known Japanese breathing discipline connected to Zen Buddhism and traditional arts such as tea ceremony, martial arts, and calligraphy. It teaches practitioners to synchronize breath with movement and awareness, promoting emotional regulation, clarity, and a grounded sense of presence. The article explains the cultural roots of Missoku, how it differs from Western breathwork, and why it remains an overlooked but powerful tool for stress reduction and mindfulness.
There’s an old joke, later made into an internet meme, that goes something like this: “Have you seen my dog? He has brown fur, he’s missing his right ear, blind in one eye and has three legs. He answers to the name of ‘Lucky’.” An underdog if ever there was one. And it’s in that spirit that I share the next installment of a sadly, almost endless list of cars with not-so-good reputations. They’re cars that for reasons neither I, my parents, my children, my wife, my close friends, nor even mere acquaintances can explain—I still want.
1980–82 Ferrari Mondial 8
Ferrari
What it is: The Mondial was the replacement for the Bertone-designed Ferrari (Dino) 308 GT4, a rather underrated, wedge-shaped mid-engine 2+2. The Mondial incorporated some of the design language of the Berlinetta Boxer and the Testarossa along with a pair of semi-usable rear seats. A cabriolet was added later.
What makes it bad: Road & Track asked if this was Ferrari’s Oldsmobile. Ouch. The two-valve, fuel-injected 3.0-liter V-8 was a bit of a dog. With a little over 210-horsepower, the Mondial 8 took an excruciating 9 seconds to reach 60 miles per hour. Mondial 8s were rust-prone and had fuse boxes reminiscent of the junior electrical engineer educational toy that brother bought my kid for his birthday a few years ago. Some people also found them unattractive. I find that assessment harsh, but truth be told, its predecessor, the 308 GT4 has aged better.
Why I want one: Ten years ago, I had a 308 GTS. It was great. Reliable (once I replaced the fuse box with a modern one), and a lot of fun to drive. Was it fast? Not really, but it sounded great, smelled great, and was wonderful to look at. Sadly, today I’d have to settle for a project car for what I paid for my perfect 21,000-mile 308 back then, so a Mondial is kind of it Ferrari-wise, unless I want to launch a raid on my kids’ college funds. I think the key here is to buy a coupe (the only way the two-valve 8 came). In black, they’re actually quite attractive, and there’s nothing like the sound of the little flat-plane crank V-8 and the tactility of a real gated shifter.
1985–89 Merkur XR4Ti
Ford
What it is: Ford had one success to its name in importing and selling one of its European sporty cars—the Capri was a sort of mini-Mustang that was hugely popular until exchange rate fluctuations made it less profitable to sell here. By the early 1980s, the exchange rate again favored the U.S. dollar and then-V.P. of Ford Bob Lutz thought it might be a good idea to import an Americanized version of the Ford Sierra, under the banner of “Merkur,” which is German for “Mercury.” Get it? The 2.3-liter turbo four, also found in the Thunderbird Turbo Coupe and SVO Mustang made the XR4Ti a credible E30 BMW competitor, but like every car on this list, there were issues.
What makes it bad: Apparently European Ford quality in the ’80s wasn’t at the top of the priority list and the XR4Ti suffered from electrical problems, overheating, and turbochargers with a short life. Mercury dealers despised them, and with Ford’s then-new 48-month/50,000-mile warranty, they saw tons of them. After 1989, the Merkur signs came down and Ford was done with the XR4Ti and its larger brother the Scorpio. Immediately after warranties expired, Merkurs began the not-so-slow slog into the automotive fossil record.
Why I want one: I love the Merkur’s many quirks like the goofy biplane rear spoiler, and XR4Tis are rare even at RADwood or LeMons events, which is precisely why I want one. Honestly, you could do worse that to put together a collection of Bob Lutz-inspired cars—Everything from a BMW Bavaria, to a Viper and a Pontiac G8. An XR4Ti would fit nicely in the middle, and a perfectly nice one would barely cost five figures.
1980–81 Triumph TR8
Triumph
What it is: The Triumph TR7 was supposed to be the car that brought the British sports car out of the paleolithic era of pushrod tractor engines and separate bodies and chassis. And while the story that Harris Mann designed it on the back of a cocktail napkin (after a lot of cocktails) might be apocryphal, it’s totally plausible. The idea behind the TR8 was to make buyers forget about the four-cylinder TR7’s odd looks by offering V-8 noise and performance. The ex-Olds/Buick/Pontiac aluminum 3.5-liter V-8 by Rover just about did the trick.
What makes it bad: The same thing that made every British car of the era bad—lousy workmanship, poor quality components from suppliers that still included the infamous Lucas, and low R&D budgets. While the TR8 was predominantly produced in what was arguably one of Jaguar/Rover/Triumph’s better plants (the Rover factory in Solihull which is still cranking out Land Rovers to this day), the TR7’s reputation soiled the TR8.
Why I want one: What can I say? I’m a glutton for punishment, and I happen to love a V-8 stuffed into a small British sports car. Of the three most famous—Shelby Cobra, Sunbeam Tiger and Triumph TR8—only the latter remains affordable. Nice ones can be had in the high-teens to low-20s.
1975–76 Chevrolet Cosworth Vega
Chevrolet
What it is: The Cosworth Vega was supposed to be a high-performance version of the compact Vega that had debuted for 1971. Cosworth in the U.K. developed an alloy DOHC cylinder head for the Vega’s four-cylinder, which was mated with Bendix electronic fuel injection. It was very modern, very European.
What makes it bad: While the Vega finally had a smooth, powerful engine, it still made 110 horsepower instead of the anticipated 140. Then there was the fact that it still wore the maligned Vega badge, and while good handling and balance were always part of the package, indifferent assembly quality and rustproofing were in the Vega’s DNA as well. Oh, and it was also barely cheaper than a Corvette.
Why I want one: The magazines of the day touted Cosworth Vegas as instant collectibles, and many of the cars were stored, or intentionally kept with very low miles. The idea of owning a genuine Malaise Era time-capsule is more than intriguing. Plus, I’ve always liked the way Vegas look, a bit like miniature Camaros.
1983–89 Isuzu Impulse
Isuzu
What it is: Isuzu had a surprisingly fruitful relationship with the great Giorgetto Giugiaro of Italdesign, and it stretched back to the 1960s, when Giugiaro styled the lovely Isuzu 117 coupe. That car lasted all the way up until 1981, so because of its longevity and popularity, its successor had to be something special. The car was teased as a nearly production-ready Isuzu “Ace of Clubs” concept car. It went on sale the next year as the Piazza outside of North America, and as the Impulse in the U.S. and Canada.
What made it bad: Seemingly, the entire budget for the car went to Italdesign. Brakes, chassis and engine were bargain-basement stuff, as under its pretty Italian skin, the Piazza/Impulse was based on the General Motors T-car platform. That’s right, it wouldn’t be much of a stretch to call the Impulse a Chevette in an Italian suit. Things did get a bit better later in the car’s run with turbocharging and chassis refinements by Lotus, but few were sold and almost none survive.
Why I want one: The low survivorship factor makes these cars exceedingly rare, and it’s one of the few opportunities that anyone has to own something that looks like an ’80s concept car. It’s also an opportunity to be king for a day at RADwood, and when Impulses do turn up, they’re almost always cheap.
This report via our friends at Canadian thinktank C.D. Howe Institute, argues that front-end security screening cannot replace in-person questioning at a hearing.
Accepting Asylum Claims Without Hearings Raises Legal, Security, and Integrity Risks
January, 2026 – Since 2019, the Immigration and Refugee Board of Canada (IRB) has accepted tens of thousands of asylum claims without holding an oral hearing through a paper-based process known as “File Review.” A new report from the C.D. Howe Institute argues that this policy raises serious legal, security, and governance concerns, may exceed the IRB’s authority, and risks undermining core safeguards in Canada’s asylum system.
In “Accepting Asylum Claims Without a Hearing: A Critique of IRB’s ‘File Review’ Policy,” lawyer James Yousif examines how File Review originated as a pilot during the 2017 Yeates Review, when structural reforms, including the possible dissolution of the Refugee Protection Division (RPD), were under consideration. The policy was formally institutionalized in 2019. Introduced as an efficiency measure, the policy allows certain categories of claims – defined by nationality and claim type – to be accepted without questioning claimants or holding a hearing.
Irreplaceable: Oral Interview
The report argues that front-end security screening cannot replace in-person questioning at a hearing, which can reveal inconsistencies, misrepresentation, and inadmissibility concerns that may not be detectable through document review alone.
The report finds that File Review did not achieve its stated objective of reducing the asylum backlog. Despite substantial increases in IRB staffing, resources, and annual decision output between 2016 and 2024, the backlog expanded dramatically from roughly 17,000 claims to nearly 300,000. Over the same period, Canada’s overall asylum acceptance rate rose to approximately 80 percent, roughly double that of peer jurisdictions.
While global migration pressures, post-pandemic travel patterns, and other policy factors contributed to the surge in claims, the report cautions that maintaining a policy that permits rapid acceptance of claims without hearings may reinforce perceptions of speed, success, and reduced scrutiny – potentially increasing Canada’s attractiveness as an asylum destination.
So Called ‘Soft Law’ Was Used To Implement Policy
The report notes that File Review was implemented by the IRB unilaterally using a Chairperson’s Instruction, a form of internal “soft law” typically used for tribunal operations, not for system-wide policy change. The report also raises concerns about adjudicative independence. It argues that File Review may improperly fetter the discretion of RPD adjudicators, delegate aspects of fact-finding functions to non-adjudicative staff, and impose a mandatory internal consultation process. These features, the report suggests, may be inconsistent with established principles of administrative law.
The report concludes that the File Review policy should be brought to an end and that the default requirement of oral hearings should be restored. While this would likely reduce short-term decision volumes, the author argues that a more rigorous adjudicative process would strengthen long-term system integrity, better protect genuine refugees, and help restore public confidence.
“Efficiency gains that rely on shortcuts may prove illusory,” says Yousif. “A policy that prioritizes speed over scrutiny risks reinforcing the very pressures it is meant to relieve.”
The “Russian Code”, one of Raketa’s most emblematic models with a counterclockwise movement, is now launched in a version that dedicated to the all cities and countries where Raketa is present in the world. The first exclusive edition of 50 numbered watches is dedicated to Qatar where Raketa is represented by the prestigious retail store “Blue Salon”.
The Raketa brand (meaning “space rocket” in Russian) was created in 1961 in honour of the first manned spaceflight by the Soviet cosmonaut Yuri Gagarin. For 65 years, the Raketa Watch Factory has been accompanying space exploration by engineering watches for cosmonauts and drawing continual inspiration from the space. In 2026, the brand will mark this anniversary date with a collection of exclusive space‑themed watch models and collaborations.
The beautiful three-layered dial of the Raketa “Russian Code – Qatar Edition” displays the night sky that was over Qatar on the day it received its independence — September 3, 1971. Depending on the lighting, the blue disk structure emits bright rays of light, bringing to life the constellations printed on the dial.
Behind the elegant design lies the revolutionary concept that time should move in harmony with the natural counterclockwise movement of the planets in our Solar System. Therefore, just like the planets around the Sun, the hands of this model rotate in a counterclockwise direction around the dial. To emphasize this idea, a red circle symbolizing a planet at the tip of the second hand, moves counterclockwise above the applied blue coated numerals.
This edition limited to 50 pieces is available:
▸ In Russia: exclusively in all of Raketa’s channels of sales (online and offline stores) in very limited quantities. ▸ Outside Russia: exclusively at Raketa’s partner and the leading luxury brand store in Qatar: Blue Salon.
Moral Hazard – A situation where one party assumes greater risk because it understands that another will remedy the harmful effects.
While the hundreds of billions of dollars in U.S. foreign assistance spent over the years have dramatically improved many people’s lives and livelihoods around the world, too often the United States’ approach to foreign assistance failed to advance U.S. interests, failed to spur systematic development, and enabled and perpetuated dependence and corruption by leaders in recipient countries. Since 1991, the United States has provided more than $200 billion in foreign assistance to Africa, yet the African Union reports that African countries lose an estimated $88 billion each year through tax evasion, money laundering, and corruption. Too often, what is needed for economic growth and development is not more money, but sound reforms that incentivize enduring private investment and growth.
Instead of insisting on mutual accountability to use U.S. assistance to address the causes of poverty and underdevelopment, too often we funded outputs to allay the symptoms. In so doing, we failed both the American taxpayer and the citizens of developing countries who looked to their governments and ours to help create the conditions to realize a better future.
For decades, the United States did not have a consistent policy as to even whether assistance was charity or a foreign policy tool. We did not require a committed partner, a coherent business plan, equity collateral at risk, or funding subject to performance-based disbursements. We infantilized recipient governments instead of having candid discussions on mutual performance expectations. Too often our approach to developing countries – frequently perpetuated by the excuses of those same governments – reflected the soft bigotry of low expectations. We excused away the lack of political will as “capacity constraints,” dismissed it with “we shouldn’t expect too much,” and did not challenge them when governments acted in contrast to their professed commitments.
Too often, we were content to confuse governments’ commitments for actions. We misinterpreted our access to leaders as influence with those leaders. We mischaracterized aid projects’ outputs as outcomes and program objectives as results. We misconstrued governments’ permission for us to expend aid as evidence that they shared a commitment to advance professed objectives. Perhaps worst, we failed to acknowledge when leaders of aid recipient countries demonstrated over and over through their actions that they prioritized their personal interests over, and at the expense of, the interests of their own country and citizens. Virtually never did we withhold assistance funds because host governments failed to deliver on their commitments, instead we responded by providing even more aid “because they have needs.” By trying to save people from bearing the brunt of the bad governance and corruption of their leaders, we helped perpetuate that very same corruption and bad governance.
Quite simply, we violated the central maxim of international development: the donor cannot want development more than the recipient. By doing so, we fueled moral hazard. From the pure greed of Malawi’s “Cashgate” scandal under Joyce Banda to the systematic kleptocracies of Bangladesh or South Sudan, by back filling health and social service needs recklessly created by bad governance, we have enabled and underwritten government corruption. In the worst cases, such as the predatory abuses of Mali’s Ibrahim Keita or Guinea’s Alpha Conde against their own populations, corruption and the failure to deliver basic public services needs led to military coups and incursions by terrorist organizations.
American foreign assistance is not charity but a tool to advance American diplomacy, security, and prosperity.
To accomplish these goals, we must focus our assistance and insist on administering it with host-government buy-in and mutual accountability for outcomes. This, in turn, will leave space for market driven growth that will also help close off the means by which malign international actors exploit developing economies and workers. We should not be dissuaded by detractors who will attempt to vilify a more transactional approach as “neocolonialism.” Quite the opposite is true. By insisting on systematic reforms that spur transparent and accountable growth and allow governments to retain funds to support their people, the United States can do more to catalyze actual economic development and the upliftment of developing countries’ societies – and advance tangible U.S. interests – better than we have in recent decades. It is the dependency-oriented, NGO-driven old model of development that is fundamentally colonial in mindset – refusing to respect development nation sovereignty, determinism, or agency.
Operationalizing this approach involves adopting investment-oriented goals, requirements, and incentives:
A Serious Host Nation: Secretary Rubio has been clear, “Americans should not fund failed governments in faraway lands…we will favor those nations that have demonstrated both the ability and the willingness to help themselves.” If a government is not already taking steps to stem corruption and grow the economy when its own funds are at stake, we should have no expectation that they will be better stewards of U.S. funds. Without an aligned host-government, we should focus our resources elsewhere.
The Right Focus: Our purpose is not to give money away, but to catalyze systemic reforms that enable sustainable growth and opportunities for the U.S. and recipient country. Neither governments nor donors create growth; instead, our roles are to foster conditions for the private sector to invest, create jobs, spur growth, and pay taxes to fund public services. Hence, U.S. foreign assistance should focus on curbing corruption and overcoming and remediating binding constraints to growth to lay the foundation for a transparent, level, and accountable business enabling environment.
Confidence in The Business Plan: Most developing countries have national development plans, but too often they are unresourced and unprioritized works of fantasy, and seldom do governments enforce accountability for their actual implementation. What President Trump explained in clearly delineating America’s national interests in this year’s National Security Strategy is equally true of developing countries: when everything is supposedly a priority, nothing really can be. We should help sincere host governments develop focused, realistic strategies based on core sectors and targeting key constraints that are founded on candid analysis and include specific, tailored tactics.
Skin in the Game: If a country is not going to put its own resources behind an effort, it is either not really a priority, they are not really serious, or they don’t have confidence in their plan. Few investors would engage where the owner hasn’t put collateral down or his own equity at risk. Why should foreign assistance not require the same? Here, the Millennium Challenge Corporation (MCC) has demonstrated two key best practices that ensure buy-in. The first is a requirement for co-financing by the host government. The second is conditions precedent: tangible reform actions a host government takes before funding even begins, to enable the success of the project outcomes.
The Right Resources: Again, our purpose is not to give assistance away, and the history of both corruption and assistance has shown that money is not what is most lacking to spur development. So, building on an analysis of binding constraints to growth and a business plan that we have confidence in, it is incumbent on the United States and the recipient government to craft a bespoke package of technical assistance interventions to inform and enable the reforms needed. This should not be an approach of letting a thousand flowers bloom, and it must not be built around the question of “how can we help?” Instead, we must start with the questions “what are the outcomes we want to achieve in the American interest and what needs to happen to realize them?” and build an assistance program around that.
Have a Contract: Unlike the Development Objective Agreements (DOAGs) of USAID that bound the U.S. to fund sectors but seldom included host governments’ performance commitments, the MCC model again provides a best practice. Explicitly detailing shared objectives and commitments by both governments – typically ratified by the legislature to carry the force of law – reduces uncertainty and improves accountability by enshrining the binding obligations of both parties.
Performance-Based Funding: Too often, once development projects were approved, donors’ focus turned inward to implementation, achieving outputs, and keeping funds flowing even if receiving governments actively undermined them. Gradually, funding agencies have begun shifting to performance-based disbursements. By requiring a host government to demonstrate – through its actions, not merely its rhetoric – that it remains politically and financially committed to achieve professed objectives, we ensure that U.S. assistance achieves greater impacts.
Under President Trump and Secretary Rubio’s leadership, we have the opportunity and courage to acknowledge our mistakes, to embrace candid lessons learned, and to do better. America’s generosity in doing business with those who help themselves remains as strong as ever. We are not turning away from less developed nations, instead now is the time to lean in to lend a useful hand to those who are sincere and treat them as mature stakeholders. In engaging valued, sincere nations, nothing should be imposed, hidden, given as ultimatums, or come at the partner’s expense; we are not China. Foreign assistance that delivers for the American people and our partners must be founded on sincere, voluntary, and transparent engagement. But it must be backed by tangible action and, if a recipient nation proves through their actions that they are not committed to our professed shared objectives, our allegiance must first be to the American people to be stewards of their resources.
Having dedicated my life and career to Africa and the developing world, I am invigorated by the massive potential these nations possess, and I have witnessed how the United States can help turn that potential into a reality that benefits both nations. By restructuring our approach to foreign assistance and engaging developing countries based on national interest, we can help curb the corruption that deprives families of the hope of that better future. We can deliver lasting and systematic growth alongside recipient countries. And, we can deliver tangible value for the American people through a more secure and prosperous world.
For the Silo, U.S. Ambassador Michael C. Gonzales.
Michael C. Gonzales is the U.S. Ambassador to the Republic of Zambia and the U.S. Special Representative to the Common Market of Eastern and Southern Africa (COMESA). He has held senior posts throughout Africa and Asia over his career.
Don’t worry, we will get to the jacket- but first the story starts in 1836 in Victorian England. And it you weren’t there you didn’t miss anything. It included a grumpy-looking queen, bad weather, a lot of sexual repression, and rich people throwing buckets of human waste out of their windows.
On the plus side it also had a bunch of scientists running around like kids on acid. One of them was Michael Faraday – Victorian England’s answer to David Blaine.
Over the last 190 years the Faraday cage has gone from a crazy Victorian scientist sitting inside an electrical storm, to critical black-ops architecture, to a wildly experimental jacket that looks like it’s emerged from a craft in Dune.
A Faraday cage at the US Bureau of Standards (now NIST) used to protect delicate measuring instruments from electromagnetic fields.
Now Michael was a showman. But instead of freezing himself in ice, or suspending himself in a glass box, his trick was making super abstract physics feel tangible. And his greatest stunt of all was standing inside an electrical storm. In front of a packed out theatre at the Royal Institution in Mayfair, Faraday lined a large wooden box with metal foil, hit it with discharges from high voltage electrical machines… then calmly stepped inside. Sparks crackled across the outside of the enclosure. Blue light crawled over the metal skin. Faraday meanwhile stood there in silence. Like the final boss. While the energy simply flowed around him.
It might have looked like he’d built his own supersized coffin – complete with all the necessary equipment to kill him – but it turned out Faraday understood equations as well as he understood spectacle.
Made from approx. 50% copper
Blocks electromagnetic waves from 0.2GHz to 14GHz
Eight-pocket defensive storage system with shielding flaps
By the time he stepped into his foil-lined cube, he’d already spent years dismantling older ideas of electricity.
A Faraday cage isn’t a wall. It’s a detour. When an electromagnetic field hits a conductive enclosure, the free electrons inside it immediately start to flow, redistributing themselves across the surface until the field inside is cancelled out. Build the right shape from the right material, and electricity behaves like water flowing around a rock.
It’s one of the simplest demonstrations of how matter tells fields what they are allowed to do. The impact of Faraday’s experiment quickly escaped the lecture hall – because the Faraday cage didn’t just deflect static charge, but whole regions of the radio frequency and microwave spectrum.
The principle was applied in bunkers, test chambers and secure rooms. Then in spacecraft, data centres, radar installations and intelligence facilities, where even a stray spike of interference can crash systems or corrupt data. Today our Faraday Cage Jacket is a descendant not only of that wooden box, but everything that followed in its footsteps. It’s the same physics. Just shrunk. Softened. And wearable. And you can join the waiting list here.
We designed it from scratch, using the principles of clothing and electromagnetic infrastructure at the same time.
And this is what transforms it from a pure physics experiment, to an object that looks like it’s just emerged from a craft in Dune. Most of us spend our lives today inside a semi-permanent yet completely invisible electromagnetic fog: radio waves from antennas. Microwaves from routers. Radar from aircraft. Signals bouncing between satellites, phones, vehicles and buildings.
So the first Faraday Cage Jacket treats that electromagnetic energy the same way someone climbing Everest would treat cold weather – as something you can defend against, and insulate yourself from. It blocks electromagnetic waves across the 0.2–14GHz range. This includes all the unseen wiring of the digital age: WiFi at 2.4GHz and 5GHz. Bluetooth at around 2.4GHz. Mobile networks. As well as higher-frequency Ku-band satellite and radar systems. In lab testing the material reaches shielding effectiveness figures of up to 92 dB – for reference this is the kind of level normally associated with secure infrastructure and electromagnetic test laboratories.
Every seam and every opening affects how energy moves across the jacket.
So the job of the design is to manage those electromagnetic fields.
And that’s why the jacket is built from large, faceted spaceship-style panels and snap-down flaps. Overlapping sections create layered shielding zones and add 10 – 20 dB more attenuation. Each overlap is another place for energy to be redirected – another chance to keep it moving around the body instead of through it.
The jacket’s eight pockets are designed the same way. Instead of flat bags stitched onto a shell, they’re three-dimensional, origami-like bellows pockets that form enclosed volumes that behave less like pockets and more like small rooms – put a device inside one of these pockets and it’s almost impossible to track, hack or even call. So if you’re looking to shield yourself from the dystopian conditions our future digital overlords set – whether that’s surveillance, space radiation, or select parts of the electromagnetic spectrum – the Faraday Cage Jacket belongs in your future.
Technical Details
Outer material: Shieldex® Kiel + 30 non-woven shielding textile
Material composition: 48% copper, 46.5% polyamide, protective acrylic coating
Textile normally used to shield rooms and electronic environments
Shielding effectiveness: up to 92 dB in lab testing
Blocks electromagnetic waves from 0.2GHz to 14GHz
Thermally and electrically conductive
Naturally antimicrobial
Eight pockets including double-entry origami bellows pockets
Snap-down pocket flaps to add additional shielding
Why do we ignore the greatest threats to our pets well being, vulnerability to wildfires, floods, tornadoes, and other disasters?
Enter PHaR (Pet Help & Rescue app): the world’s first pet evacuation app.
Using a tight neighbors network, when disasters strike, activate the app, for a dedicated channel to arrange the rescue of your beloved animal companion.
Dave Crawford, Executive Director and Co-Founder of Animal Help Now, helped write the country’s first state legislative bill to double fines for traffic infractions in wildlife crossing zones; spearheaded RMAD’s nationwide boycott of Nalgene water bottles; stopped a multinational organization from building a Plexiglas zoo at Rocky Mountain National Park; and produced the country’s first video exposing conditions inside intensive egg facilities.
Crawford says, “PHaR was produced following the Marshall fire (Boulder County, CO; December 30, 2021), which took the lives of an estimated 1,000 dogs, cats and other pets.
Studies show – as did David’s personal experience in the Marshall Fire – that when disasters strike and you’re not home, your neighbors are your best bet to have your pets evacuated. PHaR is the only app of its kind. Not only in Canada and the United States, but in the entire world.”
A view of the destruction post tornado Moore, Oklahoma.
With this animal-focused tech nonprofit app, record and then, when needed, provide to your trusted contacts all the info they need to evacuate your beloved pets, including where their go-bag is, where their meds are, where they hide when scared, and how to get into your home.
For more info, visit www.AHNow.orgwww.PHaR.org @animalhelpnow @animalhelpnowapp (IG) @pethelpandrescue
More about the non profit
Animal Help Now, a nonprofit which operates its namesake wildlife emergency app, created PHaR. The 30-month effort started a week after the Marshall fire and culminated in the nationwide release on July 5, 2024.
Animal Help Now is a volunteer-based nonprofit with a budget under $200,000 USD/ $276,000 CAD. Creating PHaR was possible only because of public support and the dedication, perseverance and hard work of the organization’s mission-driven volunteers.
More about David:
David Crawford is co-founder and executive director of Animal Help Now. Dave has a Bachelor’s Degree in Computer Science and Mass Communication. He has been working on animal issues since 1989. He is co-founder and former long-time executive director of Rocky Mountain Animal Defense (RMAD). In that role, Dave led one of the most respected and effective regional animal advocacy organizations in the country; he produced the country’s first video exposing conditions inside intensive egg facilities; and he led the successful effort to stop a multinational organization from building a Plexiglas zoo at the Estes Park entrance to Rocky Mountain National Park. RMAD also convened the first national conference on prairie dogs – the 2001 Prairie Dog Summit – and was central to the founding of the Prairie Dog Coalition. For the Silo, Kat Fleischman.
Broad Arrow Lights Up the Collector Car Market An Exciting Preview Event at the Iconic Roland-Garros Stadium Roland-Garros Stadium, among the most storied venues in sport, sets the stage for a live preview of iconic collector cars to be offered in the upcoming Global Icons: Europe Online auction 27 – 30 January.
The Headliner
Headlining the event is one of Formula One’s pivotal machines: the 1992 Benetton B192 that Michael Schumacher drove to his first Grand Prix victory at Spa-Francorchamps in 1992.
Presented alongside cars going under the online hammer, a pre-war Bugatti Type 18 known as ‘Black Bess’ will appear courtesy of the Netherlands’ Luwman Museum, a car once owned by French aviation pioneer Roland Garros himself. Guests will also find activations from select global brands and a curated program of experiences throughout the venue.
1913 Bugatti Type 18 ‘Black Bess’ On Display Courtesy of “Louwman Museum”
Our friends at Broad Arrow are pleased to announce that all lots are now live and open for bidding in the Global Icons series of online auctions.
With over 80 collector cars offered across Global Icons: Europe Online and Global Icons: UK Online, plus 100 lots of authentic memorabilia in Global Icons: Memorabilia Online , there’s something for every collector. Register to view and/or bid now. Automotive lots close on 30 January, with memorabilia following on 1 February.
Meet Broad Arrow Car Specialist – Yves Boitel
Getting behind the wheel of a Jaguar D-Type is an unforgettable experience, one Yves Boitel describes as a raw, mechanical connection between driver, machine, and road. Every input passes through an engineering masterpiece designed to endure the grueling conditions of a twenty-four-hour race.
Now bringing to market cars like the Jaguar D-Type XKD 551, sold at last year’s inaugural Zürich auction, and currently representing the Benetton B192-05 in which Michael Schumacher claimed his first Formula One victory, Yves’s journey into the collector car world began earlier than most, with his first words as a toddler being car brands.
He immersed himself in the hobby from there, developing an appreciation for the individual stories behind each car and what separates the significant examples from their contemporaries.
After completing his economics degree in Zürich, Yves joined Lamborghini at Sant’Agata Bolognese, then spent nearly eight years with one of Switzerland’s most respected classic car dealers—a foundation in the industry that continues to shape his work today.
Yves’s enthusiasm surfaces most clearly when discussing sports cars from the fifties and sixties, and rally cars from the seventies, an era he has studied extensively. On a more personal level, he has a particular affinity for Lancia and BMW. Two of the latter see regular exercise under his ownership, though his interests reach well beyond those marques to any car that introduced meaningful technology for its era or carries compelling provenance, especially when accompanied by thorough historical documentation.
Based in Switzerland and fluent in German, English, and Italian, Yves travels regularly to meet clients and attend international automotive events. He’ll be at Rétromobile and the live preview at Roland-Garros Stadium, where he welcomes the opportunity to connect.
Turn Your Garage into a Motorsports Hall of Fame
Showcase your passion for motorsports with artifacts from Global Icons: Memorabilia Online
Collecting motorsport memorabilia offers more than decoration. It provides a tangible link to the moments that defined the sport, moments where drivers demonstrated unrelenting courage, pushing technological marvels to their limits for a chance at lasting glory.
Broad Arrow will present a curated selection of authentic motorsport memorabilia at the upcoming Global Icons: Memorabilia Online online auction, featuring race-worn artifacts from hall of fame drivers like John Surtees and Ayrton Senna, alongside pieces from drivers who will inevitably be remembered among the greats.
Select lots will be available for live preview in Paris. We invite you to register to attend the live preview event at Roland-Garros Stadium and to view the lots on display on the Broad Arrow Rétromobile stand. Bidding begins to close on 1 February starting at 19:00 (CET).
Celebrating Record Attendance at InterClassics Maastricht
When 44,323 people show up to a classic car event, you know something special is happening. The 31st edition of InterClassics Maastricht just set a new attendance record, further cementing its place among Europe’s premier classic car events.
Beyond the expected displays of iconic classics and sought-after modern performance machines, the show offered something more: “Legends of the Rising Sun,” a centennial celebration of Japanese automotive innovation. The exhibit gathered landmarks from Toyota, Nissan, Mazda, and others, including the 2000GT, Skyline GT-R R34, and 787B, into one curated space.
As a partner of InterClassics, Broad Arrow welcomed guests into our VIP lounge, offering a chance to step off the show floor, connect with our team, and absorb the event’s energy surrounded by exceptional automobiles.
Private Sales in Paris Exceptional Collector Cars Available for Immediate Acquisition Broad Arrow Private Sales is bringing an exciting lineup to Paris, with cars available for immediate acquisition, no waiting for the gavel to fall.
At Roland-Garros Stadium, alongside our curated preview for Global Icons: Europe Online, you’ll find an exceptionally original 1957 Mercedes-Benz 300 SL Gullwing Coupe, an ultra-rare 1973 Porsche 911 Carrera RS Lightweight, and a virtually untouched 2022 Lamborghini Countach LPI 800-4.
Across the city at the landmark Rétromobile event, 1,001 horsepower worth of conversation starter in the form of a recently listed 2008 Bugatti Veyron EB 16.4 Coupe will be among the collector cars on display on the Broad Arrow stand.
Happiness…..I popped the pink pill into my mouth and waited for the expected feelings of ecstasy. No, the pill wasn’t the drug XTC, but rather a legal and safe “hacking” alternative. Then I put on my trans-cranial stimulation device, known as “The Thync,” and waited to see what happened. Wow! After five minutes, it felt like my brain was flooding me with endorphins. Finally, I placed the scalp stimulator known as the Tingler on my head. When I did this, an orgasmic wave of intense pleasure rippled through my entire body.
After a few minutes of this euphoria, I took off the devices and went about my day. Having just been catapulted into sweet ecstasy, my day became both incredibly productive and happy.
This is not a future scenario.
This is how I like to start my mornings. Nowadays, there are new and improved ways to feel good-even ecstatic-that most people don’t know anything about. In an age when depression is rampant and dangerous drug use is epidemic, amazing new ways to feel peaceful, euphoric, and just plain happy are popping up all over the place. However, people miss out on these amazing methods because they simply don’t know about them. From safe drugs to “happy apps,” to high tech brain stimulation devices, a whole new world of ways to feel good is blossoming.
We live in an age where everything is shifting and accelerating. Yet, most people still pursue an ancient path for finding happiness. Their formula for being happy is to try to control all the external events and people in their lives to be exactly the way they want. This is a tiresome activity at best, and there are always some events and people that we can’t control. However, there is a new model for finding more joy and peace of mind: find it within your self. Of course, this is a not a new idea. Everyone from the Buddha to Jesus has said that heaven can be found within, but now there are cutting edge and more efficient ways to tap into this magical inner kingdom.
As invited to talk to Google employees about “The Future of Happiness.” I described new ways to control their minds and emotions that were more effective than trying to be happy by controlling all the events in their life. The reaction was intense. Everyone wanted to know what some of these innovative ways to “hack happiness” were, and how they could get them. That led me to write a book on the subject.
In my research I learned that different things work for different people.
For example, there are a lot of supplements known as “cognitive enhancers” that can dramatically increase your focus, energy, and mood. Yet, you have to try out many of them in order to find the one or two that really rock your world. I also learned that people define happiness in unique ways. Some people want a gadget that increases their pleasure, while other folks want a tool that improves their relationships or makes them feel totally peaceful.
Gary Numan “Complex” from The Pleasure Principle
As with all technologies, “inner” tech keeps getting better. In fact, some of them are so good that it’s possible to get addicted to them. Ultimately, one has to discern whether a given gadget is truly a friend that helps them find the joy within–or is just another WMD-Widget of Mass Distraction. Since there are many tools that do different things, there’s no simple answer as to whether something is beneficial to you.
For example, people become addicted and dependent on coffee. Yet, on the other hand, caffeine can prevent many types of cancer, and helps people feel good and be productive. So, is coffee a “good” thing? It’s up to you to decide…
In my own case, I decide if a specific technology is truly my friend by asking myself two questions. First I ask myself, “Does this tool lead me to being dependent on it?” It’s always better when technology acts like “training wheels” on a bike-meaning that the tool exists so that you can eventually do without it. If instead a gadget fosters a sense of dependence, then that’s a warning sign it may ultimately not be worth it.
The second question is, “Does this technology help teach me how to better connect with a sense of peace, love, or joy within?” Even the Dalai Lama has reportedly said that if there were a pill that duplicated Buddha’s awakening, he would take it immediately and prescribe it for all living beings. If a tool helps me learn how to get to a more peaceful, loving place more efficiently, I think that’s a good thing.
It’s hard to say exactly what the future holds, though Steve Jobs was seemingly pretty good at predicting it. In 1972 I had the unusual opportunity to be in a computer class with Steve Jobs. Of course, at the time he was just a nerdy teen and I was four years his junior. He and I would vie to play Tic-tac-toe on a 500 pound “computer” that our High School had recently purchased. Steve was obsessed with this machine. One day I asked Steve why he was so fixated on this refrigerator sized computer. He turned to me and said in an intense manner, “Don’t you see? This machine is going to change everything! It’s going to change the world!”
It turns out Steve Jobs was right.
Well, nowadays it may not seem like the latest brain supplement, neuro-stimulator, or mood enhancing app is going to change the world, but technology has a way of discreetly slipping into our lives. This “technology of joy” will only accelerate until the entire way we pursue happiness is transformed in the next few years. I’ve seen that when people try out enough of these new gadgets, apps, and supplements, they inevitably find something that feels good–and is even good for them. When that happens, their lives are never the same. For the Silo,Jonathan Robinson.
The Art of Clairtone: The Making of a Design Icon, 1958-1971 is a fully illustrated stylish look back at the stereo story behind a Canadian design icon. This handsome hardcover is by Nina Munk and Rachel Gotlieb and is available on Amazon.
For an entire decade, in the 1960s, Clairtone Sound Corporation captured the spirit of the times: sophisticated, cosmopolitan, liberated. From its modern oiled-walnut and teak stereos to its minimalist logos and promotional materials, Clairtone produced a powerful and enduring body of design work. Founded in 1958 by two young Canadians, Peter Munk and David Gilmour, Clairtone quickly became known for its iconic designs and masterful advertising campaigns.
Its acclaimed Project G stereo, with its space-age styling, epitomized the Swinging Sixties. Famously, Hugh Hefner owned a Project G. So did Frank Sinatra.
Oscar Peterson affirmed that his music sounded as good on a G as it did “live”. In 1967, suggesting how deeply Clairtone’s G series had come to be identified with popular culture, the G2 appeared in The Graduate with Dustin Hoffman and Anne Bancroft.
With 250 illustrations, including previously unpublished drawings, rare film stills, confidential memorandums, and original photography, The Art of Clairtone is a candid and in-depth look at the company’s skyrocketing success — and sensational collapse.
Through the recollections of those who knew Clairtone best, from its founders to its designers, engineers, and salesmen, and with comments from Karim Rashid, Douglas Coupland, Tyler Brûlé, and Bruce Mau, among others, this elegant book, published on the 50th anniversary of Clairtone’s launch, celebrates an iconoclastic company that once seemed to represent the promise of Canada. For the Silo, Jarrod Barker.
Spacewar! the first digital video game first ran as a demo in 1961 on an DEC Digital Equipment Corporation PDP-1 (Programmed Data Processor-1) computer and holds a central place in the development of video games as a cultural form.
Made In house
Spacewar! was created by a group of students and researchers (including Steve Russell) at the Massachusetts Institute of Technology (MIT) in 1961, conceived of as a demonstration for the new Digital Equipment Corporation PDP-1 computer.
The completed game premiered at the 1962 Science Open House at MIT, and was later shared and modified at computer labs around the United States. This “computer toy” influenced untold technological advances and gave rise to the cultural phenomenon now known as video games.
All the Basic Building Blocks Of Modern Videogames
Among other things, Spacewar! set the template for the game development industry and its relationship to technology, established shooting as a core game mechanic, and inspired space and science fiction themes for future games including the Atari classic Asteroids and many others. Spacewar! was even an early cartridge game ported to the Atari VCS / 2600 in 1978 and deserves extra consideration for being an important title for the collector- it was one of the first home adaptations of a computer game.
Amazon’s move into online car listings through Amazon Autos in 2024 has been widely framed as a breakthrough for consumers. But, for buyers considering this new option, the real story is more nuanced. While the platform offers a familiar, streamlined shopping experience and no-haggle pricing, it does not eliminate dealerships, negotiations behind the scenes, or the traditional profit structures that shape car pricing.
A quick heads up fellow Canucks- Amazon Autos is not yet available in Canada but plans are in place for expansion so stay tuned.
Trade Offs
As more North Americans explore buying a vehicle through alternative means including Amazon, experts say the key question isn’t whether it’s easier, but whether shoppers understand the trade-offs they’re making. Knowing the pros, the cons, and the fine print can be the difference between convenience and costly compromise.
What Works, What Doesn’t, and What to Watch For When Buying a Car on Amazon
Is It A True Breakthrough?
Amazon’s move into online car listings through Amazon Autos has been widely framed as a breakthrough for consumers. But, for buyers considering this new option, the real story is more nuanced. While the platform offers a familiar, streamlined shopping experience and no-haggle pricing, it does not eliminate dealerships, negotiations behind the scenes, or the traditional profit structures that shape car pricing. As more Americans explore buying a vehicle through Amazon, experts say the key question isn’t whether it’s easier, but whether shoppers understand the trade-offs they’re making. Knowing the pros, the cons, and the fine print can be the difference between convenience and costly compromise.
Amazon Autos, has generated headlines over the past year for a number of reasons. Some heralded the launch as a true game changer in the car market. But in reality, buying a car on Amazon is not all that different from buying a car the old fashioned way.
Participating automakers (like Hyundai) or dealers (like rental car giant Hertz) can now list their inventory on Amazon. But make no mistake: you’re still buying from a dealer. Amazon Autos is only acting as an online marketplace for cars, meaning that the cars you see listed are only there because traditional car dealers listed their inventory on the platform. Amazon is just making online car shopping feel like the Amazon experience that nearly 200 million Americans are familiar with.
There are pros and cons of buying a car on Amazon.
Amazon advertises no-haggle pricing, but there’s something crucial that most shoppers overlook: that rarely means you’re truly getting the best price possible. No-haggle pricing is crafted by dealers to ensure healthy profit margins on their end, while making consumers feel relieved that they don’t have to deal with unpleasant negotiations or salespeople. The truth is, buying the actual vehicle still takes place at a dealership. There are still salespeople involved. It can still be inconvenient or uncomfortable.
Dealers are thrilled with the assumption that pricing is already agreed upon before the customer even arrives. Remember, dealers have plenty of profit in the form of holdbacks, manufacturer-to-dealer cash, and even volume bonuses. That’s not to mention more money for them if you finance with them, or purchase an extended warranty or other add-on.
All of this means that you’re much more likely to overpay than if you were to go your own way and negotiate confidently.
In summary, when you buy a new or used car on Amazon, you’re still buying through a traditional dealership. Amazon doesn’t hold any of the inventory you see online, they’re merely adding the online Amazon experience many consumers are familiar with to online car shopping. In most cases, that means trading competitive pricing for convenience.
For some, that may be a compromise you’re willing to make in order to skip the haggling process. But it’s important to know that you’re limiting your ability to land a great deal when you forfeit your chance to negotiate car pricing.
Research Required
To best ensure you’re not leaving money on the table, thoroughly research the car market. Always research demand factors for the cars you’re interested in. Are you shopping for a car that’s less popular than the hottest sellers on the market? Does it sell slower than the market average in your area? If so, you’re much more likely to overpay with ‘no-haggle pricing’. Find inventory that has been sitting on the dealership lot the longest. Those are the cars that dealers are motivated to sell at a discount.
For the Silo, Justin Fischer.
Justin Fischer is an automotive retail analyst and consumer advocate at CarEdge, a leading consumer platform dedicated to empowering car shoppers to make confident, informed and financially savvy decisions.
Chief Economists Perceive Relative Resilience but Remain Concerned about Asset Prices, Debt and Geoeconomic Tensions
Acknowledging the relative resilience of the global economy amid turbulence, 53% of chief economists surveyed expect global economic conditions to weaken in the year ahead, down from 72% in September 2025.Uncertainty around technology remains high, with 52% expecting AI-related stocks to decline and 40% expecting gains. On growth, expectations diverge by region, with economists expecting strong momentum in South Asia and East Asia and weak to moderate growth in Europe.
On macroeconomics, nearly a third of respondents are concerned about sovereign debt crises in advanced economies and nearly half in emerging economies; over 60% expect governments to rely on higher inflation and tax revenues to manage elevated debt.Learn more about the Chief Economists’ Outlook here.
Follow the Annual Meeting 2026 here and on social media using #WEF26.
Geneva, Switzerland, January 2026 – The global economic outlook has improved modestly but remains uncertain, with asset valuations, mounting debt, geoeconomic realignment and rapid artificial intelligence deployment creating both opportunities and risks, according to the World Economic Forum’s latest Chief Economists’ Outlook, published today. Although 53% of chief economists expect global economic conditions to weaken in the year ahead, this marks a significant improvement from the 72% who held this view in September 2025.
“The Chief Economists survey reveals three defining trends for 2026: surging AI investment and its implications for the global economy; debt approaching critical thresholds with unprecedented shifts in fiscal and monetary policies; and trade realignments,” said Saadia Zahidi, Managing Director, World Economic Forum. “Governments and companies will have to navigate an uncertain near-term environment with agility while continuing to build resilience and invest in the long-term fundamentals of growth.”
AI and other asset valuations are under scrutiny Concentrated AI stock gains are splitting the views of the chief economists. A narrow majority (52%) are expecting AI-related US stocks to decline over the next year, but 40% foresee further increases. Should values fall sharply, 74% believe impacts would spread across the global economy. Cryptocurrencies face bleaker prospects, with 62% anticipating further declines following market turbulence, while 54% believe gold has peaked after recent rallies.
When it comes to the potential expected returns from AI, there is wide variation across regions and sectors. Roughly four in five chief economists expect productivity gains within two years in the US and China. Chief economists expect the information technology sector to adopt AI fastest, with nearly three-quarters anticipating imminent productivity gains. Financial services, supply chain, healthcare, engineering and retail follow as “fast-movers”, with one to two-year timelines. By firm size, the chief economists expect companies with 1,000+ employees to see gains earlier than others: 77% of chief economists expect meaningful productivity gains within two years.
The employment picture in relation to AI is expected to evolve over time: two thirds expect modest job losses over the next two years, but views diverge sharply over the longer term: 57% anticipate net losses over 10 years, while 32% foresee gains as new occupations emerge.
Debt may drive difficult trade-offs Managing elevated debt levels has become a central challenge for policy-makers, particularly as spending pressures rise. Defence spending is almost unanimously expected to increase, with 97% of chief economists anticipating rises in advanced economies and 74% in emerging markets. Digital infrastructure and energy spending are also expected to rise. Most other sectors are expected to see stable levels of spending, while a majority of surveyed economists anticipate spending on environmental protection to decline in both advanced (59%) and emerging economies (61%).
Views are split equally on the likelihood of sovereign debt crises in advanced economies, while nearly half (47%) see them as likely in the year ahead in emerging economies. A large majority of chief economists expect governments to rely on higher inflation to reduce burdens (67% in advanced economies, 61% in emerging markets). Tax increases are also viewed as likely by 62% for advanced economies and 53% for emerging markets. Some 53% of chief economists anticipate seeing debt restructuring or default as a debt management strategy in emerging markets over five years, compared to just 6% for advanced economies.
Trade flows and regional growth outlooks are realigning Global trade and investment are adjusting to a new, competitive reality. Chief economists expect import tariffs between the US and China to remain mostly stable, though competition could intensify in other domains. Some 91% expect US tech export restrictions to China to remain or increase; 84% anticipate the same for Chinese critical mineral restrictions.
In this new context, 94% of chief economists expect more bilateral trade deals and 69% anticipate growth in regional trade agreements. Some 89% expect Chinese exports into non-US markets to further increase, while surveyed economists are split on the future of global trade volumes. Meanwhile, almost half of them foresee the continued rise of international investment flows, and 57% expect FDI into the US to increase compared to 9% who expect increased inflows to China.
When it comes to growth expectation among the chief economists surveyed, South Asia leads with 66% anticipating strong or very strong performance, driven by robust growth in India. Some 45% expect strong growth and 55% moderate growth in East Asia and the Pacific. Some 36% expect strong growth and 64% moderate growth in the MENA region. The US outlook improved notably, with 69% expecting moderate growth versus 49% in September 2025, but only 11% expecting strong growth. China faces mixed prospects, with 47% expecting moderate growth and 24% strong growth and nearly an equal number – 29% – expecting weak growth. Europe confronts the weakest outlook, with 53% expecting weak growth, 44% moderate growth, and only 3% anticipating strong growth.
About the Chief Economists’ Outlook The report builds on extensive consultations and surveys with chief economists from the public and private sectors, organized by the World Economic Forum’s Centre for the New Economy and Society. The report supports the Forum’s Future of Growth Initiative, aiming to foster dialogue and actionable pathways to sustainable and inclusive economic growth. The Chief Economists’ Outlook is complemented by other recent publications with economic foresight. Four Futures for the New Economy and Four Futures for Jobs in the New Economy explore strategic implications for businesses navigating geopolitical shifts, technology disruption and workforce transformation through 2030, offering indicators to track and strategies to prepare for multiple scenarios.
About the Annual Meeting 2026 The World Economic Forum’s 56th Annual Meeting, taking place today the 19th and running until 23 January 2026 in Davos-Klosters, Switzerland, will convene leaders from business, government, international organizations, civil society and academia under the theme, A Spirit of Dialogue. Click here to learn more.
A Spirit of Dialogue Brings Record Numbers of World Leaders to Davos for World Economic Forum Annual Meeting 2026
A record 400 top political leaders, including close to 65 heads of state and government – with six G7 leaders expected – nearly 850 of the world’s top CEOs and chairs, and almost 100 leading unicorns and technology pioneers will convene in Davos-Klosters for one of the highest-level gatherings in the Annual Meeting’s history. Held under the theme of A Spirit of Dialogue, the 56th Annual Meeting will provide an impartial platform for close to 3,000 participants from over 130 countries to navigate the major economic, geopolitical and technological forces reshaping the global landscape.
A major focus will be on the unprecedented speed of innovation and technological advancement with key voices from industry and academia present.– At a pivotal moment for global cooperation, the World Economic Forum will convene its 56th Annual Meeting today in Davos-Klosters, Switzerland, bringing together close to 3,000 cross-sector leaders from over 130 countries under the theme A Spirit of Dialogue. Marking record levels of governmental participation, 400 top political leaders – including close to 65 heads of state and government and six of the G7’s leaders – are expected to take part, alongside nearly 850 of the world’s top CEOs and chairpersons, and almost 100 leading unicorns and technology pioneers.
Amid the most complex geopolitical backdrop in decades – marked by rising fragmentation and rapid technological change – the need for an impartial platform that brings together diverse and sometimes diverging voices across industries, regions, and generations is urgent. Building on the Forum’s long-standing tradition of providing a trusted space for dialogue and public-private collaboration, the Annual Meeting 2026 will enable an open exchange of ideas and perspectives on the issues that matter most to people, economies and the planet, turning shared understanding into action.
“Dialogue is not a luxury in times of uncertainty; it is an urgent necessity,” said Børge Brende, President and CEO, World Economic Forum. “At a critical juncture for international cooperation – marked by profound geoeconomic and technological transformation – this year’s Annual Meeting will be one of our most consequential. With historic levels of participation, it will provide a space for an unparalleled mix of global leaders and innovators to work through and look beyond divisions, gain insight into a fast-shifting global landscape, and advance solutions to today’s and tomorrow’s biggest and most pressing challenges.”
“As the World Economic Forum enters its next chapter, this year’s Annual Meeting is bringing together a record number of global leaders from government, business, and non-governmental organizations at a moment when dialogue matters more than ever,” said Larry Fink, Interim Co-Chair, World Economic Forum. “Understanding different perspectives is essential to driving economic progress and ensuring prosperity is more broadly shared.”
“At a moment when cooperation matters more than ever, the Annual Meeting provides a unique space to turn dialogue into meaningful progress,” said André Hoffmann, Interim Co-Chair, World Economic Forum. “By bringing together leaders across regions and sectors, it creates the conditions to rebuild trust, align priorities and advance solutions that support long-term, sustainable growth for all, within planetary boundaries.”
Switzerland is the host country for the meeting. 400 government leaders are expected to attend this year, representing the highest level of government participation in the Annual Meeting’s history, including close to 65 heads of state and government, 55 ministers for economy and finance, 33 ministers for foreign affairs, 34 ministers for trade, commerce and industry, and 11 Governors of Central Banks. High-level government representation is expected from all key regions, including six G7 leaders and heads of state from countries central to dialogue on critical global situations – from Ukraine to Gaza and the broader Middle East, and beyond.
Top political leaders taking part include:
Top political leaders taking part include: Donald Trump, President of the United States of America; Mark Carney, Prime Minister of Canada; Friedrich Merz, Federal Chancellor of Germany; Ursula von der Leyen, President of the European Commission; He Lifeng, Vice-Premier of the People’s Republic of China; Javier Milei, President of Argentina; Prabowo Subianto, President of Indonesia; Pedro Sánchez, Prime Minister of Spain; Guy Parmelin, President of the Swiss Confederation 2026; Vahagn Khachaturyan, President of the Republic of Armenia; Ilham Aliyev, President of the Republic of Azerbaijan; Bart De Wever, Prime Minister of Belgium; Gustavo Petro, President of Colombia; Félix-Antoine Tshisekedi Tshilombo, President of the Democratic Republic of the Congo; Daniel Noboa Azín, President of Ecuador; Alexander Stubb, President of Finland; Kyriakos Mitsotakis, Prime Minister of Greece; Micheál Martin, Taoiseach, Ireland; Aziz Akhannouch, Head of Government, Kingdom of Morocco; Daniel Francisco Chapo, President of Mozambique; Dick Schoof, Prime Minister of the Netherlands; Mian Muhammad Shehbaz Sharif, Prime Minister of Pakistan; Mohammed Mustafa, Prime Minister of the Palestinian National Authority; Karol Nawrocki, President of Poland; Mohammed Bin Abdulrahman Al Thani, Prime Minister and Minister of Foreign Affairs of the State of Qatar; Aleksandar Vučić, President of Serbia; Tharman Shanmugaratnam, President of Singapore; Isaac Herzog, President of the State of Israel; Ahmad Al Sharaa, President of Syria; Volodymyr Zelenskyy, President of Ukraine.
Heads of international organizations taking part include:
António Guterres, Secretary-General of the United Nations; Ngozi Okonjo-Iweala, Director-General of the World Trade Organization; Ajay S. Banga, President of the World Bank Group; Kristalina Georgieva, Managing Director of the International Monetary Fund; Mark Rutte, Secretary-General of the North Atlantic Treaty Organization; Tedros Adhanom Ghebreyesus, Director-General of the World Health Organization; Alexander De Croo, Administrator of the United Nations Development Programme; Mathias Cormann, Secretary-General of the Organisation for Economic Co-operation and Development; Doreen Bogdan-Martin, Secretary-General of the International Telecommunication Union; Barham Salih, UN High Commissioner for Refugees; Jasem Al Budaiwi, Secretary-General of the Gulf Cooperation Council.
Around 1,700 business leaders, including close 850 of the world’s top CEOs and chairpersons from the World Economic Forum’s Members and Partners, will also participate, alongside almost 100 CEOs and chairpersons of Unicorn companies and Tech Pioneers who are transforming industries and shaping the future or technology worldwide.
Some of the top voices in technology and innovation taking part include:
JensenHuang, NVIDIA; Satya Nadella, Microsoft; Dario Amodei, Anthropic; Dina Powell McCormick, Meta; Demis Hassabis, Google DeepMind; YoshuaBengio, Université de Montréal; Alex Karp, Palantir Technologies; SarahFriar, OpenAI; YuvalHarari, Centre for the Study of Existential Risk; Khaldoon Khalifa Al Mubarak, Mubadala; PeggyJohnson, Agility Robotics; Arthur Mensch, Mistral AI; BretTaylor, Sierra; PengXiao, G42; EricXing, Mohamed bin Zayed University of Artificial Intelligence.
“In an era where exponential technological innovation and geopolitical disruption are deeply intertwined, the need for constructive dialogue between policy-makers and industry is clear,” said Mirek Dušek, Managing Director, World Economic Forum. “Leaders will share views from across sectors to help build the understanding needed to balance short-term priorities and immediate challenges with long-term value creation.”
Close to 200 leaders from civil society and the social sector – including labour unions, non-governmental and faith-based organizations, as well as experts and heads of the world’s leading universities, research institutions and think tanks – will also participate in the meeting. Heads of civil society organizations participating include:
David Miliband, President and CEO, International Rescue Committee; Sania Nishtar, CEO, Gavi, The Vaccine Alliance; Luc Triangle, General Secretary, International Trade Union Confederation; Kirsten Schuijt, Secretary General, WWF International; Mohammad Al-Issa, Secretary General, Muslim World League; Comfort Ero, President and CEO, International Crisis Group; Pinchas Goldschmidt, Chief Rabbi and President, Conference of European Rabbis; Oleksandra Matviichuk, Nobel Peace Laureate and Chair, Ukraine Center for Civil Liberties; Peter Sands, Executive Director, The Global Fund; Amitabh Behar, Executive Director, Oxfam International; Aulani Wilhelm, President and Executive Director, Nia Tero.
The 2026 programme is centred around five pressing global challenges where public-private dialogue and cooperation, involving all stakeholders, are critical for collective progress:How can we cooperate in a more contested world?How can we unlock new sources of growth?How can we better invest in people?How can we deploy innovation at scale and responsibly?How can we build prosperity within planetary boundaries? “In a global economy shaped by technology, geoeconomics, and demographics, the defining challenge will be whether opportunity is broadly shared or if growth remains sluggish and uneven,” said Saadia Zahidi, Managing Director, World Economic Forum. “The meeting will connect leaders to discuss how to unlock growth, jobs and economic transformation that translate into progress for communities everywhere. “The meeting’s Arts and Culture Programme will further amplify the diversity of voices and perspectives needed to advance impact, while showcasing the power of art, influence, and culture to drive change and create unique space for dialogue. Renowned artistic and cultural leaders in attendance include:
Marina Abramović, Jon Batiste, Thijs Biersteker, Sabrina Elba, Renaud Capuçon, Hiro Iwamoto, Suleika Jaouad, Sir David Beckham, Ahmad Joudeh, Yo-Yo Ma, Emi Kusano, Harvey Mason Jr, Hans Ulrich Obrist, Katie Piper, Ronen Tanchum, JR and will.i.am.
The Open Forum, now in its 23rd year, will host public panel discussions for the local community and participants from around the world, encouraging wider participation and open dialogue on key global issues.
Brockett Parsons, keyboardist for Lady Gaga with his PianoArc.
Max Rebo and his circular keyboard. Star Wars Return of the Jedi. 1983
The exhibition will feature an interactive space for visitors to make music through body movement, as well as immersive elements, live performances, and workshops
Exhibition Dates: June 7 –Sept 27, 2026 Location: The Met Fifth Avenue, Gallery 199
(New York, January, 2026)—From clapping hands and tapping feet to beatboxing and whistling, the human body is a musical instrument. In turn, instruments often draw their form and decoration from the body. Musical Bodies, which opens on June 7 at The Metropolitan Museum of Art, will explore the multifaceted relationship between musical instruments and the human body. This is the first major exhibition to address this theme and will bring together some 130 works from around the world and across time, including musical instruments, paintings, sculptures, and drawings from The Met collection along with important international loans.
“Musical instruments, which represent an important part of the Met’s collection, have long been recognized and celebrated as dynamic tools for creative expression, and also as works of art in their own right,” said Max Hollein, The Met’s Marina Kellen French Director and CEO. “This multisensory exhibition is the first to explore—through remarkable instruments, objects, and works of art—the fascinating ways in which sound, musical objects and the human form have been in conversation for millennia. Including outstanding instruments, powerful performances and immersive in-gallery experiences, Musical Bodies is a show that will resonate, fascinate and inspire.”
Barbara Mandrell’s Mosrite Crutch Guitar
Patrons Support
The exhibition is made possible by Barbara Tober, the Diane W. and James E. Burke Fund, the William Randolph Hearst Foundation, and the Gail and Parker Gilbert Fund.
Additional support is provided by Anonymous, The Dancing Tides Foundation, and the Vanguard Council.
Encompassing 4,000 years of music history and art, Musical Bodies will feature a range of objects from across the visual arts, literature, religion, pop culture, and mythology. This includes ancient Egyptian rattles, paintings by Titian and Degas, instrument-inspired apparel, and one of Prince’s most notable guitars. The ways in which the boundaries between body and instrument have been artfully blurred will be explored through visionary works such as Nam June Paik’s TV Cello; the PianoArc circular keyboard designed in collaboration with Brockett Parsons, keyboardist for Lady Gaga; and a steel guitar in the form of a crutch that was made for country music singer and songwriter Barbara Mandrell while she was recovering from an automobile crash.
Musical Bodies will include prominent works from across 10 of The Met’s curatorial departments, including over 50 instruments from the Department of Musical Instruments as well as ancient works from Egypt, 19th-century masterpieces from European Paintings, and 20th -century works from the Department of Modern and Contemporary Art. The exhibition will also feature significant loans from collectors and institutions such as the Musée de la musique (Paris), the National Music Museum (Vermillion, South Dakota), and the Royal College of Music (London). One of the earliest surviving bowed string instruments, a rare figural lira da braccio from the Kunsthistorisches Museum (Vienna), and a lavish hurdy gurdy from the Victoria & Albert Museum (London) will be shown in the United States for the first time.
“Musical Bodies first formed in my mind as a deceptively simple question: Why are so many instruments shaped and decorated like the human body?” said Bradley Strauchen-Scherer, Curator in the Department of Musical Instruments at The Met.”The quest for an answer has become an exploration of humanity through the lens of instruments and music. We find ourselves represented in these instruments because, for much of our history, music has been central to who we are and what we do. I hope this exhibition will reconnect all of us with our innate musicality and shared heritage of harmony.”
Through six thematic sections, the exhibition will illuminate the relationship between the body and musical instruments and how they serve as channels for self-exploration and expressions of culture and belief systems. Musical Bodies will also reveal how instruments are used to stand in for the body to address topics that are traditionally considered taboo, such as sex and death.
Musical Bodies was conceived as an experiential exhibition. An innovative interactive will enable visitors to create music through intuitive movements and explore the blurred boundaries between body and instrument. Large-scale projections will display newly commissioned footage of beatboxing, body percussion, tap dancing, and more by such acclaimed New York–based and international artists as tap dancer Savion Glover, Beatbox House, and whistler Molly Lewis. Special activations throughout the run of the exhibition will take place in the gallery and include musical performances from an array of artists as well as workshops that activate the body as an instrument. More details will be announced at a later date.
Credits and Related Content
Musical Bodies is conceived and organized by Bradley Strauchen-Scherer, Curator in the Department of Musical Instruments at The Met, assisted by Ava Valentino, Research Assistant in the Department of Musical Instruments.
A fully illustrated catalogue will accompany the exhibition and will be available for purchase from The Met Store.
The catalogue is made possible by the Mary C. and James W. Fosburgh Publications Fund.
The Met will host a variety of exhibition-related educational and public programs, including a Creative Convening, Artists on Artworks and Met Expert talks in the galleries, a music workshop, and more. Details will be announced.
Musical Bodies will be on view during the presentation of the exhibition Costume Art (May 10, 2026–January 10, 2027), which will examine the centrality of the dressed body in fashion and art. The two shows will provide visitors with distinct and engaging explorations of the body’s relationship to artistic expression.
Featured image– Thomas Zach, Violino Harpa Forma Maxima, 1874. Wood (spruce, maple, ebony), metal strings. Collections Musée de la musique / Cliché Claude Germain, 2020. Cité de la musique-Philharmonie de Paris
Screenshot from the 1981 Canadian sci-fi film Scanners directed by Canadian film maker David Cronenberg.
I am a chronic Migraine sufferer. Are you?
I was diagnosed when I was 18 and now in my 40’s I still get cluster migraines. Cluster Migraines are recurrent, severe headaches that usually stick to one side of the head, for me it’s the left. I’ve probably suffered from them since I was a very young child. Throughout my life, I have dealt with many hurtful comments from those unable to understand my affliction. Their comments used to really get under my skin. Migraines are very severe. They are not just a very bad headache. No two Migraine sufferers are the same when it comes to patterns of pain or management. To make matters worse Migraines are an ‘invisible illness’.
An invisible illness is something that the sufferer feels but no one else sees or acknowledges. Those that are afflicted with migraines are often accused of faking or imagining their disabilities.
But it’s not entirely hard to understand why- these disabilities are not always obvious to the onlooker and the cyclic nature of migraines means that they are a chronic disability that are never going to go away.
To suffer with migraines is to know not only physical pain but also at times, sociological pain and even ostracization. It’s when you’ve been motoring onward through life and everybody looks at you like you are a healthy person but in actuality, there’s that one thing that keeps you from being the person you see yourself to be. This compounds your mood and may even trigger that other “invisible illness”: Depression.
Yes, migraines come with a lot of misunderstandings from critics that refuse to believe what is happening.
My favorite line has always been: “You’re young, there is nothing wrong with you…”. It’s shameful! The idea of simplifying health into a debate about youth and middle or old age. You take the time to try to explain and inform people what your life is about and yet they still believe that your suffering is all in your head. That’s when I usually hear comments like- “Get outside and get some fresh air, that’ll fix it.” or ” You just need to get over it, move on with your life”. The worse thing for me to hear is ” If you’re that sick how come you are doing that?” The sad truth is that all these phrases come from people who can’t understand what it is like to deal with an invisible illness.
Migraines occur when the blood flows through the brain causing blood vessels to rapidly expand, which in turn causes pain and other symptoms.
For me, it all starts with an unbelievable pain that can persist anywhere from 24 to 72 hours. I refer to it as having a huge Mack truck stuffed inside my head. While this happens, symptoms include: vertigo, numbness, mass nausea, fainting, blurred vision, and sensitivities to light, sounds and smells. I have been told that many of these symptoms are very close to what one would feel if they were having a stroke. Sometimes these symptoms can occur without the associated pain. I look at those as ‘added extras’. They include bright sparkles in the sky that only I can see…an added extra.
When things are at their worse and I have tried taking all the suggested and prescribed medications such as aleve, and the pain just won’t go away I plop myself in a car and have somebody drive me to the hospital.
If you were me and had experienced this you may have ended up spending four hours at the hospital on a good night. When you were admitted they may have looked at you like you were a drug addict. They may have checked you for signs of a stroke at which point they may have placed you in a bed where you wait and wait and wait. You may have been hooked up to an IV with sodium solution to help rehydrate you. Then they may have started you on the meds.
For me it’s always been 2mg of Maxeran (anti-nausea medication for people who go through chemotherapy) and 5mg of Toradol ( a strong pain medication). Perhaps it’s that mixture that worked for you and you sat there and waited, maybe even had a snooze. The nurse observed when you started to feel better because the colour flowed back into your face and you became very hungry. At this point you are finally ready to go home and start all over again knowing that the next day will always be the best day.
Perhaps you are like me- I turn into a bit of an energizer bunny… with the pain removed and the symptoms gone I actually feel pretty healthy and am ready to face the world again.
But what triggers these attacks?
This is the hardest part. These horrid brain attacks can be caused by almost anything- physically exhausting yourself on one extreme or simply walking down the soap isle in the grocery store on another. Almost anything and everything can trigger a migraine for me. The weather for instance is a trigger that I have been stuck with for years. Before a storm, a build-up of barometric pressure can be an instant trigger. Flying on airplanes is a trigger due to the change in the atmosphere.
If you want simpler triggers how about MSG, Artificial Food Colourings, Caffeine, Red Wine or Preservatives? Even certain veggies tend to make the list. Other things that are triggers can be strong perfumes/soaps, too much stress, bright lights and loudness. Basically anything that could possibly cause a disturbance to my personal inner balance. It is consoling to know that not all of these are triggers for everyone who suffer with migraines. Somethings effect more people than others. Trying to maneuver between what does and what doesn’t trigger is a battle in itself.
This invisible illness leaves me helpless.
The idea that it can pop up at any point in time means there is no space for future time planning. Making plans in my life is non-existent. I can say I am going to go here or there but in the long run until I get up that morning I will never be sure. Then there are the times that I take the chance and go out because I am just so tired of my couch no matter how bad I feel. Other times I stay home and safe.
Few non-sufferers know that in certain places Migraines have been upgraded to a neurological disorder. Another fact that most people don’t know is that it will never go away. There is no cure only pacifiers that help you to deal with everything that transpires. Sometimes these pacifiers worsen the attack.
And the frequency of attacks?
I get them 15 days out of a month which doesn’t leave much time to actually live a carefree lifestyle. There are so many things that I and other sufferers have lost because of this illness. Jobs and career goals go right out the window. The simplest things like enjoying a movie at the theater, going to see a live band or even a family gathering are at risk. It has to be just right and on a good day. It’s very stressing trying to keep up. I haven’t even mentioned the troubles it creates within a personal relationship, between you and the significant other. Between everything you have to do and the things that you want to do. All this takes place within such limiting time frames. I almost feel grateful, to have dealt with them from such an early age because it has prepared me to deal with this kind of lifestyle. In a way it’s made me so much stronger then I ever thought I could be. I have learned how to look at life in a different way. Don’t get me wrong, I would give anything to live without them but because that is not an option…I will reluctantly settle for this.
This is a side of me that many people do not get to see.
It’s something that I have only shared with the most important people in my life. There is a huge stigma out there when it comes to diseases or conditions that go unseen. When I get an attack you wouldn’t know it, you can’t see it. You can’t see the numb and tingles that invade my body. A lot of people just do not understand nor do they really want to. In our fast paced society it gets lost. I am sharing my story because I would love to see the stigma removed. I want people to understand that just because someone seems healthy and able it doesn’t mean that they actually are.
All those comments that I pointed out at the beginning of this article are things that I have heard for years. I still deal with it to this day. People that I have had to deal with who never understood no matter how much you try to explain it. I know that other people have gone through the same things that I have and I want to let them know that they are not alone. I also want to let other people know that they need to think before making a judgment on somebody else. Keep in mind that old saying: “Do not assume or judge somebody until you have walked a mile in their shoes…” For the Silo, Dawn Bank.
Modern conveniences many take for granted — cell phones, laptops, GPS devices, even coffee makers — run on computer chips introduced by U.S. firms that established America’s leading role in technology. Trace the digital revolution, from its beginnings to the present day, with each groundbreaking advance.
How did these gains happen? Today’s technology emerged from U.S. support for research and development combined with America’s robust private sector, its scientific community, and its innovative spirit.
Bell Labs, a legendary research hub in New Jersey, began as a branch of the Western Electric Company, a subsidiary of the American Telephone and Telegraph Company (AT&T).
Founded in 1925 to meet a growing need for masscommunications, Bell Labs hired top engineers, physicists, chemists, and mathematicians to design and patent equipment (including a high-vacuum tube that transmitted telephone signals across North America).
Bell Labs encouraged interdisciplinary collaboration that produced groundbreaking discoveries. The labs were driven by scientific curiosity, flexible deadlines, and — thanks to AT&T’s budget — stable funding. Lab directors adopted a hands-off management style, and innovation flourished.
DID YOU KNOW?
In 1932, Bell Labs physicist Karl Jansky discovered radio waves coming from outer space. He’s known as the father of radio astronomy.
In the post-World War II period, Bell Labs’ Mervin Kelly assembled an all-star team of scientists to develop a replacement for the vacuum tube, which was bulky, fragile, and prone to burning out.
In 1947, John Bardeen and Walter Brattain — supervised by fellow physicist William Shockley — invented the point-contact transistor, a semiconductor device that amplifies sound and switches electrical currents on and off.
In 1948, Shockley designed the junction transistor, a more robust and reliable transistor. Its small size, low power consumption, and durability paved the way for computers, portable radios, cell phones, and other devices.
Eight years later, Bardeen, Brattain, and Shockley would be awarded the Nobel Prize in physics for this breakthrough.
DID YOU KNOW?
Bell Labs researchers have been awarded 10 Nobel Prizes in physics and chemistry, spanning from 1937 to 2023. While Bell Labs was at its most productive from the 1940s to the 1970s, important research continues today at its New Jersey headquarters.
Bell Labs continued to improve transistor technology during the 1950s, developing the silicon transistor and the metal-oxide-semiconductor field-effect transistor (MOSFET).
The MOSFET proved crucial for building high-density integrated circuits (ICs), or microchips, in the 1960s. Microchips — consisting of billions of tiny transistors crafted from semiconductor materials, commonly silicon — work together to power electronics.
Recognizing the potential for widespread impact and profits, Bell Labs created licensing agreements to share transistor technology with other companies.
In 1955, William Shockley left Bell Labs to establish Shockley Semiconductor Laboratory in Mountain View, California. Within a couple of years, some of his employees — engineers and scientists — formed their own company, Fairchild Semiconductor.
Fairchild is credited with the birth of Silicon Valley. The company became a major player in the growing semiconductor industry, and many Silicon Valley firms — including Intel (founded in 1968) and Apple (in 1976) — have ties to Fairchild alumni to this day.
As demand for semiconductors grew, so did the need for manufacturing capabilities.
Throughout the 1980s and 1990s, Japan, South Korea, and Taiwan became players in the industry, with Japanese companies like Toshiba and NEC influencing the data-storage market and South Korea’s Samsung and SK Hynix focusing on memory-chip production.
Meanwhile, the Taiwan Semiconductor Manufacturing Company (TSMC) upended a traditional business model of integrating chip design and manufacturing. It introduced the fabless-foundry model, encouraging firms to specialize in either design (fabless) or fabrication/manufacturing (foundry).
This increased efficiency. What’s more, it allowed many small firms — those lacking resources to open manufacturing plants — to design chips.
DID YOU KNOW?
The fabless-foundry business model democratized chip production, allowing startups to enter the market without the need for expensive manufacturing facilities.
Experts predict that quantum computing — with its ability to accelerate AI by overcoming limitations on data size, complexity, and processing speeds — will shape the future.
Quantum AI will develop algorithms that could advance pharmaceutical discoveries, predict financial outcomes, improve manufacturing, and bolster cybersecurity. Quantum/AI partnerships already comprise an active and developing market, with U.S. tech giants like IBM and Nvidia investing in both domains.
Industry leaders point to many factors that shape U.S. technological innovation. One such factor is the U.S. system of intellectual property protection, which fosters the spirit of risk-taking, says Walter Copan. (That system is enshrined in the U.S. Constitution, thanks to the foresight of America’s Founding Fathers.)
Sanjay Mehrotra cites the U.S. business culture of “openly, freely being able to debate ideas,” adding, “The best ideas win.”
Thomas Caulfield says, “This is where you can work hard, live your dream, become an entrepreneur, start a company.”
And Jon Gertner notes that key people at Bell Labs came from humble beginnings: “To me, that feels uniquely American — the idea that talent could rise from almost anywhere and shape the future of communications.”
It’s part of Silicon Valley lore that massive tech empires often sprouted from humble roots. As quantum computing and AI herald the next seismic shifts in technology, innovation hubs could emerge in unlikely places. Who knows? The next great U.S. tech companies might now be incubating in a town anywhere in America.

")
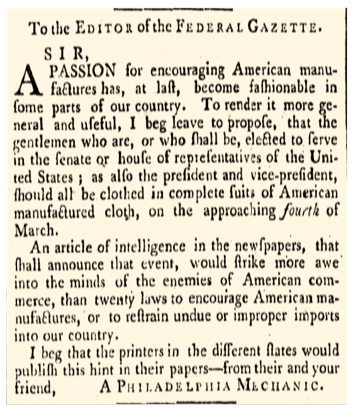

 Right: Washington's inaugural coat (Courtesy of the Mount Vernon Ladies' Association)")


 It’s hard to say exactly what the future holds, though Steve Jobs was seemingly pretty good at predicting it. In 1972 I had the unusual opportunity to be in a computer class with Steve Jobs. Of course, at the time he was just a nerdy teen and I was four years his junior. He and I would vie to play Tic-tac-toe on a 500 pound “computer” that our High School had recently purchased. Steve was obsessed with this machine. One day I asked Steve why he was so fixated on this refrigerator sized computer. He turned to me and said in an intense manner, “Don’t you see? This machine is going to change everything! It’s going to change the world!”