Category Archives: Finance

Daily Survival in Gaza Persists Post-Ceasefire: LIFE Continues Humanitarian Relief Amid Ongoing Needs

Post-Ceasefire, Gaza Families Face Prolonged Hardship as LIFE Continues Delivering Life-Saving Humanitarian Aid

Despite the perception that ceasefires offer meaningful relief, conditions on the ground in Gaza demonstrate that humanitarian emergencies do not end when active conflict pauses. For civilians, the period following a ceasefire is often marked by continued displacement, damaged infrastructure, shortages of food and clean water, and limited access to essential services.

Life for Relief and Development (LIFE), a global humanitarian organization, has maintained an active presence throughout these periods, remaining one of the few international NGOs authorized to deliver aid inside Gaza. LIFE continues to respond to urgent, life-saving needs while navigating significant challenges.

Ceasefires Without Recovery

While ceasefires may reduce immediate violence, they do not restore stability. Families in Gaza frequently return to homes that are damaged or destroyed, seek refuge in overcrowded shelters, or reside in temporary tents without adequate protection. Water networks remain compromised, food availability is inconsistent, fuel shortages persist, and access restrictions continue to impede the flow of humanitarian aid.

Field reports from LIFE-supported operations indicate that displacement remains widespread, with families moving repeatedly in search of safety, food, and water. Even during ceasefires, civilians continue to face severe challenges, including:

  • Limited access to clean drinking water due to damaged infrastructure
  • Inconsistent food supplies and a lack of functional cooking facilities
  • Exposure to harsh weather conditions in makeshift shelters
  • Elevated public health risks stemming from overcrowding and poor sanitation

These conditions underscore the reality that a ceasefire does not equate to recovery or safety.

LIFE’s Ongoing Humanitarian Response in Gaza

Despite restricted access and operational risks, LIFE has sustained a multi-sector humanitarian response aimed at meeting immediate survival needs and preserving human dignity. Through coordinated interventions across North, Central, and South Gaza, LIFE-supported programs have provided:

  • Emergency food assistance through hot meals, family food packs, and large-scale food convoys
  • Clean drinking water via tanker deliveries and the rehabilitation of damaged municipal water wells
  • Emergency shelter materials, including tents and weather-resistant covers for displaced families
  • Winter relief, such as warm clothing and footwear for children and vulnerable individuals
  • Infant nutrition support to address critical shortages for families with young children

These interventions have reached hundreds of thousands of individuals across multiple phases of emergency response, including periods identified as ceasefires—during which needs remained acute.

Operating Under Constant Constraint

Providing aid in Gaza requires continuous adaptation. LIFE-supported teams have had to navigate border delays, limited fuel supplies, communication disruptions, and security-related restrictions. Daily adjustments ensure that relief reaches the most vulnerable populations, including displaced families, children, older adults, and households with no access to essential services.

By maintaining operations both during and after ceasefires, LIFE helps bridge the gap between temporary pauses in hostilities and the ongoing humanitarian needs that continue long after media attention subsides.

One beneficiary, Neama, a 38-year-old mother of four who has been displaced multiple times, described the uncertainty that continued beyond the ceasefire. Her family faced overcrowded shelters, a lack of cooking facilities, and severe food scarcity. Through LIFE-supported hot meal distributions, her family received freshly prepared meals over several days.

The hot food meant more than nutrition,” she shared. “It restored dignity and gave my children a sense of normal life again, even in the middle of everything.”

Humanitarian Needs Beyond the Headlines

A ceasefire does not end the humanitarian crisis for families in Gaza. Many continue to face shortages of food, water, shelter, and basic services, with recovery dependent on sustained humanitarian support rather than temporary pauses in conflict.

“A ceasefire may pause active fighting, but it does not pause human need,” said Dr. Hany Saqr, CEO of Life for Relief and Development (LIFE). “Families in Gaza continue to experience daily challenges accessing food, water, shelter, and essential services. Our responsibility as a humanitarian organization is to remain present, impartial, and responsive, ensuring that assistance reaches civilians when they need it most, regardless of circumstances.”

For the Silo, Tasneem Elridi.

About Life for Relief and Development (LIFE)

Life for Relief and Development, headquartered in Southfield, Michigan, is a global humanitarian relief and development organization committed to assisting individuals regardless of race, gender, religion, or cultural background. LIFE is a registered 501(c)(3) nonprofit organization and holds Consultative Status with the United Nations Economic and Social Council (ECOSOC).

Navigating the Great Wealth Transfer: What It Means for Families

The landscape of North American wealth is on the brink of a historic shift. Current research estimates that between $75 trillion usd and $125 trillion usd ($102.5 trillion cad and $170.8 trillion cad) will change hands over the next two decades in American alone as assets pass from the baby boomer generation to younger heirs. This unprecedented movement of capital, now widely referred to as the Great Wealth Transfer, is set to redefine family finances, generational relationships, and the future of estate planning across North America.

While the transfer represents an extraordinary opportunity for Millennials and Gen Xers, it also carries significant legal and emotional risks. Attorney Don Ford, a Board-Certified expert in Estate Planning and Probate Law with Ford + Bergner LLP, warns that without thoughtful preparation, the same wealth intended to provide security can just as easily fracture families and ignite costly disputes.

A Scale Never Seen Before


“The scale of this transfer is unlike anything we have seen before,” explains Ford, Managing Partner at Ford + Bergner LLP—a Texas-based boutique firm specializing in estate planning, probate, and guardianship. “And when large sums of money move quickly through families that are unprepared, conflict becomes far more likely.”

Why This Is Happening Now

Several forces have converged to accelerate this moment.

Americans are living longer, allowing assets to compound over extended periods. Many individuals entering their later years benefited from decades of sustained market growth, dramatically increasing the value of retirement accounts, real estate holdings, and privately owned businesses. Together, longevity and market performance have produced estates that are often far larger and more complex than families anticipate.

Yet wealth has grown faster than planning.

“Many estate plans are static while wealth is dynamic,” Ford notes. “People create documents years earlier and assume they will still work, even though their family structure, asset values, and risks have changed.”

Why Planning Is an Act of Care

Estate planning is often misunderstood as a tax exercise or paperwork requirement. In reality, it functions as a roadmap that protects families, preserves intent, and prevents conflict.

Effective planning allows families to address challenges before they escalate. Trust structures can provide what Ford describes as “training wheels” for heirs who are not yet equipped to manage significant portfolios. Clear language can reduce ambiguity in blended families, ensuring spouses and children from prior marriages are treated according to the individual’s wishes rather than default statutes.

Business continuity is another frequent flashpoint. Without an agreed-upon succession plan, profitable family enterprises can be forced into liquidation simply because heirs cannot agree on control or direction.

“Planning is not about control from the grave,” Ford says. “It is about clarity while you are still here.”

The Rising Tide of Probate Litigation

As wealth transfers accelerate, probate courts in America are bracing for an increase in estate-related litigation and similar situations are set to occur in Canada and Mexico. According to Ford, several recurring issues are already driving disputes.

Cognitive decline and undue influence are among the most common triggers. As older adults reach their eighties and nineties, dementia and other impairments become more prevalent. Late-life changes to wills or trusts are frequently challenged by heirs who believe a loved one was pressured or lacked capacity.

Blended family dynamics also play a major role. Modern families often include second marriages, stepchildren, and competing expectations. When individuals die without updated documents, intestacy laws can produce outcomes no one intended, fueling resentment and lawsuits.

Ambiguous or outdated estate plans remain another risk factor. DIY documents and boilerplate language often fail under scrutiny, leaving courts to interpret vague instructions. Fiduciary disputes are equally common when executors or trustees are accused of mismanagement, lack of transparency, or favoritism.

Family-owned businesses present some of the most complex conflicts. When multiple heirs disagree over leadership, equity, or control, litigation can become the only path forward, sometimes ending in forced sale.

“The tragedy is that most of these disputes are preventable,” Ford emphasizes. “They arise not from greed, but from silence, assumptions, and documents that were never meant to handle modern family realities.”

The Bottom Line

The Great Wealth Transfer is not merely a financial event. It is a social and legal reckoning that will test families’ communication, planning, and preparedness. As trillions of dollars move between generations, proactive estate planning has become less about wealth preservation and more about relationship preservation.

For families willing to plan with intention, the transfer can strengthen legacies rather than divide them. For those who do not, the cost may be far higher than they ever expected.

For the Silo, Merilee Kern.

LIFE for Relief and Development in Its 33rd Ramadan: A Call for Unified Humanitarian Efforts to Confront Famine in The Developing World

As the blessed month of Ramadan approaches—bringing with it the values of mercy and solidarity—this year arrives amid a profoundly harsh humanitarian reality across vast regions of the Arab world.

Among the scattered tents of displacement that have become refuge for the uprooted, and in homes reduced to rubble—leaving behind only ruins, grief, and the names of the missing—some fasting individuals will observe Ramadan at meager tables, continuing their daily struggle to secure the simplest iftar meal after long hours of fasting. Others will fast without knowing how they will obtain their next meal.

Millions of Meals and Thousands of Beneficiaries

Humanitarian initiatives multiply each year, yet their impact varies. Some alleviate hardship, while others fall short of addressing the depth and complexity of ongoing crises.

For 33 years, LIFE for Relief and Development has mobilized its efforts to fulfill its humanitarian mission during the holy month of Ramadan by implementing relief programs focused on meeting the basic needs of the poorest and most vulnerable families. Through the distribution of food parcels and the organization of communal and individual iftar meals, LIFE’s assistance reaches hundreds of thousands of families in need worldwide.

LIFE teams were present in 37 of the 60 countries where the organization operates sustainable development and relief projects. During Ramadan 2025, nearly 6 million meals were distributed through 16,000 nutritionally balanced food baskets. Additionally, 51,000 freshly prepared hot meals were provided, benefiting approximately 97,000 fasting individuals in need.

Gaza: A Communal Iftar Amid the Rubble

Gaza stood at the forefront of LIFE’s efforts. Amid the devastating landscape and the remnants of war, displaced families recall memories of past Ramadans—when loved ones gathered around one table and smiles preceded the meal. Though those scenes now seem distant, LIFE continues to revive the spirit of solidarity, instilling a glimmer of mercy and hope in hearts exhausted by crisis.

LIFE worked to provide food security for 2,883 families—sufficient to sustain them for three months—alongside organizing communal iftar gatherings open to anyone in need. Despite being held atop the rubble, these gatherings brought moments of joy to attendees.

In addition, Eid celebrations were organized for orphans, benefiting 7,660 orphaned families, including 1,200 families at a special Gaza orphan event. Iftar and suhoor meals were also distributed at Al-Aqsa Mosque.

Confronting Famine in Sudan

From Sudan, we spoke with Ms. Rima Bakir, LIFE’s Projects Coordinator in Sudan, who described the scale of suffering:

“Ramadan will arrive for many children in Sudan not with joy, but with hunger and deprivation. They will welcome the month with empty stomachs, fear, exhaustion, and severe food shortages.

Pregnant and nursing women suffer from malnutrition and increasing health risks, while widows bear a doubled burden in securing food for their children after losing the family breadwinner amid rising living costs. They are living through daily hardship and a continuous struggle for survival.

Over the past year, we tracked displaced families in Kassala, where we provided suhoor and iftar meals to 845 families affected by the war. We also distributed nutritionally integrated food baskets weighing approximately 30 kilograms to support children’s healthy growth, in addition to providing clothing for orphans.”

Targeting the Poorest and Most Remote Communities

Regarding this year’s anticipated activities, Omar Mamdouh, Director of Projects, stated:

“We will intensify our teams’ efforts in the poorest areas facing potential famine, according to United Nations reports. We plan to support vulnerable families and displaced populations in crisis zones by strengthening social solidarity and spreading joy through food assistance projects, organizing iftar gatherings, and distributing hot meals and food baskets in remote areas often beyond the reach of charitable organizations.

Before Eid, we will also implement orphan sponsorship initiatives by providing Eid clothing, gifts, and financial and food assistance. We will distribute zakat and charitable donations to the most deserving beneficiaries, in addition to facilitating fidya and kaffarah contributions.”

Ranked Third Among the Best Organizations Fighting Poverty and Hunger

Vicky Robb, Director of International Programs, added:

“We will expand our food assistance projects in developing countries, particularly in displacement camps where children are suffering—such as those along the Pakistan-Afghanistan border, in war-affected regions of Sudan and parts of Africa, and in countries facing silent poverty in Southeast Asia.

LIFE distinguishes itself by strategically targeting areas inaccessible to most relief organizations—whether due to the severity of war, as currently in Gaza, Sudan, and Lebanon. Our teams have delivered Ramadan meals and food baskets on foot. In Bangladesh, they navigated deadly floods by boat to reach the hungry. In Afghanistan, despite mud and extremely difficult terrain, food was transported on horseback. In Tanzania, our teams left their own families for days to reach remote communities where hunger persists and infants cry silently from malnutrition. They relied on multiple forms of transportation to ensure aid reached beneficiaries before the start of the holy month.”

For the Silo, Tasneem El-Ridi.

For more information:
http://bit.ly/4rUIsqa
https://linktr.ee/LIFEUSA.ar

USA- Breaking The Cycle of Foreign Assistance Enabling Corruption

Moral Hazard – A situation where one party assumes greater risk because it understands that another will remedy the harmful effects.

While the hundreds of billions of dollars in U.S. foreign assistance spent over the years have dramatically improved many people’s lives and livelihoods around the world, too often the United States’ approach to foreign assistance failed to advance U.S. interests, failed to spur systematic development, and enabled and perpetuated dependence and corruption by leaders in recipient countries. Since 1991, the United States has provided more than $200 billion in foreign assistance to Africa, yet the African Union reports that African countries lose an estimated $88 billion each year through tax evasion, money laundering, and corruption. Too often, what is needed for economic growth and development is not more money, but sound reforms that incentivize enduring private investment and growth.

Instead of insisting on mutual accountability to use U.S. assistance to address the causes of poverty and underdevelopment, too often we funded outputs to allay the symptoms. In so doing, we failed both the American taxpayer and the citizens of developing countries who looked to their governments and ours to help create the conditions to realize a better future.

For decades, the United States did not have a consistent policy as to even whether assistance was charity or a foreign policy tool. We did not require a committed partner, a coherent business plan, equity collateral at risk, or funding subject to performance-based disbursements. We infantilized recipient governments instead of having candid discussions on mutual performance expectations. Too often our approach to developing countries – frequently perpetuated by the excuses of those same governments – reflected the soft bigotry of low expectations. We excused away the lack of political will as “capacity constraints,” dismissed it with “we shouldn’t expect too much,” and did not challenge them when governments acted in contrast to their professed commitments.

Too often, we were content to confuse governments’ commitments for actions. We misinterpreted our access to leaders as influence with those leaders. We mischaracterized aid projects’ outputs as outcomes and program objectives as results. We misconstrued governments’ permission for us to expend aid as evidence that they shared a commitment to advance professed objectives. Perhaps worst, we failed to acknowledge when leaders of aid recipient countries demonstrated over and over through their actions that they prioritized their personal interests over, and at the expense of, the interests of their own country and citizens. Virtually never did we withhold assistance funds because host governments failed to deliver on their commitments, instead we responded by providing even more aid “because they have needs.” By trying to save people from bearing the brunt of the bad governance and corruption of their leaders, we helped perpetuate that very same corruption and bad governance.

Quite simply, we violated the central maxim of international development: the donor cannot want development more than the recipient. By doing so, we fueled moral hazard. From the pure greed of Malawi’s “Cashgate” scandal under Joyce Banda to the systematic kleptocracies of Bangladesh or South Sudan, by back filling health and social service needs recklessly created by bad governance, we have enabled and underwritten government corruption. In the worst cases, such as the predatory abuses of Mali’s Ibrahim Keita or Guinea’s Alpha Conde against their own populations, corruption and the failure to deliver basic public services needs led to military coups and incursions by terrorist organizations.

American foreign assistance is not charity but a tool to advance American diplomacy, security, and prosperity.

To accomplish these goals, we must focus our assistance and insist on administering it with host-government buy-in and mutual accountability for outcomes. This, in turn, will leave space for market driven growth that will also help close off the means by which malign international actors exploit developing economies and workers. We should not be dissuaded by detractors who will attempt to vilify a more transactional approach as “neocolonialism.” Quite the opposite is true. By insisting on systematic reforms that spur transparent and accountable growth and allow governments to retain funds to support their people, the United States can do more to catalyze actual economic development and the upliftment of developing countries’ societies – and advance tangible U.S. interests – better than we have in recent decades. It is the dependency-oriented, NGO-driven old model of development that is fundamentally colonial in mindset – refusing to respect development nation sovereignty, determinism, or agency.

Operationalizing this approach involves adopting investment-oriented goals, requirements, and incentives:

  • A Serious Host Nation: Secretary Rubio has been clear, “Americans should not fund failed governments in faraway lands…we will favor those nations that have demonstrated both the ability and the willingness to help themselves.” If a government is not already taking steps to stem corruption and grow the economy when its own funds are at stake, we should have no expectation that they will be better stewards of U.S. funds. Without an aligned host-government, we should focus our resources elsewhere.
  • The Right Focus: Our purpose is not to give money away, but to catalyze systemic reforms that enable sustainable growth and opportunities for the U.S. and recipient country. Neither governments nor donors create growth; instead, our roles are to foster conditions for the private sector to invest, create jobs, spur growth, and pay taxes to fund public services. Hence, U.S. foreign assistance should focus on curbing corruption and overcoming and remediating binding constraints to growth to lay the foundation for a transparent, level, and accountable business enabling environment.

  • Confidence in The Business Plan: Most developing countries have national development plans, but too often they are unresourced and unprioritized works of fantasy, and seldom do governments enforce accountability for their actual implementation. What President Trump explained in clearly delineating America’s national interests in this year’s National Security Strategy is equally true of developing countries: when everything is supposedly a priority, nothing really can be. We should help sincere host governments develop focused, realistic strategies based on core sectors and targeting key constraints that are founded on candid analysis and include specific, tailored tactics.

  • Skin in the Game: If a country is not going to put its own resources behind an effort, it is either not really a priority, they are not really serious, or they don’t have confidence in their plan. Few investors would engage where the owner hasn’t put collateral down or his own equity at risk. Why should foreign assistance not require the same? Here, the Millennium Challenge Corporation (MCC) has demonstrated two key best practices that ensure buy-in. The first is a requirement for co-financing by the host government. The second is conditions precedent: tangible reform actions a host government takes before funding even begins, to enable the success of the project outcomes.

  • The Right Resources: Again, our purpose is not to give assistance away, and the history of both corruption and assistance has shown that money is not what is most lacking to spur development. So, building on an analysis of binding constraints to growth and a business plan that we have confidence in, it is incumbent on the United States and the recipient government to craft a bespoke package of technical assistance interventions to inform and enable the reforms needed. This should not be an approach of letting a thousand flowers bloom, and it must not be built around the question of “how can we help?” Instead, we must start with the questions “what are the outcomes we want to achieve in the American interest and what needs to happen to realize them?” and build an assistance program around that.

  • Have a Contract: Unlike the Development Objective Agreements (DOAGs) of USAID that bound the U.S. to fund sectors but seldom included host governments’ performance commitments, the MCC model again provides a best practice. Explicitly detailing shared objectives and commitments by both governments – typically ratified by the legislature to carry the force of law – reduces uncertainty and improves accountability by enshrining the binding obligations of both parties.

  • Performance-Based Funding: Too often, once development projects were approved, donors’ focus turned inward to implementation, achieving outputs, and keeping funds flowing even if receiving governments actively undermined them. Gradually, funding agencies have begun shifting to performance-based disbursements. By requiring a host government to demonstrate – through its actions, not merely its rhetoric – that it remains politically and financially committed to achieve professed objectives, we ensure that U.S. assistance achieves greater impacts.

Under President Trump and Secretary Rubio’s leadership, we have the opportunity and courage to acknowledge our mistakes, to embrace candid lessons learned, and to do better. America’s generosity in doing business with those who help themselves remains as strong as ever. We are not turning away from less developed nations, instead now is the time to lean in to lend a useful hand to those who are sincere and treat them as mature stakeholders. In engaging valued, sincere nations, nothing should be imposed, hidden, given as ultimatums, or come at the partner’s expense; we are not China. Foreign assistance that delivers for the American people and our partners must be founded on sincere, voluntary, and transparent engagement. But it must be backed by tangible action and, if a recipient nation proves through their actions that they are not committed to our professed shared objectives, our allegiance must first be to the American people to be stewards of their resources.

Having dedicated my life and career to Africa and the developing world, I am invigorated by the massive potential these nations possess, and I have witnessed how the United States can help turn that potential into a reality that benefits both nations. By restructuring our approach to foreign assistance and engaging developing countries based on national interest, we can help curb the corruption that deprives families of the hope of that better future. We can deliver lasting and systematic growth alongside recipient countries. And, we can deliver tangible value for the American people through a more secure and prosperous world.

For the Silo, U.S. Ambassador Michael C. Gonzales.

Michael C. Gonzales is the U.S. Ambassador to the Republic of Zambia and the U.S. Special Representative to the Common Market of Eastern and Southern Africa (COMESA). He has held senior posts throughout Africa and Asia over his career.

Make Your Home Look Better For Winter Selling

A truism in real estate is that the best time to sell is during the spring and summer months.

You have more buyers, prices and valuations are higher, and your home simply looks better under the bright summer sun than during the drab winter gloom. But what if you really need to sell your home now?

Before you list your property in the real estate listings such as these in Ottawa, here are a few simple ‘tricks’ you can try.

  1. Make improvements to your fence.

If you have a fence, then it’s the first thing that people encounter as they walk to your home. It should give a good first impression, so you need to fix damages if there are any. You can also consider repainting it to make it look new.

Don’t forget to make sure that the latch works perfectly too. It should close easily enough without any sort of fussy process.

  1. Prune your trees.

The trees near your home shouldn’t block the buyer’s view of your house. Instead, the trees should have silhouettes that frame the house to make it look much better. It’s best to prune your trees during their dormant periods when they don’t have leaves. This makes it easier for you to see the shape and structure of the tree.

Remove the damaged and diseased branches first. Then get rid of the branches that hang low enough to obscure your house and hang over walkways. Finally, thin the crown to improve the air circulation and the amount of light.

  1. Plant snow flowers.

You can plant early narcissi and snowdrops in your garden, along with a few clumps at the edges of your walkways. These can add some color to your home amidst all that white snow.

You can also plant hardy hellebores that thrive during the winter months, such as the Ashwood Neon, the Walberton’s Rosemary or even the stinking hellebore (H. foetidus).

  1. Attract more birds near your home.

Having plenty of birds around is great during the winter. The place seems alive, and you get plenty of colors. You can do this simply by putting up a bird feeder on your property. You can also plant shrubs in your garden that are known to attract birds. These include bayberry, snowberry, and burning bush.

  1. Touch up the house number.

Your house number is important because you want your potential buyers to find your home more easily. Sadly, plenty of homes have rather illegible house numbers.

Even those that are noticeable can seem outdated or downright unattractive. You can improve its look in various ways so that it becomes appealing and also prominent.

  1. Keep the house clean.

One problem during the winter is that plenty of people track in mud after walking around in the snow and sludge. Often doormats aren’t just up to the job of getting rid of all that gooey mess.

However, you can arrange for boots to be removed first before people enter the home. If that’s not possible, you can at least buy and set up an effective boot scraper that can help your doormat get rid of the mess.

  1. Use your Christmas lights.

Put them up early, and leave them up until February if you have to. These lights can really make your home look better.

Use plenty of Christmas décor for more color as well.

  1. Wash your windows.

You need to get rid of the grime in your windows, which prevents the sunlight from getting into your home.

Featured image- Hadley Hooper/ Boston Globe. 

Life For Relief And Development Ranks Third Globally Among Humanitarian Orgs

According to Charity Navigator  2025

Amid escalating crises in the Middle East and the developing world, Life for Relief and Development (LIFE) has been recognized as the third-best global humanitarian organization by Charity Navigator. The organization also secured fifth place for its humanitarian work in Palestine, and fifth place worldwide in the fight against poverty. These achievements earned LIFE a 100% rating, an endorsement from the U.S. Agency for International Development (USAID), as well as recognition by Impactful Ninja as one of the top humanitarian organizations in North America. LIFE was further honored with the Humanitarian Partnership Award for its collaborative initiatives.

Sustainable Programs and Comprehensive Seasonal Projects 

Vicki Roob, Administrative Director at LIFE, explained that the organization was founded more than 33 years ago in the United States and works across more than 60 countries through 14 international offices.

Over the years, LIFE has distributed more than $624 million usd/ $859 million cad in humanitarian aid, supporting programs in food security, clean water, temporary shelter, healthcare, education, community development, family assistance, refugee support, and emergency relief during wars and natural disasters. Currently, the organization supports more than 13,100 orphans worldwide, providing essential care, nutrition, housing, and education, while also organizing annual Global Orphan Festivals filled with games, gifts, and entertainment to ensure children feel valued and supported.

Tent Camps That Saved Thousands of Lives in Conflict Zones

According to Dr. Abdulwahab Alawneh, Regional Director for Jordan and Palestine, LIFE implemented its “LIFE Organized Camps” project in Gaza, establishing nine camps across the north, center, and south of the Strip. Built with fire-resistant and durable materials, these camps provided shelter for 46,000 displaced people, featuring easily dismantled tents to accommodate recurring displacement. Each tent was equipped with bedding and essentials, alongside medical facilities, solar panels serving 7,000 individuals, and protective insulation for 3,000 residents against extreme weather. Clay ovens benefited 3,500 people, while 23 sanitation units were constructed.so LIFE Assisted 1.3 million Displaced People in general in GAZA.

Adding: “we’ve been proactively preparing to facilitate the delivery of urgent relief—shelter, food, water, medicine, and personal necessities—into Gaza. Our team on the ground has already begun implementing LIFE’s ninth camp project after tents arrived and installation began. We are now working to shelter 15,000 newly displaced families still exposed to the cold as winter approaches.

These are waterproof, cold- and humidity-resistant tents that also provide insulation against heat in summer. Made from PVC material, they have protected more than 29,000 families from fires during nighttime bombings in past years.

Using all borders to Gaza

We faced tough challenges but managed them through our extensive experience. We are not newcomers to Gaza’s relief field. We worked through approval requirements for specific items—like tent specifications—while some organizations struggled to get their tents through the crossings. Tents vary in size and function: family tents, medical point tents, hospital tents, and educational tents.

We are now awaiting approval for mobile housing units. However, shelter items like mattresses and blankets have been entering through Egypt on LIFE’s trucks without obstacles, while food parcels are transported through Jordan.

“For food items previously restricted for NGOs, we purchase them at discounted rates from local traders and distribute them to those most in need. We spared no effort to reach them—using animals or walking long distances on foot when necessary.

We also supply water—each truck carries 15,000 liters per camp, enough for 500 families for a week—alongside baby formula, infant supplies, medical kits, and medicines. We ensure field monitoring of activities, including eight camps already constructed, and we share updates regularly on social media in multiple languages.”

Emergency Relief and Orphan Care at the Forefront

In the past year alone, LIFE allocated approximately $1.1 million usd/ $1.51 million cad in emergency relief to families displaced by conflicts and natural disasters, including earthquake survivors in Afghanistan, Morocco, Nepal, Syria, and Turkey; war-displaced populations in Gaza, Sudan, Syria, and Lebanon; wildfire victims in Bangladesh; flood-affected communities in Afghanistan and Libya; and cyclone-hit regions in Myanmar.

Additionally, $6.4 million usd/ $8.81 million cad was invested in healthcare programs and medical supplies, $4.5 million usd/ $6.2 million cad in educational projects, and $2.1 million usd/ $2.89 million cad in in-kind aid shipments. Orphan support remained a priority, with more than $3.8 million usd/ $5.23 million cad dedicated to orphan sponsorship, education, and healthcare.

Seasonal projects also played a significant role: nearly $1.7 million usd/ $2.34 million cad was spent on Ramadan and Eid initiatives, with more than 11 million meals distributed across 36 countries during Ramadan alone. Over 272,620 individuals in 38 countries benefited from Qurbani (sacrifice) distributions. LIFE also allocated $1.4 million usd/ $1.93 million cad toward emergency food relief and constructed 122 water wells worldwide.

For the Silo, Tasneem Elridi.

North American Gold Adjusted Wages Reveal A Plummet Towards Traditional Poverty Level

Our friends at The InvestorsObserver research team have looked into how gold affordability has changed over years when compared to American wages. Parallels can be drawn between Canada wages and gold affordability.

They found that despite steady rises in US dollar salaries, the average American’s purchasing power, when measured in ounces of gold, has plummeted by 77% since 1998. 

Gold-adjusted income shows the real purchasing power.

Interestingly, by 2012, even the most prosperous states had wage levels equal to poverty thresholds from just 15 years earlier, revealing the erosion of real wealth, and a plummet to what used to be perceived as poverty level. 

What about Canada wages?

For the Silo, Sam Bourgi 

Each November American Thanksgiving Includes Lots Of Giving Back

Most take part in the holiday’s rituals, including traveling to spend time with family and counting life’s blessings, and 19% also donate to charities  to help others eat well around the holiday, according to a recent poll. It is a time of year that many Americans volunteer at food banks, churches or service organizations in order to help prepare meals or provide ingredients to those without enough.

Volunteers with Operation Turkey, a national nonprofit based in Austin, Texas, cook and deliver thousands of Thanksgiving meals complete with turkey, stuffing, gravy, vegetables and a slice of pie.

After 25 years, the all-volunteer organization has expanded to about 20 cities and now operates in states beyond Texas, including North Carolina and Pennsylvania. “It’s inspiring and humbling watching our local community rally together to make a difference for their neighbors,” says Josh Ortiz , an Operation Turkey volunteer in Dallas. “It all matters and makes a difference.”

People serving Thanksgiving meals in a commercial kitchen (© Timothy Hiatt/Getty Images for Feeding America)
Volunteers serve food at a church in Chicago the day before an earlier Thanksgiving. (© Timothy Hiatt/Getty Images)

Exercising for a cause

Many Americans want to help others while also getting in a little exercise before the big meal. (The average American consumes 4,500 calories on Thanksgiving, according to the Calorie Control Council). Thus, turkey trots — events where people run or walk to raise money for charities — are held in cities and towns across the country. Turkey trots make Thanksgiving “the biggest U.S. running day of the year,” according to the website RunSignup.com.

How about Canadian Thanksgiving Calories?

Ohio Turkey Trot

The 5K Turkey Trot in Granville, Ohio, drew 1,900 runners in 2024  and raised $130,000 usd/ $183,300 cad for a local food bank. Michelann Scheetz, of St. Luke’s Church, which organizes the annual event, says a team of volunteers works to pull off the Thanksgiving Day tradition that started in 2005. America’s Trot for Hunger, held in Washington, is now in its 24th year and draws thousands.

Jessica McCrorie, who served as a teen ambassador for the national nonprofit Feeding America, said she saw Thanksgiving bring out her own and others’ spirit of generosity. While volunteering with Island Harvest, McCrorie helped the nonprofit in Melville, New York, collect 30 turkeys and hundreds of dollars in donations at a grocery store.

“I feel like people may have felt more generous and connected to the issue of hunger because the Thanksgiving holiday is a time for family and friends to come together and share a meal,” she told Feeding America .

Canada’s Financial Rules May Be Holding Growth Back

  • In the second year of our regulatory scorecard paper, results continue to show the need for a more balanced approach to financial oversight, one that explicitly incorporates innovation and competition alongside traditional stability and consumer protection goals.
  • Newly issued and updated regulatory documents did not change previous results.
  • The imbalance reflects the mandates of Canadian regulators, which stand in contrast to those of their UK, Australian, and US peers, where innovation and competition are more explicitly recognized.
  • The study highlights deficiencies in the implementation and communication of cost-benefit analyses. Compliance costs are increasingly embedded across most of the financial sector workforce, with the share of labour costs and revenues devoted to compliance rising steadily, significantly exceeding international counterparts, and falling disproportionately on smaller firms.
  • If left unaddressed, these asymmetric and rising compliance costs risk diverting skilled labour and capital away from core business functions, undermining productivity, innovation, and the overall competitiveness of Canada’s financial sector.
  • Modernizing the mandates of Canadian regulators to explicitly recognize the tradeoffs between stability, investor protection, and economic dynamism is an economic imperative.

1. Introduction

Canada continues to face a well-documented struggle with weak productivity growth, poor business investment, and sluggish economic expansion.1 There is also a quantifiable link in Canada between growing regulatory burdens, including financial sector regulation and weaker growth.2 The challenge, therefore, is not whether to regulate, but how: regulators must find a balance between safeguarding financial stability and enabling economic dynamism. Achieving such a balance could be especially consequential in Canada, where both growth and competitiveness remain fragile.

Against this backdrop, a crucial question is whether Canadian financial regulators operate within a sound and structured framework that ensures the implementation of truly necessary rules and regulations. To provide an answer, this paper builds on the work of Bourque and Caracciolo (2024)3 which employed two complementary types of analysis – one theoretical, one empirical – to shed light on the strengths and the weaknesses of Canada’s regulatory landscape.

The theoretical analysis established the foundation for evaluating regulatory effectiveness by defining the core principles that should guide financial regulators in building a sound and efficient regulatory framework.4 It identified three essential steps that should underpin any regulation-making process: (1) thoroughly identifying the problem; (2) conducting a comprehensive cost-benefit analysis to weigh the implications of potential regulations; and (3) clearly articulating objectives to ensure predictability and consistency.

The empirical analysis involved a two-stage quantitative and qualitative textual analysis. The first stage consisted of an international comparison, where the performance of Canada’s primary federal financial regulator – the Office of the Superintendent of Financial Institutions (OSFI) – was benchmarked against two international counterparts: the United Kingdom’s Prudential Regulation Authority (PRA) and the Australian Prudential Regulation Authority (APRA). This comparative analysis helped contextualize OSFI’s regulatory approach in relation to best practices observed in other financially comparable jurisdictions.

The second stage dug deeper into the Canadian financial regulatory landscape, evaluating the regulations of the main federal and provincial bodies against the principles identified in the theoretical framework. To do this, Bourque and Caracciolo (2024) developed a comprehensive scorecard that assessed core regulatory documents to determine the extent to which Canadian regulators adhered to these principles.

The findings showed that although Canadian regulators have generally succeeded in crafting well-structured regulations, their approach often falls short of adhering – on aggregate – to the core principles outlined in the framework. This leads to a lack of predictability and a more reactive, rather than proactive, set of rules and regulations. In this environment, rules are introduced in response to emerging challenges rather than through proactive, forward-looking planning. Further, there is a notable lack of systematic and substantive use of cost-benefit analysis, both in the development of regulations and in communicating their expected impact.

The scorecard allowed for an investigation into the priorities of Canadian regulators. Most of the current regulations in Canada place financial stability and consumer protection as their primary goals. These are, of course, both crucial objectives; however, they are too often pursued without adequate consideration of their interplay with innovation and competition. As a result, regulatory frameworks may end up stifling growth, particularly among smaller firms that lack the resources to absorb compliance costs as easily as larger institutions.

Building on last year’s study, this paper has three principal objectives. First, it updates the regulatory scorecard. An annual update makes it possible to track how Canadian regulatory priorities evolve over time and assess whether any progress is being made in addressing the shortcomings identified earlier. Notably, this updated scorecard reveals that the fundamental orientation of Canadian financial regulation remains largely unchanged: stability and consumer protection continue to dominate (if anything, with a slight uptick), while considerations of dynamism, innovation, and competition remain on the back burner. To be sure, some rebalancing is emerging. Ad hoc initiatives – such as blanket orders, sandbox activities, and similar discretionary measures – have introduced some pockets of innovation and efforts to reduce administrative burden. Nevertheless, our main point persists: without a deeper shift in regulatory philosophy, such measures risk remaining isolated exceptions, rather than indicative of a broader shift.

To probe the core of Canadian regulators’ philosophy – and to test whether the observed regulatory imbalance is structural – the analysis is extended to include foundational documents that set out regulators’ objectives, mandates, and missions.5 Examining these texts allows for an assessment as to whether the current priorities are rooted in the very design and self-perception of regulatory institutions, rather than from recent or temporary policy choices. The results show a clear hierarchy of objectives in regulator mandates across the country, with stability and consumer protection firmly dominant. This stands in contrast to the mandates of regulators in the UK, Australia, and the US, where innovation and competition feature more prominently. Without a shift toward a more balanced regulatory philosophy, Canada risks falling further behind in competitiveness, innovation-driven growth, and overall economic resilience.

One consequence of this regulatory imbalance is the potential for disproportionate compliance costs – relative to benefits – being imposed on the financial sector. Hence, the third goal of the paper is to evaluate the cost side of cost-benefit analysis in regulatory decision-making. We do this by quantifying and identifying compliance costs imposed by financial regulations across different financial subsectors, with particular attention to varying firm sizes. By empirically assessing these costs, this study fills a critical gap in the literature, offering concrete evidence of how current regulatory frameworks affect businesses, especially smaller firms that may face a heavier burden. Our aim is to start a new, thorough, and reliable database that will create valuable insights for policymakers and regulators.

The first wave of results is concerning.

Although the benefits of regulation are difficult to measure, compliance duties are becoming increasingly embedded across most of the financial sector workforce. The share of labour and revenues devoted to compliance continues to rise – well above international counterparts – and the burden falls disproportionately on smaller firms. If left unaddressed, these asymmetric and rising compliance costs risk diverting skilled labour and capital away from core business functions, further undermining productivity, innovation, and the overall competitiveness of Canada’s financial sector.

2. The Updated Scorecard

2.1 Methodology

To update the regulatory scorecard, we employ the same textual and topic analysis framework as in the previous study (Bourque and Caracciolo 2024), applying it to newly issued and updated regulatory documents from the past year (June 2024 to June 2025) alongside previous documents. Our focus remains on key regulatory materials across the banking, insurance, pensions, and securities sectors, including Financial Services Regulatory Authority of Ontario (FSRA) Guidelines, Autorité des marchés financiers (AMF) Guidelines, Office of the Superintendent of Financial Institutions’ (OSFI) Guideline Impact Analysis (and related documents), and Canadian Securities Administrators’ (CSA) Companion Policies.6

Using natural language processing (NLP) techniques (see Bourque and Caracciolo [2024] for a more complete description), we extract and classify key terms, sentences, and logical arguments to assess how these documents address market failures (e.g., market abuse, asymmetric information, systemic and liquidity risk), policy objectives (e.g., stability, transparency, efficiency), and cost-benefit considerations.7 This allows us to evaluate the extent to which Canadian regulators align with the core principles of sound regulatory decision-making: problem identification, cost-benefit assessment, and clear articulation of objectives.

While the core methodology remains unchanged, this iteration refines our classification process.8 We will perform this update on an annual basis, allowing us to systematically track shifts in regulatory priorities over time. The full updated scorecard, which reflects these refinements and new findings, is presented in online Appendix C (Table 1).

2.2 Results

This updated regulatory scorecard reveals similar results as last year in Canadian financial regulation: the fundamental priorities of regulatory authorities have remained largely unchanged, with consumer protection, transparency, and stability dominating the regulatory agenda. Despite ongoing discussions about the need to stimulate economic growth in Canada, our analysis indicates that a more balanced approach to financial oversight, one that explicitly incorporates innovation and competition alongside these traditional goals, remains largely absent from newly issued and updated regulatory documents (evaluated alongside existing documents).

Most regulatory initiatives (approximately 92 percent versus 89 percent of last year) primarily target market abuse, stability, transparency, and, ultimately, improved consumer protection. On the other hand, a smaller fraction (around 14 percent, compared to 16 percent last year) explicitly aim to enhance efficiency, promote growth and innovation, and take into account the stability versus dynamism trade-off that is a critical part of any regulatory structure.

One notable exception among the newly analyzed documents is delivered by FSRA’s Guideline GR0014APP, which demonstrates a departure from the prevailing regulatory narrative. This document explicitly acknowledges the importance of fostering a more dynamic financial marketplace, introducing measures aimed at reducing barriers to entry and enhancing the competitive landscape.9 We also acknowledge that CSA’s National Instrument 81-101 Mutual Fund Prospectus Disclosure, which focuses on enhancing transparency and investor protection through standardized disclosure requirements, aims to simplify the disclosure procedure and, therefore, represents an important step forward in regulatory efficiency.

Beyond these individual measures, we note that FSRA and CSA have also set out broader ambitions. FSRA’s 2024–2027 Strategic Plan highlights burden reduction and regulatory efficiency, while CSA’s 2025–2028 Business Plan emphasizes internationally competitive markets and regulatory approaches that adapt to innovation and technological change. These commitments are commendable and encouraging, but they remain largely aspirational: they signal intent, but the challenge is whether they will translate into consistent features of day-to-day regulatory instruments. Our annual updated scorecard will be able to monitor this.

Breaking down our analysis to the single regulator level, FSRA stands out as the one that has gone furthest in bridging the gap between intentions and actions: around 17 percent of its analyzed documents now contain growth or innovation considerations (up from 13 percent last year). By contrast, CSA – which admittedly had the highest percentage last year – OSFI, and AMF remain closer to their prior levels, with innovation-oriented content in only 18 percent, 10 percent, and 10 percent of their documents, respectively. For now, the broader regulatory environment continues to disproportionately prioritize risk mitigation and consumer safeguards over fostering a more adaptive and competitive financial sector.

Moreover, and again consistent with last year, there is a dearth of explicit cost-benefit analysis or meaningful discussion of the broader economic costs imposed by the regulatory interventions across nearly all examined documents.10

3. Where Does This Imbalance Come From?

Our scorecard raises a fundamental question: is this imbalance an unintentional result, or does it reflect the regulators’ mandate and therefore a structural feature of Canada’s regulatory landscape? To answer this, we examined the mandates and missions of Canadian financial regulators (prudential and securities regulators alike). For the vast majority, dynamism, competition, and capital formation are typically only included following the mission statements – OSC being a notable exception. The primary focus of the mission statements remains on stability, investor protection, and market integrity, which are vital but fall short of capturing the full potential of a dynamic, innovative financial sector.

For example, OSFI’s mandate is to:

  • “ensure federally regulated financial institutions (FRFIs) and federally regulated pension plans (FRPPs) remain in sound financial condition;
  • ensure FRFIs protect themselves against threats to their integrity and security, including foreign interference;
  • act early when issues arise and require FRFIs and FRPPs to take necessary corrective measures without delay;
  • monitor and evaluate risks and promote sound risk management by FRFIs and FRPPs.”11

It is only after that that they say, “In exercising our mandate:

  • for FRFIs, we strive to protect the rights and interests of depositors, policyholders and financial institution creditors while having due regard for the need to allow FRFIs to compete effectively and take reasonable risks.”

To further substantiate this point, we look to see whether the secondary status of competition, cost, and innovation in Canadian regulators’ mandates is a uniquely Canadian phenomenon or part of a broader international pattern. Benchmarking against international best practices is particularly relevant in financial regulation, where peer jurisdictions face similar market dynamics and policy tradeoffs. By comparing Canada’s regulatory mandates to those of similar international counterparts, we can better assess whether the Canadian approach reflects a deliberate policy choice or a missed opportunity to align with evolving global standards.

As in the scorecard, we conducted a systematic textual analysis of the mandates and missions of major financial regulators in Canada, the UK,12 Australia,13 and the United States.14 Using natural language processing techniques, we extracted and quantified the most prominent themes and keywords in these foundational documents.15 The results are visually summarized in the accompanying wordclouds. The size of each word reflects its frequency and “keyness” – a measure of statistical importance and relevance within the analyzed texts. Unlike simple term frequency, this approach highlights the concepts and priorities regulators emphasize disproportionately relative to the overall corpus, providing a more nuanced quantitative assessment. The wordclouds thus offer an intuitive visual snapshot of the dominant regulatory themes.

What emerges from this analysis is a clear divergence in regulatory philosophy. The wordclouds for the UK and Australia show that terms such as “competition,” “growth,” and “cost” are extremely relevant in the language of their regulators’ mandates. This reflects an explicit and deliberate embedding of economic dynamism and efficiency into their regulatory objectives.

Indeed, the UK’s PRA and Australia’s APRA, while maintaining stability and consumer protection as core priorities, have made efforts to explicitly incorporate competition, innovation, and market adaptability into their mandates over the past decade (Figure 1). The PRA, for example, makes the case that long-term resilience requires a financial sector that is not only stable but also competitive, forward-looking, dynamic, and innovative. By integrating efficiency and market innovation, the PRA looks to ensure that the financial ecosystem can grow and evolve with emerging market demands.

Similarly, APRA’s mandate balances the primary objective of safety “with considerations of competition, efficiency, contestability (making barriers to entry high enough to protect consumers but not so high that they unnecessarily hinder competition) and competitive neutrality (ensuring that private and public sector businesses compete on a level playing field).”16

In contrast, the wordclouds for Canadian deposit-taking and insurance regulators reveal a notable absence of such language (see Figure 2 for OSFI, FSRA17, and AMF18). Their mandates and mission, while perhaps containing references to competition and growth, are dominated by terms like “stability,” “solvency,” “obligation,” and “consumer protection.”

This linguistic gap is not just cosmetic; it reflects a structural difference in regulatory philosophy. Without a formal mandate to consider competition or cost, many Canadian regulators have less incentive to systematically integrate these factors into their rulemaking.

A similar divergence is evident in securities regulation. The UK’s Financial Conduct Authority (FCA) and the US Securities and Exchange Commission (SEC) place competition, growth, dynamism, and capital formation at the centre of their regulatory mandates (Figure 3).19

These are not just theoretical differences. SEC’s statutory responsibility to facilitate capital formation led to a practical framework that drives policies to increase market access for a broader range of firms. The SEC has introduced initiatives such as Regulation A+ and crowdfunding exemptions, which aim to make it easier for small and emerging firms to raise capital while balancing investor protection. The FCA’s mandate similarly incorporates competition as a core principle, emphasizing measures to ensure that financial markets remain vibrant and responsive to technological progress, highlighting also how this, in turn, will increase investors’ welfare.

In contrast, although some of the largest securities commissions – such as the OSC, BCSC, and ASC – are notable exceptions, explicit competition or capital formation mandates are not necessarily the norm across our 13 provincial securities commissions, nor at the umbrella organization, the CSA (see Figure 4 for CSA’s wordcloud).20 The Ontario government did take a step in this direction in 2021, when it expanded the OSC’s mandate to include fostering capital formation and competition.

While investor protection and market integrity remain fundamental and essential objectives, the absence of a consistently clear directive to foster market dynamism means that regulatory actions are more likely to be slanted towards a more cautious, conservative approach. There have certainly been some targeted efforts to support innovation and broaden access to capital, such as the CSA’s Financial Innovation Hub21 and their harmonized crowdfunding rules, but these remain isolated and ad hoc. Unlike the systematic, mandate-driven commitment seen in the UK and the United States, Canadian initiatives are not consistently rooted in a formal regulatory priority to promote capital formation.

This regulatory gap is particularly concerning given Canada’s persistent struggles with weak productivity growth, poor investment, sluggish economic expansion, and relatively low levels of innovation adoption.22 A financial regulatory environment that does not explicitly encourage competition, innovation, and capital formation may reinforce these trends by raising barriers to entry, increasing compliance costs for smaller firms, and discouraging capital market participation, particularly from high-potential startups and emerging sectors. The absence of a statutory capital formation mandate within securities regulation means that new firms seeking to grow or disrupt established industries may face challenges in accessing the funding they need, further contributing to a stagnant market environment.

Modernizing the mandates of Canadian regulators to explicitly recognize the tradeoffs between stability, investor protection, and economic dynamism is an economic imperative. Without a shift toward a more balanced regulatory philosophy, Canada risks falling further behind in capital market competitiveness, innovation-driven growth, and overall economic resilience. Financial stability does not have to come at the expense of progress, and as other international regulators are trying to do, we should aim to achieve the best-designed regulatory framework in order to foster both stability and market growth. A more forward-looking mandate, in which competition, capital formation, and innovation are treated as integral to the health of the financial system, would not only strengthen Canada’s economic position but also ensure that its regulatory framework remains adaptable to future challenges and opportunities.

4. Neglected by Design: Quantifying the Costs of Regulation

A practical consequence of the imbalance in regulatory priorities are gaps in how cost-benefit analyses are designed and implemented in Canadian financial regulation. A further goal of this paper is to help push this issue ahead by developing a method for more accurately quantifying regulatory costs. The aim is to create a new, annually updated and survey-based cost database that provides a new lens on the regulatory burden and equips regulators with a tool to better understand the real impact of their activity across firms of different sizes and sectors. We acknowledge upfront that we focus specifically on the cost side of the analysis, leaving the benefits assessment to future work.

4.1 The Importance of Quantifying Regulatory Costs and the Difficulties Implied by the Task

The costs of regulations – across all industries, including financial services – are often cited as one of the biggest factors contributing to reduced market entry, increasing industry concentration, and weak investment. This pattern is evident worldwide, including in the United States and Canada (Gutiérrez and Philippon 2019, 2017), as well as in many other developed countries (Aghion et al. 2021). The mechanism postulated by the literature above is that compliance costs as a result of government regulations disproportionately impact small firms, creating barriers to new entrants, inhibiting business growth, and therefore ultimately slowing down productivity. Additionally, when large incumbents face increased regulatory costs, they either incur them, which may affect other parts of their business, or pass some of these costs on to consumers, especially if, given higher barriers, they end up possessing significant market power. As a result, consumers will also be adversely affected, which has broader implications for the overall economy.

The central issue remains the unresolved question of how to define and quantify the total compliance cost properly, as well as how to assess whether these costs affect small and large firms differently. Measuring compliance costs at the firm level is, in fact, a highly complex challenge from both qualitative and quantitative perspectives.

First, from a qualitative perspective, there is no unanimous agreement on which costs to include and how to model their impact on different firms. While some argue that the biggest part of compliance costs can be significantly decreased through economies of scale and lobbying, and therefore are much smaller for larger firms (Davis 2017; Alesina et al. 2018; Gutiérrez and Philippon 2019; Akcigit and Ates 2020; Aghion et al. 2021), others suggest that small businesses are, in fact, the ones in a better position, as they receive plenty of exemptions (Brock and Evans 1985; Aghion et al. 2021).23

Second, from a quantitative perspective, measuring firm-specific regulatory burdens presents numerous obstacles. Quantifying firm-level compliance costs is complex due to limited granular data. Existing studies often focus on broad relationships or industry-level shocks (Gutiérrez and Philippon 2019), lacking detailed evaluations of individual business burdens. These obstacles include variations in regulatory requirements across financial subsectors, overlapping regulations from different government levels, tiered compliance rules, varying inspection stringency, and differing technological and efficiency constraints across firm sizes (Agarwal et al. 2014; Stiglitz 2009; Kang and Silveira 2021; Goff et al. 1996). As Goff et al. (1996) noted, “the measurement problems are so extensive that directly observing the total regulatory burden is practically impossible.”

4.2 Modelling and Measuring Compliance Cost and Its Impact on Labour Productivity: Traditional Methods and Our Approach

Traditional approaches to quantifying the regulatory burden typically fall into two broad categories: counting the number of regulations in force or measuring the size of compliance departments within firms.24 The first approach, despite its widespread use, is simplistic and can be misleading. It assumes that each new regulation automatically adds the same weight to firms’ compliance burdens, failing, therefore, to account for differences in complexity, enforcement, and actual economic impact. Most importantly, it also disregards the fact that not all regulatory documents impose additional costs. Some provide clarifications, interpretation, simplify compliance procedures, or consolidate existing rules, thereby reducing uncertainty and making it easier for businesses to adhere to legal requirements. A regulatory framework with an extensive set of well-organized, clearly written guidelines can be far easier to navigate than a system with fewer but ambiguous or conflicting regulations. Yet, a raw count of regulations makes no such distinctions, treating all rules as equally burdensome and limiting insights into the real costs faced by businesses.

The second common approach – measuring the size of compliance departments – is somewhat more informative but still incomplete. This method operates on the assumption that regulatory costs can be estimated by looking at the number of employees explicitly assigned to compliance roles.25 While this metric does offer a tangible measure of firms’ direct expenditures on compliance, it fails to capture the reality that regulatory obligations extend far beyond dedicated compliance teams. In practice, firms cannot limit compliance tasks to a single department; employees across multiple functions – including finance, operations, and even customer service – must allocate significant portions of their work to meeting particular regulatory requirements. These responsibilities often divert employees from their core business functions, increasing operational complexity and reducing efficiency in ways that are difficult to measure using traditional methods.

The failure to account for these indirect costs leads to a fundamental misrepresentation of how regulatory compliance affects firms, particularly with respect to labour productivity. Standard measures of productivity typically calculate output per worker, assuming that all employee time is dedicated to value-generating activities. However, when employees across departments must dedicate significant portions of their time to compliance, their effective contribution to production decreases even if they are not officially counted as part of the compliance workforce. This distortion is particularly relevant in highly regulated industries, such as the financial sector, where firms must continuously adapt to evolving rules, engage in periodic audits, and maintain detailed reporting practices. These obligations consume work hours that could otherwise be devoted to innovation, strategic growth, or client service. By failing to account for these hidden labour costs, traditional approaches systematically underestimate the true economic impact of regulatory compliance.

Evidence in support of this argument comes from occupational data sources such as the US O*NET database, which provides firm-level insights into job responsibilities at the single-employee level across industries. These data reveal that compliance-related tasks affect, to different extents, most of the workers, and are not confined to designated regulatory personnel.26

A more accurate framework for assessing regulatory costs must therefore go beyond these limited proxies and capture the full extent of compliance-related labour reallocation. This is precisely what we try to accomplish with our project. Through detailed firm-level surveys, we collect data not only on compliance department size but also on how regulatory responsibilities are distributed across the entire workforce. By distinguishing between employees who are fully dedicated to compliance and those who must allocate a portion of their time to regulatory tasks, we can develop a more precise estimate of how compliance demands affect firms’ overall labour productivity and financial performance. Our approach, which we call the Compliance Labour Cost Index, allows us to measure variation in regulatory costs across firms of different sizes and financial subsectors, helping to assess whether burdens are proportionate or not.27

Furthermore, our survey methodology captures the evolution of compliance intensity over time. This paper presents the first wave of our survey, with our long-term goal being to conduct it every year, thereby creating a dynamic, up-to-date resource for understanding regulatory costs. By maintaining a consistent, structured approach to data collection, we will be able to track changes in compliance burdens over time, offering insights into whether new regulations are increasing costs, whether firms are finding more efficient ways to comply, and how regulatory expenses vary across different business models. This database will provide a clearer picture of regulatory costs at the firm level and also equip policymakers with the empirical evidence necessary to design smarter, more effective regulations – ones that balance economic growth with necessary oversight.

4.3 Survey Results

28

The results presented here are based on an unbalanced panel29 of survey responses covering three fiscal years: 2019, 2023, and 2024.30 This structure allows us to capture both pre- and post-pandemic conditions while filtering out the most acute COVID-19-related distortions in 2020, 2021, and 2022. The panel includes firms of varying sizes across the different subsectors of the Canadian financial sector, enabling both an aggregate view and size-based comparisons. The key findings from this survey can be grouped into four main observations, each highlighting a distinct aspect of the compliance burden.

Fact 1: Compliance is Everyone’s Job!

Compliance work is now deeply embedded across the financial sector workforce. In 2024, on average, 73 percent of employees had at least some compliance-related duties, and close to 8 percent spent the majority of their time (75–100 percent) on such tasks. As postulated in the previous sections, regulatory obligations are not confined to specialist compliance teams but are interwoven into the daily operations of most departments, diverting time and focus away from activities that directly generate value for clients or shareholders. The pervasiveness of compliance roles means that regulation is no longer something handled at the margins of the business, but rather a constant presence shaping workflows across the organization.

Fact 2: Compliance Is Eating Payroll – A Growing Regulatory Burden Is Reshaping Workforce Allocation

The share of total labour costs devoted to compliance-related activities (time and salaries spent meeting regulatory requirements rather than delivering core products or services) has been rising steadily. Our Compliance Labour Cost Index stood at approximately 16 percent in 2019, rose to around 19 percent in 2023, and reached 22 percent in 2024. To put it differently, around one dollar in every five spent on payroll is now directed to tasks that exist solely to ensure regulatory adherence. To put these figures in context, Trebbi et al. (2023), using US establishment-level O*NET data, estimate that regulatory compliance accounts for 2.3 percent to 2.7 percent of total labour costs across the US financial sector. This divergence highlights the crucial need for a more systematic cost-benefit approach in Canadian regulatory design. We simply cannot afford such a big gap.31

Fact 3: External Compliance Costs Are Also Surging, and Are Eating into Revenues

While internal labour costs capture the human effort behind compliance, they tell only part of the story. A significant (and growing) portion of the regulatory burden is channelled through external spending: advisory fees, legal fees, compliance technologies, governance structures, and membership dues. These costs are less visible but no less impactful, directly affecting firms’ bottom lines and reducing their strategic flexibility. To gauge both their scale and their evolution over time, we measure external compliance costs as a share of total revenues. We can observe how this ratio has risen steadily over the three years analyzed, climbing from about 1.2 percent in 2019 to 1.6 percent in 2024. The increase reinforces how compliance imposes a mounting financial strain beyond internal labour, diverting resources that could otherwise be invested in innovation, growth, and other productive initiatives.

Fact 4: Size Matters (a Lot!) – The Compliance Burden Hits Small Firms Hardest

A striking asymmetry emerges between small firms (under 100 employees) and large firms (over 100 employees).32 While the growth rate of compliance involvement and costs appears independent of firm size, their magnitude is not. In both 2023 and 2024, an average of 35 percent of workers in small firms had high or medium compliance involvement, compared with just 13 percent in larger ones.

As a natural consequence, smaller institutions shoulder significantly higher compliance costs: in 2024, the labour cost index reached 20 percent for small firms, compared with 12 percent for larger ones.

This imbalance is particularly worrying when we consider that small firms and startups are often the main engines of innovation, and as they grow, of productivity growth as well. Yet, these seem to be precisely the firms disproportionately drained by regulatory demands, risking a throttling effect on the dynamism and competitiveness of the entire financial sector.

In short, these facts require attention. Reassessing compliance costs must be an urgent priority on the regulators’ agenda, as it is essential to ensure the health and resilience of our financial sector.

5. Policy Discussion and Conclusion

The updated regulatory scorecard confirms that the core patterns identified in prior analysis persist. Canadian financial regulation continues to focus overwhelmingly on stability and consumer protection, while innovation, competition, and cost-efficiency remain secondary. This regulatory orientation is not just a product of recent policy inertia; it is deeply rooted in the structural design of mandates and institutional priorities. Current mandates apply a lexicographic hierarchy that prioritizes financial stability and consumer safeguards above all else – often at the expense of reducing unnecessary regulatory burdens and fostering economic dynamism and growth.

This imbalance is set to become an even greater challenge amid profound global shifts. Political instability in the United States, ongoing conflicts, and broader geopolitical tensions have created a more volatile and unpredictable environment. Stability will remain crucial, but Canada also has an opportunity to adopt regulatory frameworks that actively promote efficiency, innovation, and growth. With such elements in place, Canadian financial institutions can better thrive in a changing world while reinforcing the very stability regulators aim to safeguard.

The costs of the current imbalance are already evident. Evidence shows that compliance burdens are rising sharply, with significant implications for firms’ competitiveness. Our Compliance Labour Cost Index, which tracks regulatory labour across the sector, reveals that compliance demands grew from 16 percent of total internal labour in 2019 to 21 percent in 2024. The strain is particularly acute for smaller firms, where compliance costs reached 28 percent of payroll – double the share borne by larger institutions. External compliance expenses, including advisory, technology, and governance costs, have also grown, further restricting firms’ ability to invest in growth and innovation.

These findings show that stability-focused regulation, absent economic balance, can erode productivity, innovation, and long-term market vitality. Smaller firms are particularly vulnerable, even though they are central drivers of competition and innovation. Policy responses should therefore focus on two priorities.

First, regulatory mandates must be modernized to recognize the full set of policy objectives: stability, investor protection, efficiency, growth, and competition. Explicitly embedding economic goals alongside traditional safeguards would bring Canadian practice closer to international standards and create a more adaptive framework. Encouragingly, securities regulators in Ontario, BC, and Alberta, as well as Ontario’s provincial prudential regulator, FSRA, have already begun acknowledging this need in business plans that emphasize competitiveness and in guidelines aimed at reducing regulatory burden. Our scorecard will continue to track whether such commitments translate into practice.

Second, regulatory design should always require rigorous cost-benefit analyses that are made publicly available at the outset of rulemaking. Transparent, upfront cost-benefit analyses would establish clear benchmarks against which post-implementation reviews can be meaningfully conducted. Tools such as our Compliance Labour Cost Index can enrich this process of comparison. Institutionalizing public cost-benefit analyses would ensure that regulations are evaluated not only against their intended goals but also against their real-world economic costs, enabling more proportionate and adaptive policymaking.

In sum, safeguarding stability and protecting consumers remain essential. But stability itself increasingly depends on Canada’s ability to sustain competitive, innovative, and efficient financial markets.

The author extends gratitude to Pragya Anand, Angélique Bernabé, Ian Bragg, Jeff Guthrie, Sarah Hobbs, Jeremy Kronick, Peter MacKenzie, Grant Vingoe, Mark Zelmer, Tingting Zhang, and several anonymous referees for valuable comments and suggestions. The author retains responsibility for any errors and the views expressed.

For the Silo, Gherardo Caracciolo – C.D. Howe Institute.

REFERENCES

Agarwal, Sumit, David Lucca, Amit Seru, and Francesco Trebbi. 2014. “Inconsistent Regulators: Evidence from Banking.” The Quarterly Journal of Economics 129(2): 889–938.

Aghion, Philippe, Antonin Bergeaud, Timo Boppart, Peter J. Klenow, and Huiyu Li. 2019. “Missing Growth from Creative Destruction.” American Economic Review 109(8): 2795–2822.

Akcigit, Ufuk, and Sina T. Ates. 2020. “Ten Facts on Declining Business Dynamism and Lessons from Endogenous Growth Theory.” American Economic Journal: Macroeconomics 13(1): 257–298.

Alesina, Alberto, Carlo A. Favero, and Francesco Giavazzi. 2018. “What Do We Know about the Effects of Austerity?” American Economic Association Papers and Proceedings 108: 524–530.

Bourque, Paul C., and Gherardo Gennaro Caracciolo. 2024. The Good, the Bad and the Unnecessary: A Scorecard for Financial Regulations in Canada. Commentary 664. Toronto: C.D. Howe Institute. July. https://cdhowe.org/publication/good-bad-and-unnecessary-scorecard-financial-regulations-canada/.

Brock, William A., and David S. Evans. 1985. The Economics of Small Businesses: Their Role and Regulation in the U.S. Economy. New York: Holmes & Meier.

Davis, Steven J. 2017. “Regulatory Complexity and Policy Uncertainty: Headwinds of Our Own Making.” Brookings Papers on Economic Activity (Fall): 301–375.

Eichenbaum, Martin, Michelle Alexopoulos, and Jeremy Kronick. 2024. “Economists Must Convince the Public That Productivity Isn’t Just a Number.” The Globe and Mail. August 5. https://cdhowe.org/publication/eichenbaum-alexopoulos-kronick-economists-must-convince-public-productivity-isnt-just/.

Goff, Brian L., et al. 1996. Regulation and Macroeconomic Performance. Vol. 21. New York: Springer Science & Business Media.

Gu, Wulong. 2025. “Regulatory Accumulation, Business Dynamism and Economic Growth in Canada.” Analytical Studies Branch Research Paper Series, no. 481. Statistics Canada. February 10. https://doi.org/10.25318/11f0019m2025002-eng.

Gutiérrez, Germán, and Thomas Philippon. 2017. “Declining Competition and Investment in the U.S.” NBER Working Paper No. 23583. https://doi.org/10.3386/w23583.

_______________. 2019. “The Failure of Free Entry.” NBER Working Paper No. 26001.

Kang, Karam, and Bernardo S. Silveira. 2021. “Understanding Disparities in Punishment: Regulator Preferences and Expertise.” Journal of Political Economy 129(10): 2947–2992.

Restuccia, Diego, and Richard Rogerson. 2008. “Policy Distortions and Aggregate Productivity with Heterogeneous Establishments.” Review of Economic Dynamics 11(4): 707–720.

Robson, William B.P., and Mawakina Bafale. 2024. Underequipped: How Weak Capital Investment Hurts Canadian Prosperity and What to Do about It. Commentary 666. Toronto: C.D. Howe Institute. September. https://cdhowe.org/publication/underequipped-how-weak-capital-investment-hurts-canadian-prosperity-and-what/.

Stiglitz, Joseph. 2009. “Regulation and Failure.” In New Perspectives on Regulation, edited by David Moss and John Cisternino, 11–23. Cambridge, MA: The Tobin Project.

Trebbi, Francesco, Miao Ben Zhang, and Michael Simkovic. 2023. “The Cost of Regulatory Compliance in the United States.” USC Marshall School of Business Research Paper. January 15. https://doi.org/10.2139/ssrn.4331146.

Chief Economists Warn of Weak Growth as Economic Environment Shifts

中文 | 日本語 | Español 
Quick Takeaways
-72% of chief economists expect global economy to weaken in 2026 as disruptions in trade, technology, resources and institutions signal a shift to a new economic environment.
-Regional growth pathways are diverging: 56% anticipate greater divergence between advanced and developing economies, with MENA and South Asia emerging as bright spots.
-Debt risks are intensifying in advanced economies, with 80% of respondents expecting vulnerabilities to grow.


New York, USA, October 2025 – The global economy is entering a period of weak growth and systemic disruption, according to the World Economic Forum’s latest Chief Economists’ Outlook, published today. Some 72% of surveyed chief economists expect the global economy to weaken over the next year, amid intensifying trade disruption, rising policy uncertainty and accelerating technological change. The findings point to the emergence of a new economic environment shaped by persistent disruption and growing fragmentation.

 
Diverging Pathways in a Fragmented Global Economy
The Outlook highlights sharp regional fault lines. Emerging markets are anticipated to be the main engines of growth, with the Middle East and North Africa (MENA), South Asia and East Asia and Pacific seen as bright spots. One in three chief economists expect strong or very strong growth in these regions. The outlook for China is more mixed, with 56% of chief economists anticipating moderate growth, though deflationary pressures are expected to persist. Growth is expected to remain more stagnant in advanced economies. In Europe, 40% expect weak growth with fiscal loosening (74%) and low or moderate inflation (88%). In the United States [& Canada ed.], most chief economists (52%) anticipate weak or very weak growth and high inflation (59%) as monetary policy is loosened (85%).
 
The chief economists warn that advanced and developing economies are on increasingly divergent growth pathways – 56% expect greater divergence over the next three years.
 
Towards a New Economic Environment
Chief economists overwhelmingly agree that today’s disruptions are structural rather than cyclical. Large majorities anticipate long-term disruption in natural resources and energy (78%), technology and innovation (75%), trade and global value chains (63%) and global economic institutions (63%). This marks an important shift. The global economy is not so much weathering isolated shocks as realigning, raising the stakes for new forms of leadership, cooperation and resilience.
 
“The contours of a new economic environment are already taking shape, defined by disruption across trade, technology, resources and institutions,” said Saadia Zahidi, Managing Director, World Economic Forum. “Leaders must adapt with urgency and collaboration to turn today’s turbulence into tomorrow’s resilience.”
 
Trade Realignment, Fiscal Strain and Debt Risks
Structural shifts in the global economy are playing out most visibly in trade, fiscal policy and debt. Some 70% of surveyed chief economists rate the current level of trade disruption as “very high”, far above other domains of the economy, and over three-quarters also expect disruption to trade and global value chains to cascade into other domains. In financial markets and monetary policy, 45% of surveyed economists rate disruption as high or very high, yet only 21% expect it to last. Even so, while 52% see a major near-term crisis in advanced economies as unlikely, 85% warn that any shock could have wide systemic effects.
 
With global public debt levels mounting, the chief economists surveyed highlight that debt vulnerabilities, once largely associated with emerging economies, are increasingly centred in advanced ones – 80% expect risks in advanced economies to grow in the year ahead. Fiscal vulnerabilities are also more frequently identified among the top growth inhibitors in advanced economies (41%) compared to developing economies (12%).
Follow the Sustainable Development Impact Meetings 2025 here and on social media using #SDIM25.
 
About the Chief Economists’ Outlook
The report builds on extensive consultations and surveys with chief economists from the public and private sectors, organized by the World Economic Forum’s Centre for the New Economy and Society. The report supports the Future of Growth Initiative, aiming to foster dialogue and actionable pathways to sustainable and inclusive economic growth.
 
About the Sustainable Development Impact Meetings 2025
The Sustainable Development Impact Meetings 2025 takes place from 22 to 26 September in New York, bringing together over 1,000 global leaders from diverse sectors and geographies. Held ahead of the World Economic Forum Annual Meeting 2026, these meetings are part of the Forum’s year-round work to accelerate progress on the growth, resilience and innovation through multistakeholder dialogues and action. 

For the Silo, Jarrod Barker.

5 Tools to Facilitate the Management of your Business

Running a business can be a challenging task, especially when you are dealing with multiple tasks and responsibilities at the same time. Fortunately, many tools can help streamline your business operations and make management much easier. In this article, we will take a look at five such tools that can help you manage your business more efficiently.

  1. A personalized ERP

ERP stands for Enterprise Resource Planning, and you may opt for an ERP business application. It is a type of software that helps businesses manage their day-to-day operations by integrating and automating various business functions, such as finance, accounting, inventory, sales, and human resources, into a single system. ERP software provides real-time visibility into all business processes, enabling businesses to make informed decisions based on accurate data.

  1. Slack

Slack is a communication tool that helps teams collaborate more effectively. It allows you to create channels for different projects or teams, which you can use to share files, send messages, and hold virtual meetings. Slack integrates with many other tools, such as Trello and Google Drive, making it an ideal choice for businesses that rely on multiple tools for their operations.

  1. Google Analytics

Google Analytics is a powerful tool that allows you to track and analyze your website’s performance. It provides valuable insights into your website’s traffic, such as where your visitors are coming from, what pages they are visiting, and how long they are staying on your site. This information can help you optimize your website and improve your online presence.

  1. QuickBooks

QuickBooks is an accounting software that can help you manage your finances more effectively. It allows you to track income and expenses, create invoices, and manage payroll. QuickBooks also integrates with many other tools, such as Trello and Google Sheets, making it easy to manage your finances and other business operations from a single platform.

  1. HubSpot

HubSpot is an all-in-one marketing, sales, and customer service platform that can help you manage your business more efficiently. It includes a CRM (customer relationship management) tool, email marketing, social media management, and much more. HubSpot’s powerful tools can help you automate your marketing and sales processes, and improve your customer engagement.

  1. Trello

Trello is a project management tool that helps teams collaborate and stay organized. It is a visual tool that lets you organize your projects into boards and lists, with cards for each task. You can assign tasks to team members, set due dates, and track progress. Trello is great for managing projects of all sizes, from small tasks to large, complex projects.

Managing a business can be overwhelming, but with the right tools, it can be much easier. ERP, Trello, Slack, Google Analytics, QuickBooks, and HubSpot are just a few of the many tools available that can help you manage your business more efficiently.

By using these tools, you can streamline your operations, improve communication, track performance, manage finances, and much more. So, give these tools a try and see how they can help you manage your business more effectively. For the Silo, Bill Gordon.

Why Getting A Business Off The Ground Takes Guts

Being an entrepreneur is a calling for those who not only cope well with risk, but thrive on the challenges it presents. Those who are satisfied by the comfort of a secure job and a steady paycheque need not apply.

It’s an idea that has crossed the minds of virtually everyone who has worked for somebody else, regardless of the job.

As you put in time and labour that ultimately benefits someone else’s business, it dawns on you: Why can’t I just set up shop and do this myself? Why can’t I be the one taking home the big money after all the bills are paid and enjoying the independence of running my own show?

They’re great questions, but the answers aren’t for everybody.

Actually making the decision to give up the security of a steady job, and the regular paycheque and benefits that come along with it, takes a lot of guts and perseverance — especially in today’s highly competitive economy.

Unless you are among the fortunate ones backed by deep resources, the bottom line is this: when you first set out to become an entrepreneur, you are truly on your own. It’s just you and your idea. And it will be the marketplace — relentlessly detached and unemotional — that determines whether you make it or not.

Budding entrepreneurs who do take the risk to start up their own business generally face two key barriers — capital and human resources.

Many entrepreneurs owe their initial success to the trust of friends and family members, who invest funds in their start-up idea. These types of loans can be troublesome if the proper precautions aren’t taken. Make certain the terms of all loans from friends or relatives are spelled out clearly in a promissory note prepared by a lawyer. You may not be dealing with a bank or a financial institution, but you have to treat repayment in the same manner to avoid conflict with your lenders, who also may happen to be your best friend or your sister.

It’s also important to keep your credit record as clean as possible and establish a line of credit, which you can access for instant cash flow at certain times.

Start-ups are limited to hire only the personnel who they can afford, which often means running on a skeleton staff who may not necessarily be those with the greatest skills and experience. This is why most of us who have conceived what we think is a great idea for a business usually choose too much of the work ourselves and wear many hats in the early days.

It can take a long time to find the right employees when you’re just starting out. Some of the top talent may be reticent to work for a small start-up because they are worried about how it will look on their resume, job security or getting a bigger paycheque.

You need to find candidates who share your entrepreneurial spirit and aren’t averse to taking risks. Look for people who want get in on the ground floor and grow with the business.

As you build your company and expand your market, it’s tremendously important to have a network of mentors whose advice and counsel you trust. No matter how much thought and preparation you put into your business plan, you won’t be able to anticipate everything ahead of you. The marketplace is constantly moving and evolving, causing you and your business to adapt. This is where mentors can help, offering guidance drawn from experiences they had during similar changes in their own journeys.

My own mentors have changed as my career progressed, but they all had a common trait that served me and my businesses well — perspective. They have been able to see things clearly from a distance when my own vision may have been clouded by emotion, allowing me to make more-effective decisions. Entrepreneurship is about taking chances, but not blind ones.

Being an entrepreneur is a calling for those who not only cope well with risk, but thrive on the challenges it presents. Those who are satisfied by the comfort of a secure job and a steady paycheque need not apply. For the Silo, Paola Abate.

No Federal Budget Until Fall? Canada Spending Lots In Meantime

The Fiscal Update the Government Should Have Produced and the Budget Canada Needs

by William B.P. Robson, Don Drummond and Alexandre Laurin

Introduction: No Budget, No Plan

The federal government has said it will not release a budget until the fall. Delaying a budget until the fiscal year is more than half over is never good, but Canada’s current high spending trajectory makes this delay especially bad. The government is making costly commitments without showing us the key numbers: how much more tax it expects to collect; how far its new spending will exceed its revenues; and what the resulting higher deficits imply for interest costs and our debt burden.

To fill in at least some of the information the government should be providing, we present our own fiscal update: the outlook that provides a context for the next federal budget. We then discuss possible measures the next budget could contain to address runaway spending, perpetually high deficits and debt, and vulnerabilities Canada should avoid at a time of severe economic challenge.

A Deteriorating Fiscal Outlook

To calculate the federal government’s bottom line in the current fiscal year, 2025/26, and the three following years, we followed the steps summarized in Table 1 (on page 3):

  1. We started with the Liberal Party’s costing document for its election platform (Liberal Party of Canada 2025). Based on a March 2025 economic scenario from the Parliamentary Budget Office (PBO), it did not reflect the impact of US tariffs or Canada’s countermeasures (PBO 2025).
  2. We updated the economic assumptions based on the Bank of Canada’s April 2025 Monetary Policy Report, using the more optimistic of the two scenarios examined by the Bank, both regarding the severity of tariffs and resulting economic damage (Bank of Canada 2025).
  3. We calculated a revised baseline fiscal projection by including policy initiatives that appear firm – either because of definitive statements, such as the cancellation of the proposed changes to capital gains taxation and the June 2025 plans to first accelerate defence spending to 2 percent of GDP and then gradually increase it to 5 percent by 2035, or because legislation is currently before Parliament, as is the case for cuts to the bottom personal income tax rate, the GST break for first-time homebuyers under Bill C-4,1 and the government’s announcement that it will not proceed with the digital services tax (DST).
  4. We added the spending measures from the Liberal platform’s costing document that were not included in the previous step.
  5. We added platform proposals for increasing revenue from higher fines and penalties and, more significantly, for reducing spending through a review of public sector operations to boost productivity. We show these as a memo item, since the lack of concern about the bottom line evident in the platform and subsequent announcements, and the lack of urgency evident in the government’s decision to delay the budget, makes it reasonable to doubt that these savings will materialize.

The resulting bottom line represents a marked deterioration, as Table 1 shows. As recently as the April 2024 budget, the government projected the deficit to decline to $20 billion by 2028/29.2 With this baseline, and even if the imagined fines and savings were realized in full, the deficit that year would be more than three times that level. Even in this optimistic scenario, the deficit would average $78 billion annually over the four years, and the net debt-to-GDP ratio would remain stable around the elevated level of 2025/26. Excluding the speculative savings, the cumulative deficit would be almost $350 billion over four years – or an annual average of $86 billion – and the net debt-to-GDP ratio would increase to 44 percent. Further, the baseline deficit without any of the non-implemented initiatives in the electoral platform is still elevated at $66 billion per year on average.

These projections include our estimates of the potential impact of the new defence spending commitments made at the recent NATO summit. At that summit in The Hague, Canada joined a pledge to raise defence and security-related spending to 5 percent of GDP by 2035 (3.5 percent for direct military needs and 1.5 percent for security-related investments).

No details on the year-to-year increases have been announced, but countries are expected to submit multi-year roadmaps by mid-2026. Prime Minister Mark Carney also indicated that some of the 1.5 percent for security-related investments – such as critical mineral infrastructure, ports, telecommunications, and cyber – could be counted from existing budget envelopes.

In Table 2, we present a hypothetical scenario where annual defence spending rises gradually from 2 percent of GDP to 5 percent of GDP over 10 years, with half of the spending allocated to depreciable capital assets. Under this scenario, we estimate the increase would add $2.3 billion to the deficit this fiscal year, rising to $11.8 billion in four years. Assuming half of the new spending on security-related investments comes from existing envelopes, the deficit would be $17.8 billion higher in four years. These amounts continue to grow over the 10-year period as the 5 percent target approaches and the stock of amortized capital outlays increases. By year 10, new defence commitments could add a staggering $68.4 billion to the deficit under this scenario.

Separating Operating and Capital Spending is Unhelpful

The large deficits projected in this update cannot be downplayed or disguised by dividing the budget into two new categories – operating and capital – and targeting a balanced operating budget only, as proposed in the election platform. No firm details have been released about what each category will include, but logically, the operating budget will consist of whatever does not fall under the new capital category.

The rationale for introducing a capital budget is unclear. Under Public Sector Accounting Standards, the federal government, like all Canadian governments, uses accrual accounting. So its capital costs are amortized over the useful life of the assets. As a result, the government’s Statement of Operations already shows costs related to capital investments: depreciation (about $7 billion per year) and interest on debt incurred when the outlays occur. As more capital assets are added – such as ports or defence equipment – amortization expenses will rise. But amortization reflects the current consumption of capital assets and should remain part of the bottom line. Excluding it would disconnect the federal budget presentation from the audited financial statements – a serious blow to transparency and accountability.

More troubling is the pledge to recharacterize as capital spending “new incentives that support the formation of private sector capital (e.g., patents, plants, and technology) or which meaningfully raise private sector productivity” (Liberal Party of Canada 2025). Governments like to call many categories of spending “investment.” Would the new classification mean the government would exclude subsidies for housing construction or incentives for first-time homebuyers from the bottom-line target? Would it reclassify other subsidies – for clean technology, artificial intelligence, or training programs, for example – as capital? What qualifies as capital under this framework appears open to subjective interpretation, undermining accountability. Without clear standards audited by independent sources, this approach is ripe for abuse.

And for what purpose? The government appears intent on showcasing how much it is doing for growth. But this does not require a new accounting convention. Their efforts could be highlighted through words and dedicated tables – not by altering the definition of the bottom line.

What Canada Needs in the Next Federal Budget

Notwithstanding rhetoric about transforming Canada’s economy in the face of US trade threats and prioritizing growth, federal fiscal policy and promises do not support the transformation of Canada’s trade relations or promote investment over consumption. Adding $300 billion in federal debt while doing nothing to raise investment and productivity will make Canada more vulnerable, not less. The new 5-percent defence commitment, even if its fiscal impact will be felt mostly in the later years, further highlights the need for difficult tax and spending trade-offs. Given the scale of the new defence commitment, on top of the fiscal challenges created by the old one, it is all the more important for the government to ensure proper accountability.

For that reason, the next federal budget – which should come as soon as possible – should have the following features:

  1. Dropping more costly platform initiatives. Recent developments, including diminished US support for environmental action and related impacts on Canada, suggest that some potential spending items may cost less or be delayed. Still, it seems surreal to contemplate introducing another $28.3 billion in deficit-increasing platform measures this fiscal year, when the projected deficit would already be close to $60 billion. One of the more straightforward options for the government in the 2025 budget is to forgo implementing some of its platform commitments or fund them through existing envelopes. The list is extensive. For example, the platform proposes to allocate over $10 billion to various infrastructure transfer funds, including nation-building initiatives, trade corridors, digital infrastructure, rural transit, critical healthcare, and community development. In addition, more than 64 small-scale platform measures, each costing under $200 million, collectively amount to over $3.1 billion. These areas clearly present opportunities for reallocation or funding within existing envelopes.
  2. Finding deeper savings from existing operating spending. The C.D. Howe Institute’s 2025 Shadow Budget contemplates $97 billion in non-defence direct program expense savings over the budget horizon (Robson, Drummond, and Laurin 2025). Such savings are possible, but not achievable without strong leadership from the very top.
  3. Rely more on less damaging taxes. Canada’s personal income tax rates are already high – the top rate is over 50 percent in most provinces – and our corporate income taxes are uncompetitive, undermining the investment we need to become more productive and raise workers’ wages. Those rates should come down: if the federal government is determined to fund spending that requires higher revenues, the least damaging option is to raise the GST rate, as proposed in the Institute’s Shadow Budget.
  4. Cut federal transfers to provinces and territories. The Institute’s latest Shadow Budget also proposed cuts to transfers that fund programs that are not in the federal government’s jurisdiction (Robson, Drummond, and Laurin 2025). Provinces and territories would not welcome such a move – indeed, many might raise their own consumption taxes in response – but deficit-financed federal transfers are less consistent with fiscal sustainability and accountability than tax-financed ones, and the Canadian federation will be healthier if provinces and territories become more fiscally self-sufficient.

The Need for Clarity and Serious Choices

It is widely accepted that Canada’s economy is at a critical crossroads. So are Canada’s public finances. Beyond the economic drag of high deficits and rising debt, it is unfair to pass these burdens onto the current young and future generations.

The fact that the 2025/26 Main Estimates are before Parliament does not mean that the government has made itself accountable to the legislature for its fiscal plans.3 The Estimates support the appropriation bills through which Parliament authorizes funding for program spending not already provided for in existing legislation. They exclude any forward-looking policy initiatives typically included in a budget. They omit revenues and only account for a subset of expenses. They are prepared on a different basis of accounting than regular budgets and financial statements, making direct comparisons difficult. And they cover only a single fiscal year, making it impossible to assess the medium-term outlook.

The federal government itself should release full economic and fiscal projections to enable a proper national debate. But in their absence, this informal update will have to suffice.

Canada is on a troubling path. We need Parliament and the public to discuss the best way forward – economically and fiscally. The next federal budget should launch us on that path.

The authors extend gratitude to Colin Busby, Jamie Golombek, John Lester, Daniel Schwanen, and several anonymous referees for valuable comments and suggestions. The authors retain responsibility for any errors and the views expressed.

References

Bank of Canada. 2025. Monetary Policy Report. April. Ottawa: Bank of Canada. https://www.bankofcanada.ca/publications/mpr/mpr-2025-04-16/.

Leach, Cynthia, and Salim Zanzana. 2025. “What does greater defence spending mean for Canada’s economy?” RBC Economics. June 13. https://www.rbc.com/en/thought-leadership/economics/featured-insights/what-does-greater-defence-spending-mean-for-canadas-economy/.

Liberal Party of Canada. 2025. Canada Strong: Fiscal and Costing Plan. April. https://liberal.ca/wp-content/uploads/sites/292/2025/04/Canada_Strong_-_Fiscal_and_Costing_Plan.pdf.

Office of the Parliamentary Budget Officer (PBO). 2025. 2025 Election Proposal Costing Baseline. Office of the Parliamentary Budget Officer. March 24. https://www.pbo-dpb.ca/en/additional-analyses–analyses-complementaires/BLOG-2425-011–2025-election-proposal-costing-baseline–cout-mesures-proposees-pendant-campagne-electorale-2025-prevision-reference.

Robson, William B.P., Don Drummond, and Alexandre Laurin. 2025. Putting Canada’s Economy First: The C.D. Howe Institute’s 2025 Shadow Budget. Commentary 679. Toronto: C.D. Howe Institute. March. https://cdhowe.org/publication/putting-canadas-economy-first-the-c-d-howe-institutes-2025-shadow-budget/.

Sourang, Diarra. 2023. Digital Services Tax. Legislative Costing Note. Ottawa: Office of the Parliamentary Budget Officer. October 17. https://www.pbo-dpb.ca/en/publications/LEG-2324-013-S–digital-services-tax–taxe-services-numeriques.

This article courtesy of our friends at www.cdhowe.org The Fiscal Update the Government Should Have Produced and the Budget Canada Needs for The Silo by William B.P. Robson, Don Drummond and Alexandre Laurin.

8 “Canadian” Companies Quietly Owned by Foreign Investors

Our friends at MSN have really stirred the maple syrup pot up with this story- which one of the following companies is the most surprising for you? Leave us a note in the comments section at the bottom of the article.

Many beloved Canadian brands that fill shopping carts and homes across the country have something surprising in common—they’re actually owned by foreign investors and companies. Behind familiar logos and proud Canadian histories stand international corporations that have quietly acquired these businesses, often maintaining their strong local identity while decisions are made overseas.

This eye-opening list reveals 8 well-known Canadian companies that now operate under foreign ownership.

While these businesses still employ thousands of Canadians and remain important parts of communities nationwide, their profits and major corporate choices flow to boardrooms in places like the United States, Europe, and Asia. Each example shows how Canada’s business landscape has evolved in today’s global economy.

Tim Hortons

©Image credit: “Tim Horton’s” by EazyIanish is licensed under CC BY 2.0. To view a copy of this license, visit https://creativecommons.org/licenses/by/2.0/?ref=openverse.

A Canadian fast-food icon, Tim Hortons has been owned by Restaurant Brands International since 2014, with its headquarters in Toronto but major control from Brazil-based 3G Capital. The beloved coffee chain started in Hamilton, Ontario in 1964 as a single donut shop. Today, it serves millions of customers daily across Canada and has expanded into 14 countries. The Brazilian investment firm maintains the Canadian feel of the brand while pushing for global growth.

Hudson’s Bay Company

©Image credit: “Hudson’s Bay Company store, Montréal, South view 20170410 1” by DXR is licensed under CC BY-SA 4.0. To view a copy of this license, visit https://creativecommons.org/licenses/by-sa/4.0/?ref=openverse.

Hudson’s Bay Company, founded in 1670, is now owned by American businessman Richard Baker’s NRDC Equity Partners. The historic retailer shifted from Canadian ownership in 2008 through a $1.1 billion deal. HBC continues to operate The Bay stores across Canada while managing an extensive real estate portfolio. The company maintains its Canadian identity despite being controlled from south of the border.

Cirque du Soleil

©Image credit: “Cirque du Soleil” by _nadya is licensed under CC BY-NC 2.0. To view a copy of this license, visit https://creativecommons.org/licenses/by-nc/2.0/?ref=openverse.

The Montreal-based entertainment company, famous for its artistic circus shows, was acquired by TPG Capital, a U.S. private equity firm, in 2015. Following financial difficulties during the pandemic, ownership changed again in 2020 to a group including Catalyst Capital Group. The company still creates its shows in Montreal. The creative spirit of Cirque remains distinctly Quebec-based despite foreign investment control.

Canada Goose

©Image credit: Tima Miroshnichenko/Pexels

The luxury winter coat maker, started in Toronto in 1957, sold a majority stake to U.S.-based Bain Capital in 2013. The company continues to manufacture its core products in Canada, maintaining its made-in-Canada promise. The brand has expanded globally under foreign ownership while keeping its Canadian headquarters. The international success of Canada Goose proves that Canadian craftsmanship can thrive under foreign ownership.

Rona

©Image credit: “2013_03_20” by Dennis S. Hurd is marked with CC0 1.0. To view the terms, visit https://creativecommons.org/publicdomain/zero/1.0/?ref=openverse.

The Canadian hardware retailer Rona underwent major ownership changes in recent years. After operating independently for decades, the Quebec-based chain was acquired by U.S. home improvement leader Lowe’s in a $3.2 billion deal completed in 2016. However, Lowe’s ownership proved relatively short-lived. In 2023, the American retailer divested Rona, selling it to Sycamore Partners, a private equity firm headquartered in New York, for $2.4 billion. Despite these corporate transitions, Rona maintained its distinct brand identity in the Canadian home improvement marketplace.

St-Hubert

©Image credit: Viridiana Rivera/Pexels

Ontario-based CARA Operations (now Recipe Unlimited) purchased Quebec’s St-Hubert restaurants for $537 million in 2016. The restaurant chain, founded in Montreal in 1951, maintains its distinct Quebec identity. Multiple foreign investment firms hold significant stakes in Recipe Unlimited through the parent company MTY Food Group. The company continues operating across Quebec while major business decisions are made outside the province.

Westjet

©image Credit: Justin Hu on Unsplash

In 2019, Toronto-based Onex Corporation acquired Westjet for $5 billion, with significant backing from international investors and foreign private equity firms. The airline maintains its headquarters in Calgary and continues operating as a Canadian carrier. Major foreign institutional investors hold substantial positions through Onex Corporation. While preserving its Canadian operations, the company’s ownership structure includes significant international investment.

Petro-Canada Stations

©Image credit: “Petro-Canada gas station, Eglinton Avenue West and Avenue Road (6035679276)” by Toronto History from Toronto, Canada is licensed under CC BY 2.0. To view a copy of this license, visit https://creativecommons.org/licenses/by/2.0/?ref=openverse.

Suncor Energy owns Petro-Canada stations, with significant foreign institutional investors holding major stakes. The company merged with Suncor in 2009 in a $19 billion deal. Petro-Canada remains a prominent Canadian retail fuel brand. International investment firms hold substantial voting shares in the parent company.

Shoppers Drug Mart

©Image credit: “Shoppers Drug Mart Store Canada” by bargainmoose is licensed under CC BY 2.0. To view a copy of this license, visit https://creativecommons.org/licenses/by/2.0/?ref=openverse.

Loblaw Companies Limited, a Canadian company, acquired Shoppers Drug Mart in 2014 for $12.4 billion. Despite its Canadian roots, the pharmacy chain has significant foreign institutional investment. Under this foreign ownership, Shoppers Drug Mart continues to expand its healthcare services across Canada.

Featured image/ ©Image credit: Erik Mclean/Pexels

What Can Be Done About Canada’s Debt Problem?

Presenters at last year’s C.D. Howe Institute’s conference on Canada’s debt problem had some pointed advice for our federal and provincial governments:

  • Canada’s public debt should be reduced about 10 percentage points of Canada’s GDP to ensure fiscal policy can be used to cushion the effects of future economic crises. Since major crises happen frequently, prudence suggests that the target should be achieved before the decade is out.
  • Tax increases harm economic performance, so elimination of public spending that does not provide enough benefits to offset this damage should be the first step in reducing deficits and debt. This will require undertaking comprehensive value-for-money assessments to identify wasteful spending.
  • Post-conference analysis found that achieving this prudent debt target would require increasing the combined federal-provincial primary balance by 1.4 percent of GDP, or $43 billion, starting in 2025/26. This amount includes a buffer – ensuring an 80 percent probability of meeting the debt target – to account for inevitable economic downturns, other crises that raise deficits and debt, and the uncertainty posed by fluctuating interest rates on financing costs.
  • The conference was one of four on deficits and debt held in Canada over the past 40 years. A clear and consistent message from these conferences – which politicians have yet to fully absorb – is that debt has economic costs and, therefore, imposes a burden on future generations. In this Commentary, the authors report on, and offer their analysis of, the findings of the latest conference.

Introduction

Does Canada have a debt problem? The answer from a recent C.D. Howe Institute conference is a resounding “yes.” Canada’s public debt should be about 10 percentage points of GDP lower to ensure sustainability. Given that major crises, which put upward pressure on deficits and debt, happen frequently, this target should be achieved before the decade is out.

The May 2024 conference was one of four on deficits and debt held in Canada over the past 40 years. Each aimed to provide guidance to policymakers on managing deficits and debt. While a common thread was concern about the economic cost of public debt, each conference provided context-specific policy advice.

The first conference, “Deficits: How Big and How Bad?” (Conklin and Courchene 1983), occurred when debt levels were rising rapidly but still relatively low. The key policy issue then was whether fiscal consolidation or expansion to support the economy was appropriate.

In the 1994 conference, “Deficit Reduction – What Pain, What Gain?” (Robson and Scarth 1994), and the 2002 conference, “Is the Debt War Over?” (Ragan and Watson 2004), there were clear recommendations to reduce debt levels. In 1994, this was motivated by concerns over economic damage caused by debt approaching 100 percent of GDP and questions about fiscal sustainability. By 2002, although the debt ratio had fallen substantially, further debt reduction was still advocated to reduce the burden on future generations who will not benefit from the spending.

A combination of discretionary measures and sustained economic growth led to a substantial reduction in the combined federal-provincial debt ratio from 2002 until the global financial crisis of 2007-2009. The debt ratio stabilized at a relatively high level after the crisis until the pandemic. The massive increase in debt during the pandemic and subsequent government spending raised the overall federal-provincial net debt ratio to about 75 percent of GDP, nearing levels from the time of the “Debt War” conference. This surge, combined with concerns about further increases, refocused attention on debt sustainability. This concern was reflected in the May conference, “Does Canada Have a Debt Problem?”, which recommended a debt target based on the need for fiscal prudence.

The latest conference included sessions on the economic costs of debt, the sustainability of federal debt, guidance for policymakers on a prudent and fair debt target, and reforming the federal fiscal framework. However, given the one-day format, not all issues could be thoroughly addressed. This report not only summarizes the proceedings but also fills some gaps by providing additional analysis to complement the presenters’ advice.

Economic Costs of Public Debt

Interest expenses were central to the analysis by University of Calgary economist Trevor Tombe of the economic costs of public debt. Interest paid on the public debt is often considered a transfer among individuals with no real impact on the economy. However, higher interest payments for a given level of program spending necessitate higher taxes, which harm economic performance by affecting incentives to work, save and invest. If not financed by tax increases, higher interest payments will crowd out valued program spending.

When discussing the opportunity cost of interest payments – the benefits of lower tax rates or higher program spending – Tombe cited work by Dahlby and Ferede (2022). They estimate the economic cost of raising an extra dollar of tax revenue, referred to as the “marginal cost of public funds” (MCPF). The MCPF includes both the dollar taken from the private sector and the loss in output per dollar of tax revenue raised due to reduced incentives to work, save and invest. Higher taxes shrink the tax base not only because of reduced economic activity but also due to efforts to reduce taxable income without changing economic behaviour.

Dahlby and Ferede (2022) find a very high cost from raising taxes. For the corporate income tax, the federal MCPF in 2021 was approximately two.1The MCPF from raising the top federal personal income tax rate has been higher than its corporate tax counterpart since 2012, when the corporate tax rate was reduced to 15 percent. The gap increased in 2016 when the top federal marginal personal income tax rate increased to 33 percent, pushing the MCPF to about 2.9.

The federal government expects to pay $54.1 billion in public debt charges in the current fiscal year. The economic cost of these payments is substantial. If the opportunity cost of these payments is lower corporate income taxes, their economic cost would also be about $54 billion. If their opportunity cost is a lower top personal income tax rate, their economic cost would exceed $100 billion. If the contribution from corporate income and top personal income tax were equal, the economic cost would be about $75 billion.

Other costs of public debt arise from a reduction in the national savings rate, which is the sum of public and private sector savings rates. Government deficits represent public sector dissaving, so with a constant private savings rate, national savings will decline when governments run deficits. Tombe highlighted the impact of lower national savings on investment, presenting data showing a negative correlation between debt ratios and investment ratios across countries (Figure 1). He stated there is “probably” a causal relationship between higher debt ratios and lower investment ratios.

Although Tombe did not elaborate, there are reasons to be circumspect about asserting causality. One reason is that the private savings rate may rise in response to budget deficits if economic agents anticipate higher future taxes to service the debt. Households might increase savings in anticipation, partially offsetting the decline in national savings. There is evidence that expansionary fiscal policy is partially offset by increased household savings. Johnson (2004) concluded that household savings would increase by 30-50 percent of the increase in government debt. In a recent study of fiscal expansions in the Euro area from 1999 to 2019, Checherita-Westphal and Stechert (2021) found that 19 percent of a fiscal stimulus is offset by higher household savings in the short-term, rising to 41 percent in the long-term.

Another reason for being cautious about inferring causality is that in an open economy, a decline in national savings does not necessarily lead to lower domestic investment, as any shortfall can be offset by borrowing from abroad. However, interest payments on borrowed funds and the return on foreign-owned capital reduce national income. An additional cost arises because the resulting current account deterioration must be offset by higher net exports, which requires a reduction in real wages in the export sector.

To complement Tombe’s analysis, we present an estimate of the economic cost of reduced national savings. In a closed economy with constant household savings, a budget deficit leads to a dollar-for-dollar crowding out of investment. Using historical returns on capital and assuming that national savings decline by 60 percent of the deficit due to offsetting increases in household savings, the $1,372 billion in federal net debt in the current fiscal year would have an economic cost of about $90 billion.2 This calculation does not capture the impact of lower capital intensity on productivity, so it underestimates the true cost.

If foreign savings offset the decline in national savings and foreigners invest directly in Canada, they receive the return on this capital, so the gross economic cost remains the same. However, the return is subject to corporate income tax, so the net economic cost would be about 25 percent lower. If Canadian firms borrow abroad to finance domestic investment, the economic cost is the interest paid to foreigners. While gross interest payments to foreigners will be less than the return on capital unless there is a large country-risk premium, interest payments are taxed more lightly.3 Therefore, the net economic cost may not differ substantially.

An additional cost of accessing foreign savings arises because higher capital servicing charges put downward pressure on the current account balance, which must be offset by an increase in net exports. In a small economy, export and import prices are determined in world markets, so the increase in net exports requires a decline in real wages in the export sector. However, if a country’s exports have unique features, increased supply can lower export prices, adding to the economic cost of borrowing from abroad (Burgess 1996).

Calculating the economic cost of investment crowding out when foreign borrowing is possible as the net-of-tax return on capital paid to foreigners establishes a minimum cost because it excludes the reductions in real wages required to increase net exports. The minimum cost would, therefore, be 0.75 x $90 billion = $68 billion, where the $90 billion reflects the economic cost of lower investment, adjusted by a factor of 0.75 to represent corporate income taxes on the returns paid to foreign investors. The $75 billion cost associated with raising taxes to finance higher federal interest expenses does not change with the availability of foreign financing, so the overall cost of the federal debt is approximately $142 billion, or 4.7 percent of GDP in 2024/25.

A similar calculation can be performed for overall provincial debt. In 2021/22, provincial net debt amounted to $784.7 billion, with debt service charges of $30.6 billion. Using the same weighted average economic cost of taxation as for the federal government, the economic cost of provincial debt service charges was $42 billion. The cost of investment crowding out adds another $39 billion, bringing the total cost of debt at the provincial level to $81 billion, or 3.2 percent of GDP in 2021/22. Assuming provincial debt remains at the same percentage of GDP from 2021/22 to 2024/25, the overall cost of Canada’s debt is about 8 percent of GDP.

Benefits of Debt and Its Optimal Level

Tombe also discussed the benefits of public debt, noting its role in financing long-lived assets, stabilizing the economy and smoothing tax rates over time. Governments should borrow to finance investments that will benefit future generations and should finance current expenditures out of current taxes. Spending on education, health and knowledge creation raises special concerns because it benefits both current and future generations. However, since each generation must make these investments, financing them through current revenues typically aligns with the benefit principle.

Counter-cyclical fiscal policy enhances social well-being by mitigating costly deviations from full employment. Additionally, governments can reduce the harmful effects of distortionary taxes by keeping them stable. Since the efficiency cost of taxes is higher when rates are above average than when rates are below average,4 governments should set tax rates at levels sufficient to support expected spending over the cycle and allow deficits to rise and fall in response to unexpected expenditures.5

An issue absent from discussions at the conference was the role of public debt in addressing market imperfections, which can improve efficiency. One such imperfection is the lack of adequate insurance markets against individual-specific wage income losses. As a result, individuals “self-insure” by increasing savings, which is more costly than paying the premiums in a well-functioning insurance market. Public debt puts upward pressure on interest rates and provides a safe savings instrument, allowing households to reduce their savings closer to the efficient level.

Unlike the efficiency gains from using public debt to stabilize the economy and smooth tax rates, mitigating the impact of inadequate insurance markets may justify a permanent increase in public debt. With a well-functioning insurance market, the optimal public debt ratio would be negative – governments should be net savers rather than net debtors. This would allow governments to finance expenditures from interest received on assets rather than from distortionary taxes.6

Empirical issues raised by the inadequate insurance-market approach include whether correcting the market failure is sufficient to make the optimal debt ratio positive and whether the penalty for deviating from the optimal ratio is significant enough to affect the choice of a debt target. Early analyses of incomplete markets found a positive optimal debt ratio. For instance, Aiyagari and McGrattan (1998) calculated an optimal debt ratio of 66 percent of GDP for the US economy. However, Peterman and Sager (2018), using a model with many of the same features as Aiyagari and McGrattan but incorporating multiple generations with standard life cycles instead of a single generation with an infinite life span, found that net government saving is optimal in the US economy. The main reason for the different result is that individuals in a life-cycle model spend a substantial fraction of their working lives accumulating enough savings to make self-insurance possible, so the benefit from self-insurance is smaller than if infinite life spans are assumed.

These results are less relevant for Canada for two reasons. First, employment insurance and other income support measures are more generous in Canada, so self-insurance leading to excess saving is less of an issue. Second, the US analysis assumes deficits are financed entirely by domestic savings, which is a much less realistic assumption for Canada. Foreign borrowing reduces the optimal debt ratio because it lessens the upward pressure on interest rates, which diminishes the impact of public debt on “self-insurance” savings and raises the cost of debt. James and Karam (2001) modified the Aiyagari and McGrattan model to allow borrowing from abroad, which changes the optimal debt ratio from 66 percent to about -80 percent. This qualitative result – that access to foreign savings reduces the optimal debt ratio – has been confirmed by other researchers (Nakajima and Takahashi 2017; Okamoto 2024; and Cozzi 2022).

This review suggests that the inadequate-markets approach does not reverse the conclusion from standard models that the optimal debt ratio is negative, implying that welfare gains can be realized when debt levels are reduced. However, the studies reviewed indicate that the penalty for deviating from the optimal debt ratio is small. In three of the six optimal debt studies reviewed, it is possible to compare the estimated economic costs. In the Peterman/Sager and Nakajima/Takahashi studies, a one-percentage-point increase in the debt ratio reduces consumption by .003 percent. The corresponding figure in the Cozzi study is much higher, approximately .02 percent. These estimates are very low relative to the estimates presented earlier, which imply a loss of .05 percent per percentage-point increase in the debt ratio.

It seems likely that these models are substantially understating the cost of debt. The benefits would have to be understated by an even larger percentage to overturn the conclusion that governments should be creditors not debtors. Since the argument for incurring debt to improve market efficiency is weak, the debt ratio should be chosen by considering only its impact on generational fairness. However, since debt is one of several factors affecting generational transfers, debt policy may have to deviate from the benefit principle to achieve a desired balance of the well-being of current and future generations.

Sustainability Analysis

High debt also raises concerns about its prudence or sustainability: can the interest expense be financed without requiring tax increases or cuts in program spending in the future? In his presentation, Alex Laurin, the Institute’s Vice President and Director of Research, challenged the federal budget’s claim that federal public finances are sustainable (Canada 2024, 382). The federal government’s sustainability claim is based on long-term projections showing a continuously declining debt-to-GDP ratio, reaching nine percent by 2055/56. Moreover, this trend holds even with less optimistic assumptions about interest rates and economic growth.

Laurin argued that this projection is not a convincing demonstration of sustainability for three reasons:

1) Interest Rate Assumptions: In the base case, the effective interest rate on federal debt (r) remains below the growth rate of the economy (g) for 32 years, which puts continuous downward pressure on the debt ratio. This assumption is inconsistent with the historical record. Over the past 35 and 45 years ending in 2022/23, averages of r-g are positive, at 0.8 and 0.4 percentage points, respectively. Only when the averaging period is extended back to include the high-inflation period starting in the 1970s does the multi-year average turn negative.7

2) Program Spending Assumptions: While revenues are assumed to grow in line with GDP, program spending decreases by about one percentage point of GDP over the projection period, causing the primary surplus to rise and putting downward pressure on the debt ratio. A more realistic “no policy change” assumption would keep the share of program spending roughly constant, allowing an assessment of the sustainability of current spending levels.

3) Exclusion of Economic Downturns: The projection fails to explicitly include economic downturns. Over the last 60 years, Canada has experienced five recessions, each prompting discretionary temporary stimulus measures that permanently increased debt. The policy response averaged 1.09 percentage points of potential GDP for each percentage point deviation from potential GDP (Table 1).

Laurin presented an alternative debt projection, assuming that overall program spending grows in line with GDP from 2029/30 to 2055/56 and that r equals g on average over the projection period.8 With these changes, the decline in the federal debt ratio is less pronounced, reaching 29 percent in 2055/56 compared to 9 percent in the budget projection.

Economic downturns were included in the projection by simulating 1,000 random probabilistic scenarios – assuming the frequency and magnitude of recessions over the past 60 years are representative of the future. Laurin assessed debt sustainability by calculating the probability that the debt ratio remains at or falls below its initial value over the projection period.9 The simulations showed an even chance that the debt ratio will exceed its 2028/29 value late in the projection period. Under the International Monetary Fund’s classification (IMF 2022), Canada’s federal debt would be considered unsustainable.

Some conference participants suggested that Laurin’s analysis might not fully capture the risks associated with the federal fiscal position because it assesses a single r-g profile. They also emphasized the importance of including provincial and territorial governments in any sustainability analysis, as these levels are most affected by demographic aging.

For this report, Laurin modified his approach to include provincial and territorial governments’ net debt and to capture the risks of r-g deviating from its assumed zero average over the long term. He introduced variability in the interest-rate growth-rate gap based on historical data, allowing for a more comprehensive risk assessment (methods and assumptions are provided in Appendix).

The modified analysis showed that, without any simulated shocks, the combined federal and provincial/territorial net debt-to-GDP ratio initially declines and then stabilizes until 2041/42, when rising healthcare costs due to demographic aging – and the associated interest on provincial debt – cause it to rise steadily (Figure 2, black dashed line). Introducing interest rate and recession shocks significantly alters the outlook, indicating a 50 percent chance that the debt ratio will begin its long-term rise in 2035/36, eventually surpassing 100 percent of GDP (black dotted line). There is a 20 percent chance (the 80th percentile) that the debt ratio will not decrease substantially from its current level and start a steady increase in 2033/34 (grey dotted line). Conversely, there is only a 20 percent chance (the 20th percentile) that the ratio will stay below its near-term value for the entire projection period (gold dotted line).

A Prudent and Fair Target

Prudence

According to McGill economist Christopher Ragan, the main concern about Canada’s high public debt is that it will reduce our ability to borrow to address the next economic crisis. He analysed this issue using three zones for the debt ratio: red (top), yellow (middle) and green (bottom) (Figure 3). The red (top) zone, which represents unsustainable debt, starts roughly five percentage points below the 1995 federal-provincial debt ratio’s peak of 100 percent, when Canada entered a period of “forced austerity.” This entry point to the red (top) zone is higher than the 90 percent threshold for negative effects on growth developed by Reinhart and Rogoff (2010). However, the threshold would be lower if the interest rate on public debt (r) were higher than the rate of economic growth (g).

Ragan argued that the current combined federal-provincial debt-to-GDP ratio is in the yellow (middle) “cautionary” zone. The height of this zone is determined by the buffer required to avoid being pushed into the red (top) zone by an economic crisis. Entering the red (top) zone would mean sharply higher interest rates and lower growth.

To avoid this, Ragan set the buffer at 28 percentage points of GDP, about a quarter more than the increase in the debt ratio during the COVID-19 pandemic. Given the frequency of economic crises, he advocated returning to the green (bottom) zone by 2029/30, nine years after the end of the pandemic-induced recession. This requires reducing the federal-provincial debt ratio by about 10 percentage points.

Laurin followed up by determining the fiscal effort required to return to the green (bottom) zone with high probability. His calculations show that, starting in the next fiscal year (2025/26), the combined federal-provincial primary balance would need to increase permanently by 1.38 percent of GDP – or $42.9 billion in 2025/26.10 If implemented through spending reductions, provincial spending would have to decline by about 7 percent, or federal spending would have to fall by almost 9 percent. Note that such spending reductions would still not fully return the combined federal-provincial program spending/GDP ratio to its pre-pandemic 2018/19 value. The federal government could achieve the same effect by raising the GST to 8.5 percent. However, since most spending pressures from an aging population are on provincial governments, it would be sound policy for the federal government to transfer tax points to provincial governments (Kim and Dougherty 2020). Even with near-term fiscal adjustment, additional consolidation may be necessary in the future to prevent a rise in the debt/GDP ratio.

Ragan favoured achieving the debt target through expenditure restraint rather than raising taxes, which he thinks may have reached their limit. Restraining expenditures will be particularly challenging given medium-term pressures from an aging society, rising military and security needs, and potentially increased public investments for the transition to a green economy. Canada, therefore, needs an ongoing and thorough program review to identify low-priority spending.

Fairness

Financing current government spending with debt is generally considered fair if the debt-to-GDP ratio is constant or declining over time, implying that future generations can receive the same level of government services without facing higher tax rates. However, stable tax rates alone are insufficient to prevent intergenerational transfers. Taxes must increase to finance the interest on the debt or remain higher than they would be otherwise. If the tax increase applies to both current and future generations, tax rates would be stable but higher than they would be without the increased debt. The higher tax rates required to finance debt interest and the deficit-induced reduction in national-savings transfer part of the cost of government spending to future generations who do not benefit from the spending.

Assessing generational fairness requires understanding the extent of intergenerational transfers resulting from fiscal policy. The presentation by Parisa Mahboubi, a Senior Policy Analyst at the Institute, offered insights into this issue using generational accounts. These accounts show lifetime net taxes imposed by federal and provincial governments for each birth cohort from 1923 to 2023 and for a composite future generation consisting of all persons born after 2023. The lifetime tax burdens of the 2023 birth cohort and future generations are comparable because a complete life cycle is captured in both cases. Her analysis shows that future generations are expected to face a slightly higher lifetime net tax burden than the youngest living generation.

Preparing generational accounts requires information on lifetime taxes and transfers for each birth cohort alive today and for future generations. Projected values of taxes paid by current birth cohorts are developed based on age-specific profiles of different types of taxes,11 assuming unchanged tax policies. Spending on health, education, elderly benefits, child benefits, social assistance and GST credits vary by age, while other government expenditures are evenly distributed per capita. Per capita taxes, transfers and expenditures are assumed to grow at the same rate as productivity.

The lifetime net tax burdens for currently alive birth cohorts are calculated as the present value of projected tax payments less the present value of projected government transfers the cohort will receive. Lifetime net tax burdens of future generations are calculated using the “no free lunch” constraint: someone, sometime, must pay for all that the government spends (US Congressional Budget Office 1995). The lifetime net tax burden of future generations equals the amount of future spending not paid by currently alive generations.12

In the baseline scenario, productivity grows 0.94 percent annually, the average GDP per capita growth from 2002 to 2022. The discount rate is the average return on real return bonds over the same period, 1.3 percent.13 Statistics Canada’s medium-growth scenario14 is used for demographic projections, with population growing at an average annual rate of 0.85 percent over the 100-year projection, driven entirely by net immigration. The ratio of those over 65 to those aged 18-65 – the old-age dependency ratio – more than doubles over the projection period, rising from 30 percent to 72 percent (Figure 4).

The increase in the old-age dependency ratio drives upward trends in elderly benefits and health-related expenditures as a share of GDP. Other categories of age-specific spending remain roughly constant.

In the baseline scenario, the lifetime net tax burden of future generations (“unborn”) exceeds that of the cohort born in 2023 (“newborn”) by $23,000 per person (Figure 5). Factors influencing this result include:15

  • Fiscal Position in the Base Year: In 2023, federal and provincial tax revenues exceeded program spending by over one percent of GDP. A smaller primary surplus would have decreased the lifetime net tax burden of the newly born, increasing the burden on the unborn.
  • Population Growth: Faster population growth reduces the relative tax burden on future generations by slowing the rise in the old-age dependency ratio and reducing the per-capita burden of existing debt.
  • Healthcare Costs: If real healthcare costs increase faster than productivity growth, the recently born will pay a smaller share, leaving more for future generations.

The baseline assumptions represent the midpoint of a range of plausible values. While results are sensitive to changes in assumptions, the baseline is considered the most likely outcome. The generational accounts, therefore, suggest that fiscal policy is generationally fair.

However, other factors must be considered when assessing fairness:

  • Population Stability: If there were no net population growth, the tax burden on future generations would be much higher, even if the old-age dependency ratio did not change, because the cost of existing debt would be spread over a smaller population. This observation draws attention to the fact that future generations will be paying for services they did not receive, even with stable lifetime net taxes.
  • Income Growth: Future generations will likely be richer due to productivity growth, which could justify asking them to bear some costs of current consumption. However, parents may not wish to pass on costs to their children, even if incomes are rising over time. Population growth through immigration substantially reduces intergenerational linkages, which could encourage the current generation to increase the target size of intergenerational transfers.
  • New Spending Pressures: The generational accounts do not capture new pressures like rising military and security commitments or higher spending to achieve a net-zero emissions economy. In both cases, underspending in the past has pushed costs into the future. Pre-funding some of this spending by increasing taxes in the near term would even out contributions across generations.
  • Comparisons with Near Term Future Generations: Generational accounts compare a representative future generation with the most recent birth cohort. Comparing the tax burden of living generations with the burden on near-term future generations is also relevant.

While the generational accounts indicate that the federal-provincial fiscal stance is fair to future generations under current assumptions, it is beneficial to supplement this analysis with assessments over shorter time horizons. For example, virtually all living generations benefited from the debt-financed income stabilization and health measures implemented during the pandemic-induced recession. There is a strong fairness argument for paying down pandemic-related debt before the next generation starts working and paying taxes, which would occur over the 2035-to-2045 period (Lester 2021).

Federal and provincial Covid-related spending amounted to approximately $430 billion from 2020/21 to 2022/23.16 Federal and provincial debt was $2,092 million in 2022/23. Reducing the level of debt to $1,660 million no later than 2045/46 would be fair to generations born in 2019 and later. However, in Laurin’s prudent scenario, in which debt is sustainable with 80 percent probability, the level of debt rises continuously over the projection period. The gap between the prudent and fair level of debt is $1,200 million in 2035/36. Achieving a fair level of debt would require more fiscal consolidation than is needed to achieve sustainability.

Reforming Expenditure Management

Ragan’s debt target and the recommendation to achieve it through expenditure restraint raise two issues:

1) Building Consensus: How to build a consensus on the proposed debt target and increase the likelihood of achieving it.

2) Identifying Savings: How to identify programs that don’t provide enough value to justify raising taxes to finance them.

Economist and C.D. Howe Institute Fellow-in-Residence John Lester emphasized that achieving a political consensus on a more prudent fiscal approach requires vigorous and sustained advocacy. Part of this advocacy involves convincing governments to surrender some policy flexibility to increase the odds of achieving the target reduction in debt and reduce the risk of relapse after the next crisis.

Lester and Laurin (2023) propose a principles-based fiscal governance framework intended to reduce the bias toward deficit financing in both good times and bad. Governments should adopt guiding principles for fiscal policy, set operational rules for achieving target outcomes and transparently assess consistency with these principles.

At the conference, Lester expanded upon one element of the governance framework: a binding multi-year ceiling on non-cyclical spending. A key motivation for this proposal is the failure to adhere to spending tracks set out in budgets and fiscal updates. For example, in the federal government’s 2019 Economic and Fiscal Update, program spending was projected to decline as a share of GDP, reaching 13.8 percent by 2024/25. The spending ratio projected for 2024/25 increased in successive budgets so that in 2024-25 it will be almost 2 percentage points higher than projected in 2019.18

Binding multi-year expenditure ceilings apply in 11 OECD member countries (Moretti, Keller, and Majercak 2023).19 In the Netherlands and Switzerland, the ceilings are set out in legislation that constrains expenditure growth. Alberta has recently adopted a similar approach.20 However, in most countries, expenditure ceilings are set by the government to ensure consistency with its self-defined fiscal objectives, which may or may not include expenditure restraint. This is the general approach recommended for Canada, although the hope is that the self-defined objective will be to achieve the debt target through expenditure restraint.

The expenditure ceiling would be binding for five years, ideally developed in the first year of a new electoral mandate after a campaign outlining spending plans in detail. The ceiling would cover all categories of spending directly affected by policy decisions. It would be updated annually to account for forecasting errors in program determinants (e.g., inflation, population growth). There would be escape clauses for major economic recessions, natural disasters and war. The ceiling could include a reserve for new policy initiatives, but in the context of expenditure restraint new initiatives may need to be funded by eliminating or modifying existing programs.

Identifying the programs that should be scaled back or eliminated because they don’t provide enough benefits to justify raising taxes to finance them requires, according to Lester, an overhaul of the way the government manages its spending, particularly the performance management framework that is key to establishing value for money. Yves Giroux set the stage for this discussion by describing the federal government’s current expenditure management system.

The requirement to evaluate programs was formalized following the creation of the Office of the Comptroller General in 1978. Despite several modifications, program evaluations have not been successful in affecting strategic spending decisions. The Ministerial Task Force on Program Review (the Nielsen Task Force) from 1984 to 1986 described evaluations as “generally useless and inadequate for the work of program review” (quoted in Grady and Phidd 1993). More recently, McDavid et al. (2018, 302) conclude that evaluations do not “address questions that would be asked as cabinet decision-makers choose among programs and policies.”

Under the current evaluation policy, federal government departments have considerable flexibility in conducting evaluations. They may focus on design and delivery, program beneficiary responses or a comparison of program costs and benefits. A review of 48 evaluations prepared since 2020 in eight departments21 found that only four went beyond assessing operational efficiency and impacts on beneficiaries to examine whether the program represented value for taxpayer money. Three of these applied formal benefit-cost analysis, which is the standard for assessing regulatory proposals.22

Evaluating programs in terms of operational efficiency and beneficiary impacts helps improve programs, but if evaluations are to inform strategic spending decisions, value-for-money assessments must be mandatory. These assessments should be based on the benefit-cost framework applied to regulatory proposals.

Benefit-cost analysis of regulatory proposals – and by extension, spending programs – assesses the overall social benefits and costs of policy initiatives. The quantitative analysis attempts to determine if the economic pie is larger or smaller after government intervention. For example, economic development programs (business subsidies) are implemented with the expectation that they will increase overall real income. To assess this, benefit-cost analysis considers not only the additional investment and employment resulting from the subsidy but also the opportunity cost of workers and capital – the amount that would have been earned otherwise. The net increase in the economic pie is the incremental earnings of workers and capital less efficiency losses from raising taxes or issuing debt to finance the subsidy and resources used to administer and apply for it.

The nature of the assessment should vary by program type. Business subsidies, labour market development programs and climate change mitigation/adaptation measures have benefits and costs measurable in monetary terms. These programs could be ranked by their net social benefits, allowing comparisons within and across program categories. Programs where benefits are less than costs would be candidates for elimination or modification.

A more nuanced approach is needed when assessing social programs and other measures with a fairness goal for several reasons. Their economic impact is ambiguous, and a negative economic impact is not a sufficient reason to eliminate a program. In addition, support for an income redistribution program depends on who benefits from it. As a result, evaluations of social programs should be more descriptive than prescriptive. They should present information on the economic impacts of measures, their fiscal cost, including administration expenses, and a discussion of who benefits from the program and how they benefit. Evaluations should also assess how the program fits into other measures providing support to the target population. This information will allow elected officials and, since all evaluations would be made public, Canadians, generally, to form an evidence-based opinion on the value for money of social programs.

A thorough assessment of government programs through a value-for-money lens may not identify enough wasteful spending to achieve deficit and debt targets. If so, tax increases should be used to achieve the objectives.

Adopting and achieving the debt target will require a political commitment that currently does not exist. The task for policy analysts is to help build a consensus on a more prudent approach to fiscal policy and a revamped expenditure management system. According to Lester, this consensus should be ratified by legislation setting out general principles for sound fiscal policy, supplemented with non-legislated operational rules to guide annual policy and monitor progress. This approach would impose discipline on fiscal policy while allowing flexibility to address unexpected developments. Legislation would strengthen the consensus on fiscal prudence and help prevent backsliding by future politicians.

Conclusion

The evidence presented at the conference confirmed that Canada has a debt problem. Existing debt levels are not prudent, and they raise concerns about generational fairness. Prudence requires that Canada’s public debt be reduced by about 10 percentage points of GDP before the decade’s end. This would require increasing the combined federal-provincial primary balance by 1.4 percent of GDP, or $43 billion, starting in 2025/26.

Tax increases harm economic performance, so elimination of public spending that does not provide enough benefits to offset this damage should be the first step in reducing deficits and debt. Identifying wasteful spending will require comprehensive value-for-money assessments. Governments must not take the easy way out by implementing across-the-board spending cuts. Successful expenditure restraint will also require setting binding multi-year expenditure ceilings to prevent governments from spending revenue windfalls or from increasing spending to improve chances of electoral success.

Canada’s public debt is imposing a burden on future generations. A comparison of the lifetime tax burden on the recently born with distant future generations reveals only a small generational transfer in favour of the recently born. However, burden shifting is much larger from currently living generations to persons born shortly after the pandemic-induced recession. The $430 billion in pandemic-related debt should be paid down by the people that benefited from the income stabilization measures. Achieving this fairness objective would require more fiscal consolidation than needed to ensure sustainability of the debt. For the Silo, Alexandre Laurin/John Lester via C.D. Howe Institute.

Appendix: Assumptions and Methods for the Sustainability Analysis

References

Aiyagari, S. Rao, and Ellen R. McGrattan. 1998. “The Optimum Quantity of Debt.” Journal of Monetary Economics 42 (3): 447–69.

Ambler, Steve, and Craig Alexander. 2015. “One Percent? For Real? Insights from Modern Growth Theory about Future Investment Returns.” E-Brief. Toronto: C.D. Howe Institute. October.

Burgess, David F. 1996. “Fiscal Deficits and Intergenerational Welfare in Almost Small Open Economies.” Canadian Journal of Economics, 885–909.

Canada. 2024. “Budget 2024.” Department of Finance Canada. April.

Checherita-Westphal, Cristina D., and Marcel Stechert. 2021. “Household Saving and Fiscal Policy: Evidence for the Euro Area from a Thick Modelling Perspective.” Available at: https://papers.ssrn.com/sol3/papers.cfm?abstract_id=3992188.

Conklin, David, and Thomas Courchene. 1983. “Deficits: How Big and How Bad?” Special Research Report. Toronto: Ontario Economic Council.

Cozzi, Marco. 2022. “Has Public Debt Been Too High in Canada and the US? A Quantitative Assessment.” University of Victoria, Economics. Available at: http://www.uvic.ca/socialsciences/economics/assets/docs/discussion/ddp2007.pdf.

Dahlby, Bev, and Ergete Ferede. 2022. “What Are the Economic Costs of Raising Revenue by the Canadian Federal Government?” Fraser Institute. Available at: https://roam.macewan.ca/items/73cf71a0-209f-4634-91a7-98d019750638/full.

Grady, Patrick, and Richard W. Phidd. 1993. “Budget Envelopes, Policy Making and Accountability.” Government and Competitiveness Project, School of Policy Studies, Queen’s University. http://global-economics.ca/budgetenvelopes.pdf.

International Monetary Fund (IMF). 2022. “Staff Guidance Note on the Sovereign Risk and Debt Sustainability Framework for Market Access Countries.” 2022–039. IMF Policy Papers.

James, Steven, and Philippe Karam. 2001. “The Role of Government Debt in a World of Incomplete Financial Markets.” Department of Finance, Economic and Fiscal Policy Branch.

Jenkins, Glenn, and Chun-Yan Kuo. 2007. “The Economic Opportunity Cost of Capital for Canada-an Empirical Update.” Queen’s Economics Department Working Paper. Available at: https://www.econstor.eu/handle/10419/189409.

Johnson, David. 2004. “Does the Debt Matter?” In Is the Debt War Over, pp. 173–96. Montreal: Institute for Research on Public Policy. Available at: https://books.google.com/books?hl=en&lr=&id=s4VcGvjVX0MC&oi=fnd&pg=PA173&dq=%E2%80%9CDoes+the+debt+matter%3F%E2%80%9D+&ots=t0fNWzkyoC&sig=TIQrfQbAitqgSIDuHypw_FT6Eeo.

Kim, Junghum, and Sean Dougherty (eds.) 2020. “Adaptability, accountability and sustainability: Intergovernmental fiscal arrangements in Canada,” in Ageing and Fiscal Challenges across Levels of Government, OECD Publishing, Paris.

Lester, John. 2024. “Minding the Purse Strings: Major Reforms Needed to the Federal Government’s Expenditure Management System.” Available at: https://www.cdhowe.org/sites/default/files/2024-09/For%20advance%20release%20EMS%20E-Brief_359.pdf.

Lester, John, and Alexandre Laurin. 2023. “Ottawa Needs a New Approach to Fiscal Policy.” E-Brief 338. Toronto: C.D. Howe Institute. Available at: https://papers.ssrn.com/sol3/papers.cfm?abstract_id=4397967.

Mahboubi, Parisa. 2019. Intergenerational Fairness: Will Our Kids Live Better than We Do? Commentary 529. Toronto: C.D. Howe Institute. January.

McDavid, Jim, Astrid Brousselle, Robert P. Shepherd, and David Zussman. 2018. “Linking Evaluation and Spending Reviews: Challenges and Prospects.” Canadian Journal of Program Evaluation 32 (3): 297–304. https://doi.org/10.3138/cjpe.43176.

Modigliani, Franco. 1983. “Government Deficits, Inflation and Future Generations.” In Deficits: How Big and How Bad, pp. 55–71.

Moretti, Delphine, Anne Keller, and Marco Majercak. 2023. “Medium-Term and Top-down Budgeting in OECD Countries.” OECD Journal on Budgeting 23 (3). https://www.oecd-ilibrary.org/content/paper/39425570-en.

Nakajima, Tomoyuki, and Shuhei Takahashi. 2017. “The Optimum Quantity of Debt for Japan.” Journal of the Japanese and International Economies 46:17–26.

Okamoto, Akira. 2024. “The Optimum Quantity of Debt for an Aging Japan: Welfare and Demographic Dynamics.” The Japanese Economic Review. May. Available at: https://doi.org/10.1007/s42973-024-00156-7.

Panizza, Ugo, Richard Varghese, and Yi Huang. 2019. “Public debt and private investment.” Centre for Economic Policy Research. VOXEU Column. December 4.

Peterman, William, and Erick Sager. 2018. “Optimal Public Debt with Life Cycle Motives.” https://papers.ssrn.com/sol3/papers.cfm?abstract_id=3187698.

Ragan, Christopher, and William G. Watson. 2004. “Is the Debt War Over?: Dispatches from Canada’s Fiscal Frontline.” Vol. 45. IRPP. Available at: https://books.google.com/books?hl=en&lr=&id=s4VcGvjVX0MC&oi=fnd&pg=PP11&dq=%22Is+the+debt+war+over%3F%22&ots=t0fNWqoDsw&sig=Q1poOT4AbHtIkx_NVf5GjrcXEtc.

Reinhart, Carmen M., and Kenneth S. Rogoff. 2010. “Growth in a Time of Debt.” American Economic Review 100 (2): 573–78. https://doi.org/10.1257/aer.100.2.573.

Robson, William, and Parisa Mahboubi. 2024. Another Day Older and Deeper in Debt: The Fiscal Implications of Demographic Change for Ottawa and the Provinces. Commentary 665. Toronto: C.D. Howe Institute. August.

Robson, William, and William Scarth. 1994. Deficit Reduction – What Pain, What Gain? (Policy Study 23). Toronto: C.D. Howe Institute.

US Congressional Budget Office. 1995. “Who Pays and When? An Assessment of Generational Accounting.” Available at: https://www.cbo.gov/sites/default/files/cbofiles/attachments/Genacct.pdf.

Heroic Animal Rescue Efforts Amid Palisades Fire

In Defense of Animals Supports Evacuations & Offers Emergency Care

https://lh7-rt.googleusercontent.com/docsz/AD_4nXeJhpCpvFrnNduu2qNIvI4C3vjkHoEwXbU-aMjAMZR1C57DJIveYqsCQeGpb75tdXHnalzmlBoDZ4Sk0CrNdo_of46VNyPNY6NypbV8QVYaKZmgIDWaKXnisfTcS7mcUDZuNpR1jA?key=72roC9hKvq5eCyXOu_R5F1Kw

Watch video below-

In Defense of Animals battled through downed power lines, rockslides, and fallen trees to aid animals, and is offering and seeking help for others. Photo: In Defense of Animals

LOS ANGELES (January, 2025) — As the devastating Palisades Fire and others continue to ravage communities in Los Angeles, In Defense of Animals is taking decisive action to support animal rescuers and provide life-saving aid for animals affected by the crisis. Among the heroic responders is In Defense of Animals board member Sammy Zablen, who has been working tirelessly to evacuate animals from dangerous areas.

On January 8, Zablen responded to a plea from Philozoia animal rescue in Malibu’s Tuna Canyon area to evacuate two ponies from their fire-threatened property. What would normally be a 20-minute drive took over three hours due to extreme conditions, including rockslides, downed trees, and fire debris blocking the route.

https://lh7-rt.googleusercontent.com/docsz/AD_4nXfoRc7K76lWydNR-WxG-9CO3o3Z9VkLfOHzAeLG6kKdilsKeBFxjulVGVG9ezF9e4W6Ote795cJG8r_7kyZQ2pH1lE3YQFXYX--nNWMCenGCij1vG4LSkEYABcF1kS1cjAauoiqDg?key=72roC9hKvq5eCyXOu_R5F1Kw

Navigating a treacherous path that included cutting brush and driving on hiking trails, Zablen’s team encountered harrowing obstacles such as a burning power pole, destroyed homes, and vehicles engulfed in flames. Upon arrival, the team discovered the ponies’ corral broken and the animals missing. Despite an active fire and dangerous rockslides, the team searched the area for 30 minutes, leaving food, water, and dousing the roof with water to mitigate further damage. 

The two ponies have now been recovered by Philozia, but two dogs remain missing and the rescue center burned down entirely. Earlier in the day, a pig and 38 dogs were successfully evacuated. Philozoia is seeking urgent foster care for several senior dogs.

https://lh7-rt.googleusercontent.com/docsz/AD_4nXco078SNaBP3mLTsMCPOCym3tn9UsUNClUoy3TCC51RV7JSKEXt_ZXaK5BtAwCjrDKPrza1sfcpLNSYhsL774PoyvWJQ7D985DNuIx3I9dsfnOWykoyis_KGiFZ-ofatQegyV2s?key=72roC9hKvq5eCyXOu_R5F1Kw

In Defense of Animals is collaborating with multiple local rescuers and organizations. Advanced Fire Rescue and Lifesavers Wild Horse Rescue were both vital in coordinating resources and gaining access to this dangerous area.

In Defense of Animals is offering emergency aid to animal rescuers and caregivers affected by the fires and providing free resources for temporary housing and care for wild and domestic animals.

https://lh7-rt.googleusercontent.com/docsz/AD_4nXfVbbZou9FZnpT-fJUBL70IYfFPi1bINXSCsuB2W94k0EK_bnu9Reg0GeHDo2p9dQOU1iieAcXQSeATmJ5PHZqtA5MFaFlqtCb2wdNC7OnccMw6XBWqPcG9PHB3eVRTdmizfM9iiA?key=72roC9hKvq5eCyXOu_R5F1Kw

“The devastation of these fires is unimaginable, and animals are often the most vulnerable victims,” said Marilyn Kroplick M.D., President of In Defense of Animals. “We are deeply grateful for the bravery of responders like Sammy Zablen and the other incredible organizations we are coordinating with to help on the ground. Together, we are making a difference for animals in crisis.”

In Defense of Animals urges anyone needing assistance with animal evacuations or free, temporary housing for wild or domestic animals to call Sammy Zablen at 310-869-2383. Please mention The Silo when contacting.

Los Angelenos who can foster a senior dog are encouraged to apply at www.philozoia.org/foster.

In Defense of Animals is seeking donations which are critical to support these emergency efforts, providing resources such as veterinary supplies, food, water, and temporary shelter: www.idausa.org/lafire For the Silo, Fleur Dawes.

  • Request Fire Assistance: Sammy Zablen, Board Member, 310-869-2383

In Defense of Animals is an international animal protection organization based in California with over 250,000 supporters and a history of fighting for animals, people, and the environment through education and campaigns, as well as hands-on rescue facilities in California, India, South Korea, and rural Mississippi since 1983. www.idausa.org

Why Canada Capital Gains Tax Increase Is Bad Idea

January , 2025 – One of the most consequential policy changes in this year’s federal budget – an increase in the capital gains inclusion rate – would have far-reaching consequences for Canadians, many of which are underestimated by the government, according to a new study from the C.D. Howe Institute. Leading economist and former President and CEO of the C.D. Howe Institute, Jack Mintz, examines the extensive economic repercussions of this proposed change in his latest report available in full at the end of this article.

Fiscal and Tax Policy

With Parliament prorogued on January 6, the future of the proposed capital gains tax increase remains uncertain. Canadians face the possibility of the measure being passed, amended, or withdrawn entirely under a new government.

Meanwhile, tax planners and the affected individuals and corporations must await the outcome, even though the Canada Revenue Agency began administering the tax on June 25, 2024, after it was announced in the spring budget. At this time, taxpayers could be assessed interest and penalties if they do not comply with the proposed law. If the law is never passed, taxpayers will have to claim refunds. The provincial budgets reliant on the new revenues will be affected if the planned measure is ultimately withdrawn, adding to the confusion and disruption.

“The planned measure to increase the capital gains inclusion rate should never see the light of day when Parliament resumes after March 24, nor be revived thereafter by a new government,” says Mintz. “The hike would create a triple threat: harming Canadian businesses, discouraging investment, and penalizing middle-income Canadians.”

While the government estimated this change would only impact 40,000 individual tax filers and 307,000 corporations, Mintz’s analysis, using longitudinal data, reveals the true impact would be significantly broader. Over 1.26 million Canadians would be affected over their lifetimes – representing 4.3 percent of taxpayers or some 22,000 Canadians per year – with many middle-income earners among those hardest hit.

The report projects significant economic harm caused by the proposed increase – Canada’s capital stock would decline by $127 billion, GDP would fall by nearly $90 billion, and real per-capita GDP would drop by 3 percent. Further, employment would decline by 414,000 jobs, which would raise unemployment from 1.5 million to 1.9 million workers. Importantly, half of the affected individuals would be earning otherwise less than $117,000 annually, with 10 percent earning as little as $18,000, excluding capital gains income.

“This would not just be a tax on the wealthy,” says Mintz. “Many middle-income Canadians would bear the brunt of this increase, and the economic costs would ripple across the entire economy.”

Mintz also highlights the broader implications for Canadian businesses. The planned measure would likely deter equity financing, discourage investment, and exacerbate inefficiencies in financial and corporate structures. Contrary to government claims of “neutrality,” he argues the tax would disproportionately harm domestic companies. These companies will pay corporate capital gains taxes that will increase investment costs. Moreover, they are dependent on Canadian investors due to “home bias” in equity markets. The changes would risk weakening Canada’s productivity and competitiveness at a critical time.

The report further critiques the lack of mechanisms to mitigate the effects of “lumpy” capital gains. Significant asset disposals, such as selling real estate, farmland, business assets, secondary homes or during events like death or emigration, may occur only once or twice in a person’s lifetime. Without provisions to average or defer taxes, individuals would face disproportionately higher burdens. Additionally, the planned tax hike would exacerbate the “lock-in effect,” which discourages the efficient reallocation of capital.

“If the proposed law does not proceed, it would be worthwhile for a government to review capital gains taxation as part of a general tax review that would improve opportunities for economic growth rather than hurt it,” says Mintz.

Read the full report here.

Canadians Paying More Insurance Premiums That Most Developed Nations

Canadian consumers and businesses pay more than $80 billion a year in property & casualty insurance premiums with an upward trend consistently in excess of our anemic GDP growth rate. The total cost is now more than 3 percent of GDP. … But how does Canada benchmark relative to its global peers?

• Canadians pay higher premiums for property and casualty insurance than citizens in many, if not most, other developed nations. This Commentary uses OECD data and private industry data to compare the national P&C insurance sector’s premiums as a percentage of Gross Domestic Product with its international peers and is an update of the findings of the author’s 2021 edition of this report.

• The Commentary focuses on liability, property and auto insurance to compare costs across nations. Then, it takes a deeper dive into the Canadian data to compare personal property and auto insurance among all provinces and territories.

When it comes to costs for property insurance, the study finds Canada is in the top ranks, paying 1.23 percent of GDP in premiums, almost double the 0.66 percent average of other G7 peers and even higher than the 0.52 percent OECD average. For automobile insurance (which here includes both personal and commercial), Canadians appear to be paying, on average, the highest premiums in the world, relative to GDP.

• Within Canada, inter-provincial benchmarking for personal property insurance shows the higher average premiums paid in Canada – relative to the rest of the developed world – appear to be shared equally by most provinces. However, province-by-province comparisons of personal auto insurance show that there are substantial differences among provinces, with four jurisdictions producing higher-than-average results. Two of the four (Saskatchewan and Manitoba) are government-monopoly jurisdictions – in fact, these are the two highest in terms of costs. The two other outliers (Ontario and Alberta) are served by a competitive private sector, but Alberta has chosen until very recently to maintain a costly tort environment and Ontario mandates particularly generous accident benefits and has experienced a plague of auto theft.

• In the case of automobile insurance, just a handful of provinces need to think harder about how to improve car insurance premiums. But to reduce the cost of living for homeowners, the solutions required must be national in scope and include public/private partnerships to share the rapidly increasing risk-transfer price of natural catastrophe events.

Read the full article by Alister Campbell via this PDF.

Bitcoin Reaches $100,000 usd Milestone- What’s Next?

Laser eyes on the future: Bitcoin $100,000 USD/ $142,400 CAD

One hundred thousand United States Dollars. It’s a nice round number. The first to be six figures. And seeing it follow the word “Bitcoin” is a historical moment worth celebrating.

The importance of BTC $100,000 usd is largely symbolic. It’s small compared to the up-to-infinite price levels that succeed it. While $100,000 usd is a significant milestone worth pausing to recognize, it is also merely a checkpoint on Bitcoin’s much longer, much larger journey ahead.

Let’s take a moment to remember the early moments of this journey. The year Kraken was founded (2011), Bitcoin’s Dec. 31 closing price was $4.25. From that level, the value of just one of the 21 million bitcoins that will ever exist is now up over 2.3 million percent at BTC $100,000 usd.

BTC $100,000 usd has long been viewed as the next/seemingly “final” frontier for Bitcoin’s price. Laser eyes and dank memes, as well as innovative products and user experiences, have accelerated us to this point.

Through years of speculation around “the world to be when Bitcoin reaches $100,000 usd,” a common sentiment held that the $100,000 usd price level would somehow confer the legitimacy of “a peer-to-peer electronic cash system.” It would show the value of a tamper-resistant and immutable way of recording information. It would prove that decentralization had a place in modern society. 

But, now that we are here, those goals may seem as if they still have more to deliver. It feels like this is still only the beginning. We’ve reached a pricing milestone, but when it comes to fulfilling Satoshi’s original vision for Bitcoin – its widespread use as a borderless, worldwide peer-to-peer electronic cash system – Bitcoin is still in its relative infancy.

Over the short term, it’s anyone’s guess whether the price of Bitcoin will continue its sprint higher or pull back from its recent run. What is clear is that the $100,000 usd milestone demonstrates ongoing demand for a reliable, transparent and peer-to-peer way to transact.

BTC $100,000 usd represents a monumental milestone in Kraken’s mission to accelerate the adoption of cryptocurrency, so that everyone can achieve financial freedom and inclusion. We’d like to congratulate those who have built in the space alongside us and played a role in realizing this achievement. 

We’d also like to congratulate our clients as they celebrate this watershed moment, while making a commitment to serve them through the next chapters of Bitcoin’s history.

Join us as we reflect on the journey that got us here and commemorate this remarkable day – while we reaffirm our commitment to a future of financial freedom.

Get started with Kraken

These materials are for general information purposes only and are not investment advice or a recommendation or solicitation to buy, sell, stake or hold any cryptoasset or to engage in any specific trading strategy.

Strengthening Canada’s Trade Laws to Address Emerging Global Threat

Key Canadian trade laws do not refer to national security as a factor that allows Canada to counter threats from imports of goods or services. Given the tense geopolitical situation, I propose ways to close this “national security gap.” 

The gap is particularly worrisome in two key import-governing legislation: (1) the Customs Tariff Act and (2) the Export and Import Permits Act.

I will show why the omission of the national security element in these and possibly other statutes needs to be remedied.

National Security & Chinese Exports

The Americans imposed surcharges on Chinese EVs, steel, aluminum, semiconductors and other products in May 2024 in response to heavily subsidized Chinese imports that were said to have breached international trade rules. 

The EU started applying countervailing duties on Chinese EVs in July this year, using a more standard trade remedy process to counter the injurious impact of subsidized imports on the European automotive industry. 

The danger posed by Chinese EVs, steel and aluminum imports, plus these actions by Canada’s major trading partners, led the Canadian government to apply comparable tariff surcharges. The strategic threat posed by China’s state-subsidized exports made for the right response by Canada. 

While existing laws allowed the federal cabinet to take action in this case, it also brought home the fact that there is an absence of any reference to “national security” in some of Canada’s major trade law statutes.

Section 53 – Canada’s Rapid  Response Mechanism

In the United States, Section 232 of the 1962 Trade Expansion Act, along with Section 301 of the 1974 Trade Act, authorize the president to increase tariffs on imports if the quantity or circumstances surrounding those imports are deemed to threaten national security.1

Section 232 was used by the Trump administration in 2018 to apply surcharges to a range of imports from numerous countries, including Canada. However, these tariffs were ultimately dropped in the face of threats by Canada to retaliate against American goods exported to Canada.

Unlike the US, Canada lacks the legislative means to impose import surcharges on the basis of national security. The closest we have is Section 53 of the Customs Tariff Act, which focuses on the enforcement of Canada’s rights under trade agreements and responses to practices that negatively affect Canadian trade. It was Section 53 that was used in the August decision on Chinese EVs, etc., referred to earlier.

Indeed, there are similarities between Section 301 of the US Trade Act of 1974 and Section 53 of the Customs Tariff Act.But while existing laws allowed the federal cabinet to act in this case, the case brought home the fact that there is an absence of any reference to “national security” in some of Canada’s major trade law statutes.

Governments have shied away from using Section 53 as a policy tool over the years. It was used only once before its present deployment, in response to the Trump administration’s surcharges on Canadian steel and aluminum in 2018 and 2020.2

 The surcharges were ultimately withdrawn when the US tariffs were terminated.Section 53 comes under Division 4 of the Actentitled “Special Measures, Emergency Measures and Safeguards,” giving the government broad powers to apply unilateral tariff measures on the joint recommendation of the ministers of Finance and Global Affairs:

…for the purpose of enforcing Canada’s rights 

under a trade agreement in relation to a country 

or of responding to acts, policies or practices of 

the government of a country that adversely affect, 

or lead directly or indirectly to adverse effects on, 

trade in goods or services of Canada…

There is no requirement for public consultations or input under this provision. Although the government held a round of stakeholder consultations before moving on Chinese imports in August, it was not legally obliged to do so. While the ministerial recommendations must be fact-based and supported by credible data, the law is effective in that nothing inhibits rapid action by the federal cabinet. In this respect, it is a superior tool to Section 232 of the American legislation.3

The critical shortcoming, on the other hand, is that while allowing the government to protect Canadian trade interests in a fairly rapid fashion, Section 53 does not allow action on imports found to be threatening national security, whether it be economic, military or other. There is clearly a need to repair this omission, not only here but in Canada’s other trade laws.

In my view, we need a national security component in Section 53 as the Canadian counterpart to Section 232 of the US Trade Expansion Act.

Import Controls and National Security

Together with tariff measures, Canada can control imports under the Export and Import Permits Act(EIPA) through the creation of import (and export) control lists designed to achieve particular strategic, security and economic objectives. These lists are established by orders-in-council, 

requiring listed goods and technology to have a permit in order to be imported or exported. These permits are issued by the Trade Controls and Technical Barriers Bureau in Global Affairs Canada (GAC). Without a permit, imports of controlled items are illegal.

While Section 5(1) of EIPA provides for the creation of import control lists covering arms, ammunition and military items, it fails to provide for imports of goods or technology to be controlled for national security reasons. The Act could not have been used, for example, to deal with the effects on national security of imports of Chinese EVs, steel, aluminum or any other goods or technology. EIPA is thus deficient in this regard.

There is a related issue when it comes to export controls. Section 3(1) of EIPA authorizes the establishment of export control lists, among other reasons:

“(a)…to ensure that arms, ammunition, 

implements or munitions of war, etc. … otherwise 

having a strategic nature or value will not be made 

available to any destination where their use might 

be detrimental to the security of Canada.”

The reference to the “security of Canada” under paragraph (a) is the only such reference in the statute and is confined to the security aspects of imports of arms, ammunition, munitions of war, etc. While not as significant as the problems regarding import controls, it is nonetheless a serious omission.

The result is that as EIPA is currently drafted, the federal government lacks the legal authority to create import or export controls designed to protect or safeguard Canadian security. EIPA needs to be amended to add this authority on the part of the government.

Indeed, it may be desirable to re-consider much of the architecture of EIPA from the viewpoint of safeguarding Canada’s security interests on both the export and import side.

Controlling Imports Through Sanctions

Canada’s sanctions laws are found in the Justice for Victims of Corrupt Foreign Officials Act (JVCFOA), the United Nations Act, and, notably, the Special Economic Measures Act (SEMA). Each of these statutes allows the federal cabinet to issue sanctions through regulations 

applicable to specific countries and/or jurisdictions and prohibiting transactions in specific items of goods or technology. None of these laws allow sanctions for matters related to Canadian security.

SEMA is Canada’s most widely used sanctions legislation. Section 4 is the only part of the Act that uses the term “security,” but only in instances when, among other matters:

(b) a grave breach of international peace and 

security has occurred that has resulted in or is likely 

to result in a serious international crisis.

Because of the restrictions on international peace and security, the government lacks the authority to issue sanctions dealing with national security interests.4

For example, Canada’s sanctions on Russia are directed at countering actions that “constitute a grave breach of international peace and security that has resulted or is likely to result in a serious international crisis,” with no reference to Canadian national security interests.

SEMA should be amended to allow prohibitions of any transaction or dealings of any kind where Canada’s national security is at risk.

Trade Remedies and National Security

In accordance with the GATT/WTO Agreement, antidumping and countervailing (AD/CV) duties can be applied to dumped or subsidized imports when a domestic industry is injured or threatened with injury from exactly the same imports as that industry produces. In Canada, these are provided for under the Special Import Measures Act (SIMA).

SIMA actions are driven by complaints filed by domestic producers who make exactly the same or directly competitive products as the imported items. It means, for example, that in the absence of a Canadian industry threatened with injury or actually injured by the same type of Chinese EVs, aluminum or steel imports as those producers make, AD/CV duty remedies would not be available. SIMA makes no reference to national security as a factor in the application of these duties.

In short, because the SIMA process is geared to provide protection to domestic producers and private sector industries, it is inappropriate as a vehicle for dealing with national economic security concerns that range well beyond those private interests.

The same is true in the case of safeguards, another kind of trade action allowed under the World Trade Organization (WTO) Agreement to counter floods of imports that are not dumped or subsidized but, because of their volume, cause or threaten serious injury to domestic producers of the same product.

In Canada, safeguard measures come under the Canadian International Trade Tribunal Act, where an inquiry takes place and, if recommended by the Tribunal, are applied under the Customs Tariff Act.

As in the case of dumped or subsidized imports, safeguard measures are designed to protect specific domestic industries and not to deal with overarching national security issues.

Again, because the objective of these remedial measures in international and Canadian trade law is to protect a domestic industry from financial harm due to imports and not to deal with broader questions of national security, the absence of reference to “security” in these various statutes does not seem to be a significant issue.

National Security under International Trade Law

Article XXI of the 1947 General Agreement on Tariffs & Trade (GATT) is the only provision in the entire WTO package that deals with national security. That article (entitled “Security Exceptions”) allows departures from normal trade rules to permit unilateral trade-restrictive measures that a contracting party “considers necessary for the protection of its essential security interests…taken in time of war or other emergency in international relations.”

The drafting of GATT Article XXI dates back to the post-World War II Bretton Woods era. What was considered an international emergency at that time was war, regional armed conflict or a global pandemic like the Asian flu of 1918-1920. The same broad view of international emergency conditions was applied when the Uruguay Round negotiations took place (1991-1994) leading to the conclusion of the WTO Agreement.

With recent cataclysmic changes in the world, whatever the WTO-administered multilateral system might prescribe, governments are moving to protect a range of national (and economic) security concerns by means of unilateral measures in ways that were not envisaged when the Bretton Woods architecture was devised in the late 1940s.

For decades, there was little recourse to Article XXI exceptions. However, their use emerged in the last number of years with the unilateral surcharges imposed by Trump. 

The situation is different – and materially different – in the case of Chinese exports, not only EVs, steel or aluminum but also in technologically advanced or other critical items. These are goods that, by abundant evidence, are heavily subsidized, with massive overcapacity, exported to global markets as part of the Chinese government’s strategy to enhance its geopolitical position – facts uncovered in the EV situation through detailed investigations by the EU and the US.5

Thus, aggressive actions by China and possibly other countries in strategically sensitive areas take the issue beyond the WTO ruling in the US-Section 232 case and raise these to the level of an “emergency in international relations.”

In summary, the concept of an international emergency is much changed in today’s digitized, cyber-intensified world, including the aggressive and destabilizing policies of Chinese state capitalism and other bad actors. The application of GATT/WTO rules drafted in 1947 and updated in the 1990s must be adapted to deal with today’s realities if they are to provide governments with meaningful recourse.

Conclusions

In conclusion, Canada has a panoply of criminal, investment, intelligence gathering and other laws that address national security concerns. However, there is a notable absence of the term “national security” in Canada’s core trade law statutes.

This absence is of concern in the Customs Tariff Act and the Export and Import Permits Act, two important statutes that give the government authority to act to counter injurious imports threatening Canada’s national security.

Given the state of world affairs and the challenges Canada faces from aggressive players like China, Russia, Iran and others, the omissions in these statutes need to be remedied. This should be acted on immediately. There is also a lack of reference to national security in Canada’s sanctions legislation, notably the Special Economic Measures Act (SEMA), the main Canadian sanctions statute. 

Amendments should be made to make security concerns a ground for imposing sanctions here as well. The findings of EU agencies on Chinese BEV after a detailed investigation support the view that Chinese state capitalism and its centrally planned industrial capacity are geared toward dominating world markets in critical goods, part of that country’s geopolitical strategy. These and other similar governmental actions can be said to meet the “emergency in international relations” threshold under the WTO Agreement. 

Given the state of affairs at the WTO, including the paralysis of its dispute settlement system, amendments to or reinterpretation of the GATT rules are difficult, if not impossible. The result is that governments will be resorting to unilateral application of the Article XXI exclusion in their own national security measures. While the situation may evolve at the WTO, and without diminishing Canada’s support for the multilateral rules-based system, the federal government should bring forth measures to add reference to national security interests in the above statutes.  For the Silo, Lawrence L. Herman/ C.D. Howe Institute.

International Economic Policy Council Members 

Co-Chairs: Marta Morgan, Pierre S. Pettigrew Members: Ari Van Assche Stephen Beatty Stuart Bergman Dan Ciuriak Catherine Cobden John Curtis Robert Dimitrieff Rick Ekstein Carolina Gallo Victor Gomez Peter Hall Lawrence Herman Caroline Hughes Jim Keon Jean-Marc Leclerc Meredith Lilly Michael McAdoo Marcella Munro Jeanette Patell Representative, Amazon Canada Joanne Pitkin Rob Stewart Aaron Sydor Daniel Trefle

1 The Trade Expansion Act of 1962 (Pub. L. 87–794, 76 Stat. 872, enacted October 11, 1962, codified at 19 U.S.C. ch. 7); The Trade Act of 1974 (Pub. L. 93–618, 88 Stat. 1978, enacted January 3, 1975, codified at 19 U.S.C. ch. 12).

2 The government announced it was applying these “to encourage a prompt end to the U.S. tariffs, which negatively affect Canadian workers and businesses and threaten to undermine the integrity of the global trading system.” See: “United States Surtax Order (Steel and Aluminum),” Government of Canada, June 28, 2018, https://gazette.gc.ca/rp-pr/p2/2018/2018-07-11/html/sordors152-eng.html. 

3 Section 232 of the Trade Expansion Act allows the president to impose import restrictions – but these must be based on an investigation and affirmative determination by the Department of Commerce that certain imports threaten to impair US national security.

4 The array of Canada’s sanctions can be found on the GAC website at: https://www.international.gc.ca/world-monde/international_relations-relations_internationales/sanctions/current-actuelles.aspx?lang=eng. 

5 The EU measures followed a countervailing duty approach, as opposed to direct action in the case of Canada and the US. In its extremely detailed investigation, EU agencies found, on the basis of massive evidence, that:
“ . . . the BEV [battery electric vehicle] industry is thus regarded as a key/strategic industry, whose development is actively pursued by the GOC as a policy objective. The BEV sector is shown to be of paramount importance for the GOC and receives political support for its accelerated development. Including from vital inputs to the end product. On the basis of the policy documents referred to in this section, the Commission concluded that the GOC intervenes in the BEV industry to implement the related policies and interferes with the free play of market forces in the BEV sector, notably by promoting and supporting the sector through various means and key steps in their production and sale.”See: “Commission Implementing Regulation (EU) 2024/1866,” European Union, July 3, 2024, at para. 253, https://eur-lex.europa.eu/eli/reg_impl/2024/1866/oj

7000 Words About The Dubious Refragmentation Of The Economy

One advantage of being old is that you can see change happen in your lifetime.

A lot of the change I’ve seen is fragmentation. For example, US politics and now Canadian politics are much more polarized than they used to be. Culturally we have ever less common ground and though inclusiveness is preached by the media and the Left, special interest groups and policies have a polarizing effect. The creative class flocks to a handful of happy cities, abandoning the rest. And increasing economic inequality means the spread between rich and poor is growing too. I’d like to propose a hypothesis: that all these trends are instances of the same phenomenon. And moreover, that the cause is not some force that’s pulling us apart, but rather the erosion of forces that had been pushing us together.

Worse still, for those who worry about these trends, the forces that were pushing us together were an anomaly, a one-time combination of circumstances that’s unlikely to be repeated—and indeed, that we would not want to repeat.

Describe How a Mass Culture Developed in America - JeankruwHumphrey

The two forces were war (above all World War II), and the rise of large corporations.

The effects of World War II were both economic and social. Economically, it decreased variation in income. Like all modern armed forces, America’s were socialist economically. From each according to his ability, to each according to his need. More or less. Higher ranking members of the military got more (as higher ranking members of socialist societies always do), but what they got was fixed according to their rank. And the flattening effect wasn’t limited to those under arms, because the US economy was conscripted too. Between 1942 and 1945 all wages were set by the National War Labor Board. Like the military, they defaulted to flatness. And this national standardization of wages was so pervasive that its effects could still be seen years after the war ended. [1]

Business owners weren’t supposed to be making money either.

FDR said “not a single war millionaire” would be permitted. To ensure that, any increase in a company’s profits over prewar levels was taxed at 85%. And when what was left after corporate taxes reached individuals, it was taxed again at a marginal rate of 93%. [2]

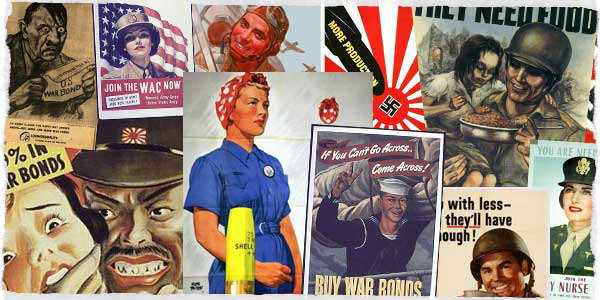
Socially too the war tended to decrease variation. Over 16 million men and women from all sorts of different backgrounds were brought together in a way of life that was literally uniform. Service rates for men born in the early 1920s approached 80%. And working toward a common goal, often under stress, brought them still closer together.

Though strictly speaking World War II lasted less than 4 years for the USA, its effects lasted longer and cycled North towards Canada.

Wars make central governments more powerful, and World War II was an extreme case of this. In the US, as in all the other Allied countries, the federal government was slow to give up the new powers it had acquired. Indeed, in some respects the war didn’t end in 1945; the enemy just switched to the Soviet Union. In tax rates, federal power, defense spending, conscription, and nationalism the decades after the war looked more like wartime than prewar peacetime. [3] And the social effects lasted too. The kid pulled into the army from behind a mule team in West Virginia didn’t simply go back to the farm afterward. Something else was waiting for him, something that looked a lot like the army.

If total war was the big political story of the 20th century, the big economic story was the rise of new kind of company. And this too tended to produce both social and economic cohesion. [4]

The 20th century was the century of the big, national corporation. General Electric, General Foods, General Motors. Developments in finance, communications, transportation, and manufacturing enabled a new type of company whose goal was above all scale. Version 1 of this world was low-res: a Duplo world of a few giant companies dominating each big market. [5]

The late 19th and early 20th centuries had been a time of consolidation, led especially by J. P. Morgan. Thousands of companies run by their founders were merged into a couple hundred giant ones run by professional managers. Economies of scale ruled the day. It seemed to people at the time that this was the final state of things. John D. Rockefeller said in 1880

Image result for john d rockefeller

The day of combination is here to stay. Individualism has gone, never to return.

He turned out to be mistaken, but he seemed right for the next hundred years.

The consolidation that began in the late 19th century continued for most of the 20th. By the end of World War II, as Michael Lind writes, “the major sectors of the economy were either organized as government-backed cartels or dominated by a few oligopolistic corporations.”

For consumers this new world meant the same choices everywhere, but only a few of them. When I grew up there were only 2 or 3 of most things, and since they were all aiming at the middle of the market there wasn’t much to differentiate them.

One of the most important instances of this phenomenon was in TV.

Popular culture and daily life of Americans in the 1950s - WWJD

Here there were 3 choices: NBC, CBS, and ABC. Plus public TV for eggheads and communists (jk). The programs the 3 networks offered were indistinguishable. In fact, here there was a triple pressure toward the center. If one show did try something daring, local affiliates in conservative markets would make them stop. Plus since TVs were expensive whole families watched the same shows together, so they had to be suitable for everyone.

And not only did everyone get the same thing, they got it at the same time. It’s difficult to imagine now, but every night tens of millions of families would sit down together in front of their TV set watching the same show, at the same time, as their next door neighbors. What happens now with the Super Bowl used to happen every night. We were literally in sync. [6]

In a way mid-century TV culture was good. The view it gave of the world was like you’d find in a children’s book, and it probably had something of the effect that (parents hope) children’s books have in making people behave better. But, like children’s books, TV was also misleading. Dangerously misleading, for adults. In his autobiography, Robert MacNeil talks of seeing gruesome images that had just come in from Vietnam and thinking, we can’t show these to families while they’re having dinner.

I know how pervasive the common culture was, because I tried to opt out of it, and it was practically impossible to find alternatives.

When I was 13 I realized, more from internal evidence than any outside source, that the ideas we were being fed on TV were crap, and I stopped watching it. [7] But it wasn’t just TV. It seemed like everything around me was crap. The politicians all saying the same things, the consumer brands making almost identical products with different labels stuck on to indicate how prestigious they were meant to be, the balloon-frame houses with fake “colonial” skins, the cars with several feet of gratuitous metal on each end that started to fall apart after a couple years, the “red delicious” apples that were red but only nominally apples. And in retrospect, it was crap. [8]

But when I went looking for alternatives to fill this void, I found practically nothing. There was no Internet then. The only place to look was in the chain bookstore in our local shopping mall. [9] There I found a copy of The Atlantic. I wish I could say it became a gateway into a wider world, but in fact I found it boring and incomprehensible. Like a kid tasting whisky for the first time and pretending to like it, I preserved that magazine as carefully as if it had been a book. I’m sure I still have it somewhere. But though it was evidence that there was, somewhere, a world that wasn’t red delicious, I didn’t find it till college.

It wasn’t just as consumers that the big companies made us similar. They did as employers too. Within companies there were powerful forces pushing people toward a single model of how to look and act. IBM was particularly notorious for this, but they were only a little more extreme than other big companies. And the models of how to look and act varied little between companies. Meaning everyone within this world was expected to seem more or less the same. And not just those in the corporate world, but also everyone who aspired to it—which in the middle of the 20th century meant most people who weren’t already in it. For most of the 20th century, working-class people tried hard to look middle class. You can see it in old photos. Few adults aspired to look dangerous in 1950.

But the rise of national corporations didn’t just compress us culturally. It compressed us economically too, and on both ends.

Along with giant national corporations, we got giant national labor unions. And in the mid 20th century the corporations cut deals with the unions where they paid over market price for labor. Partly because the unions were monopolies. [10] Partly because, as components of oligopolies themselves, the corporations knew they could safely pass the cost on to their customers, because their competitors would have to as well. And partly because in mid-century most of the giant companies were still focused on finding new ways to milk economies of scale. Just as startups rightly pay AWS a premium over the cost of running their own servers so they can focus on growth, many of the big national corporations were willing to pay a premium for labor. [11]

As well as pushing incomes up from the bottom, by overpaying unions, the big companies of the 20th century also pushed incomes down at the top, by underpaying their top management. Economist J. K. Galbraith wrote in 1967 that “There are few corporations in which it would be suggested that executive salaries are at a maximum.” [12]

Speaking Out Meant Standing Alone

To some extent this was an illusion.

Much of the de facto pay of executives never showed up on their income tax returns, because it took the form of perks. The higher the rate of income tax, the more pressure there was to pay employees upstream of it. (In the UK, where taxes were even higher than in the US, companies would even pay their kids’ private school tuitions.) One of the most valuable things the big companies of the mid 20th century gave their employees was job security, and this too didn’t show up in tax returns or income statistics. So the nature of employment in these organizations tended to yield falsely low numbers about economic inequality. But even accounting for that, the big companies paid their best people less than market price. There was no market; the expectation was that you’d work for the same company for decades if not your whole career. [13]

Your work was so illiquid there was little chance of getting market price. But that same illiquidity also encouraged you not to seek it. If the company promised to employ you till you retired and give you a pension afterward, you didn’t want to extract as much from it this year as you could. You needed to take care of the company so it could take care of you. Especially when you’d been working with the same group of people for decades. If you tried to squeeze the company for more money, you were squeezing the organization that was going to take care of them. Plus if you didn’t put the company first you wouldn’t be promoted, and if you couldn’t switch ladders, promotion on this one was the only way up. [14]

To someone who’d spent several formative years in the armed forces, this situation didn’t seem as strange as it does to us now. From their point of view, as big company executives, they were high-ranking officers. They got paid a lot more than privates. They got to have expense account lunches at the best restaurants and fly around on the company’s Gulfstreams. It probably didn’t occur to most of them to ask if they were being paid market price.

The ultimate way to get market price is to work for yourself, by starting your own company. That seems obvious to any ambitious person now. But in the mid 20th century it was an alien concept. Not because starting one’s own company seemed too ambitious, but because it didn’t seem ambitious enough. Even as late as the 1970s, when I grew up, the ambitious plan was to get lots of education at prestigious institutions, and then join some other prestigious institution and work one’s way up the hierarchy. Your prestige was the prestige of the institution you belonged to. People did start their own businesses of course, but educated people rarely did, because in those days there was practically zero concept of starting what we now call a startup: a business that starts small and grows big. That was much harder to do in the mid 20th century. Starting one’s own business meant starting a business that would start small and stay small. Which in those days of big companies often meant scurrying around trying to avoid being trampled by elephants. It was more prestigious to be one of the executive class riding the elephant.

By the 1970s, no one stopped to wonder where the big prestigious companies had come from in the first place.

Famous 1970s Logos: The Best 70s Logo Design Examples

It seemed like they’d always been there, like the chemical elements. And indeed, there was a double wall between ambitious kids in the 20th century and the origins of the big companies. Many of the big companies were roll-ups that didn’t have clear founders. And when they did, the founders didn’t seem like us. Nearly all of them had been uneducated, in the sense of not having been to college. They were what Shakespeare called rude mechanicals. College trained one to be a member of the professional classes. Its graduates didn’t expect to do the sort of grubby menial work that Andrew Carnegie or Henry Ford started out doing. [15]

And in the 20th century there were more and more college graduates. They increased from about 2% of the population in 1900 to about 25% in 2000. In the middle of the century our two big forces intersect, in the form of the GI Bill, which sent 2.2 million World War II veterans to college. Few thought of it in these terms, but the result of making college the canonical path for the ambitious was a world in which it was socially acceptable to work for Henry Ford, but not to be Henry Ford. [16]

I remember this world well. I came of age just as it was starting to break up. In my childhood it was still dominant. Not quite so dominant as it had been. We could see from old TV shows and yearbooks and the way adults acted that people in the 1950s and 60s had been even more conformist than us. The mid-century model was already starting to get old. But that was not how we saw it at the time. We would at most have said that one could be a bit more daring in 1975 than 1965. And indeed, things hadn’t changed much yet.

But change was coming soon.

And when the Duplo economy started to disintegrate, it disintegrated in several different ways at once. Vertically integrated companies literally dis-integrated because it was more efficient to. Incumbents faced new competitors as (a) markets went global and (b) technical innovation started to trump economies of scale, turning size from an asset into a liability. Smaller companies were increasingly able to survive as formerly narrow channels to consumers broadened. Markets themselves started to change faster, as whole new categories of products appeared. And last but not least, the federal government, which had previously smiled upon J. P. Morgan’s world as the natural state of things, began to realize it wasn’t the last word after all.

What J. P. Morgan was to the horizontal axis, Henry Ford was to the vertical. He wanted to do everything himself. The giant plant he built at River Rouge between 1917 and 1928 literally took in iron ore at one end and sent cars out the other. 100,000 people worked there. At the time it seemed the future. But that is not how car companies operate today. Now much of the design and manufacturing happens in a long supply chain, whose products the car companies ultimately assemble and sell. The reason car companies operate this way is that it works better. Each company in the supply chain focuses on what they know best. And they each have to do it well or they can be swapped out for another supplier.

Why didn’t Henry Ford realize that networks of cooperating companies work better than a single big company?

One reason is that supplier networks take a while to evolve. In 1917, doing everything himself seemed to Ford the only way to get the scale he needed. And the second reason is that if you want to solve a problem using a network of cooperating companies, you have to be able to coordinate their efforts, and you can do that much better with computers. Computers reduce the transaction costs that Coase argued are the raison d’etre of corporations. That is a fundamental change.

In the early 20th century, big companies were synonymous with efficiency. In the late 20th century they were synonymous with inefficiency. To some extent this was because the companies themselves had become sclerotic. But it was also because our standards were higher.

It wasn’t just within existing industries that change occurred. The industries themselves changed. It became possible to make lots of new things, and sometimes the existing companies weren’t the ones who did it best.

Microcomputers are a classic example.

Ms Dos 1.25 (1982)(Microsoft) Game

The market was pioneered by upstarts like Apple, Radio Shack and Atari. When it got big enough, IBM decided it was worth paying attention to. At the time IBM completely dominated the computer industry. They assumed that all they had to do, now that this market was ripe, was to reach out and pick it. Most people at the time would have agreed with them. But what happened next illustrated how much more complicated the world had become. IBM did launch a microcomputer. Though quite successful, it did not crush Apple. But even more importantly, IBM itself ended up being supplanted by a supplier coming in from the side—from software, which didn’t even seem to be the same business. IBM’s big mistake was to accept a non-exclusive license for DOS. It must have seemed a safe move at the time. No other computer manufacturer had ever been able to outsell them. What difference did it make if other manufacturers could offer DOS too? The result of that miscalculation was an explosion of inexpensive PC clones. Microsoft now owned the PC standard, and the customer. And the microcomputer business ended up being Apple vs Microsoft.

Basically, Apple bumped IBM and then Microsoft stole its wallet. That sort of thing did not happen to big companies in mid-century. But it was going to happen increasingly often in the future.

Change happened mostly by itself in the computer business. In other industries, legal obstacles had to be removed first. Many of the mid-century oligopolies had been anointed by the federal government with policies (and in wartime, large orders) that kept out competitors. This didn’t seem as dubious to government officials at the time as it sounds to us. They felt a two-party system ensured sufficient competition in politics. It ought to work for business too.

Gradually the government realized that anti-competitive policies were doing more harm than good, and during the Carter administration started to remove them.

The word used for this process was misleadingly narrow: deregulation. What was really happening was de-oligopolization. It happened to one industry after another. Two of the most visible to consumers were air travel and long-distance phone service, which both became dramatically cheaper after deregulation.

Deregulation also contributed to the wave of hostile takeovers in the 1980s. In the old days the only limit on the inefficiency of companies, short of actual bankruptcy, was the inefficiency of their competitors. Now companies had to face absolute rather than relative standards. Any public company that didn’t generate sufficient returns on its assets risked having its management replaced with one that would. Often the new managers did this by breaking companies up into components that were more valuable separately. [17]

Version 1 of the national economy consisted of a few big blocks whose relationships were negotiated in back rooms by a handful of executives, politicians, regulators, and labor leaders. Version 2 was higher resolution: there were more companies, of more different sizes, making more different things, and their relationships changed faster. In this world there were still plenty of back room negotiations, but more was left to market forces. Which further accelerated the fragmentation.

It’s a little misleading to talk of versions when describing a gradual process, but not as misleading as it might seem. There was a lot of change in a few decades, and what we ended up with was qualitatively different. The companies in the S&P 500 in 1958 had been there an average of 61 years. By 2012 that number was 18 years. [18]

The breakup of the Duplo economy happened simultaneously with the spread of computing power. To what extent were computers a precondition? It would take a book to answer that. Obviously the spread of computing power was a precondition for the rise of startups. I suspect it was for most of what happened in finance too. But was it a precondition for globalization or the LBO wave? I don’t know, but I wouldn’t discount the possibility. It may be that the refragmentation was driven by computers in the way the industrial revolution was driven by steam engines. Whether or not computers were a precondition, they have certainly accelerated it.

The new fluidity of companies changed people’s relationships with their employers. Why climb a corporate ladder that might be yanked out from under you? Ambitious people started to think of a career less as climbing a single ladder than as a series of jobs that might be at different companies. More movement (or even potential movement) between companies introduced more competition in salaries. Plus as companies became smaller it became easier to estimate how much an employee contributed to the company’s revenue. Both changes drove salaries toward market price. And since people vary dramatically in productivity, paying market price meant salaries started to diverge.

By no coincidence it was in the early 1980s that the term “yuppie” was coined. That word is not much used now, because the phenomenon it describes is so taken for granted, but at the time it was a label for something novel. Yuppies were young professionals who made lots of money. To someone in their twenties today, this wouldn’t seem worth naming. Why wouldn’t young professionals make lots of money? But until the 1980s being underpaid early in your career was part of what it meant to be a professional. Young professionals were paying their dues, working their way up the ladder. The rewards would come later. What was novel about yuppies was that they wanted market price for the work they were doing now.

The first yuppies did not work for startups.

AM2407 Spark blog: 1980s - The Yuppie

That was still in the future. Nor did they work for big companies. They were professionals working in fields like law, finance, and consulting. But their example rapidly inspired their peers. Once they saw that new BMW 325i, they wanted one too.

Underpaying people at the beginning of their career only works if everyone does it. Once some employer breaks ranks, everyone else has to, or they can’t get good people. And once started this process spreads through the whole economy, because at the beginnings of people’s careers they can easily switch not merely employers but industries.

But not all young professionals benefitted. You had to produce to get paid a lot. It was no coincidence that the first yuppies worked in fields where it was easy to measure that.

More generally, an idea was returning whose name sounds old-fashioned precisely because it was so rare for so long: that you could make your fortune. As in the past there were multiple ways to do it. Some made their fortunes by creating wealth, and others by playing zero-sum games. But once it became possible to make one’s fortune, the ambitious had to decide whether or not to. A physicist who chose physics over Wall Street in 1990 was making a sacrifice that a physicist in 1960 wasn’t.

The idea even flowed back into big companies. CEOs of big companies make more now than they used to, and I think much of the reason is prestige. In 1960, corporate CEOs had immense prestige. They were the winners of the only economic game in town. But if they made as little now as they did then, in real dollar terms, they’d seem like small fry compared to professional athletes and whiz kids making millions from startups and hedge funds. They don’t like that idea, so now they try to get as much as they can, which is more than they had been getting. [19]

Meanwhile a similar fragmentation was happening at the other end of the economic scale. As big companies’ oligopolies became less secure, they were less able to pass costs on to customers and thus less willing to overpay for labor. And as the Duplo world of a few big blocks fragmented into many companies of different sizes—some of them overseas—it became harder for unions to enforce their monopolies. As a result workers’ wages also tended toward market price. Which (inevitably, if unions had been doing their job) tended to be lower. Perhaps dramatically so, if automation had decreased the need for some kind of work.

And just as the mid-century model induced social as well as economic cohesion, its breakup brought social as well as economic fragmentation. People started to dress and act differently. Those who would later be called the “creative class” became more mobile. People who didn’t care much for religion felt less pressure to go to church for appearances’ sake, while those who liked it a lot opted for increasingly colorful forms. Some switched from meat loaf to tofu, and others to Hot Pockets. Some switched from driving Ford sedans to driving small imported cars, and others to driving SUVs. Kids who went to private schools or wished they did started to dress “preppy,” and kids who wanted to seem rebellious made a conscious effort to look disreputable. In a hundred ways people spread apart. [20]

Almost four decades later, fragmentation is still increasing.

Has it been net good or bad? I don’t know; the question may be unanswerable. Not entirely bad though. We take for granted the forms of fragmentation we like, and worry only about the ones we don’t. But as someone who caught the tail end of mid-century conformism, I can tell you it was no utopia. [21]

My goal here is not to say whether fragmentation has been good or bad, just to explain why it’s happening. With the centripetal forces of total war and 20th century oligopoly mostly gone, what will happen next? And more specifically, is it possible to reverse some of the fragmentation we’ve seen?

If it is, it will have to happen piecemeal. You can’t reproduce mid-century cohesion the way it was originally produced. It would be insane to go to war just to induce more national unity. And once you understand the degree to which the economic history of the 20th century was a low-res version 1, it’s clear you can’t reproduce that either.

20th century cohesion was something that happened at least in a sense naturally. The war was due mostly to external forces, and the Duplo economy was an evolutionary phase. If you want cohesion now, you’d have to induce it deliberately. And it’s not obvious how. I suspect the best we’ll be able to do is address the symptoms of fragmentation. But that may be enough.

The form of fragmentation people worry most about lately is economic inequality, and if you want to eliminate that you’re up against a truly formidable headwind—one that has been in operation since the stone age: technology. Technology is a lever. It magnifies work. And the lever not only grows increasingly long, but the rate at which it grows is itself increasing.

Which in turn means the variation in the amount of wealth people can create has not only been increasing, but accelerating.

The unusual conditions that prevailed in the mid 20th century masked this underlying trend. The ambitious had little choice but to join large organizations that made them march in step with lots of other people—literally in the case of the armed forces, figuratively in the case of big corporations. Even if the big corporations had wanted to pay people proportionate to their value, they couldn’t have figured out how. But that constraint has gone now. Ever since it started to erode in the 1970s, we’ve seen the underlying forces at work again. [22]

Not everyone who gets rich now does it by creating wealth, certainly. But a significant number do, and the Baumol Effect means all their peers get dragged along too. [23] And as long as it’s possible to get rich by creating wealth, the default tendency will be for economic inequality to increase. Even if you eliminate all the other ways to get rich. You can mitigate this with subsidies at the bottom and taxes at the top, but unless taxes are high enough to discourage people from creating wealth, you’re always going to be fighting a losing battle against increasing variation in productivity. [24]

That form of fragmentation, like the others, is here to stay. Or rather, back to stay. Nothing is forever, but the tendency toward fragmentation should be more forever than most things, precisely because it’s not due to any particular cause. It’s simply a reversion to the mean. When Rockefeller said individualism was gone, he was right for a hundred years. It’s back now, and that’s likely to be true for longer.

I worry that if we don’t acknowledge this, we’re headed for trouble.

If we think 20th century cohesion disappeared because of few policy tweaks, we’ll be deluded into thinking we can get it back (minus the bad parts, somehow) with a few countertweaks. And then we’ll waste our time trying to eliminate fragmentation, when we’d be better off thinking about how to mitigate its consequences.

Notes

[1] Lester Thurow, writing in 1975, said the wage differentials prevailing at the end of World War II had become so embedded that they “were regarded as ‘just’ even after the egalitarian pressures of World War II had disappeared. Basically, the same differentials exist to this day, thirty years later.” But Goldin and Margo think market forces in the postwar period also helped preserve the wartime compression of wages—specifically increased demand for unskilled workers, and oversupply of educated ones.

(Oddly enough, the American custom of having employers pay for health insurance derives from efforts by businesses to circumvent NWLB wage controls in order to attract workers.)

[2] As always, tax rates don’t tell the whole story. There were lots of exemptions, especially for individuals. And in World War II the tax codes were so new that the government had little acquired immunity to tax avoidance. If the rich paid high taxes during the war it was more because they wanted to than because they had to.

After the war, federal tax receipts as a percentage of GDP were about the same as they are now.

In fact, for the entire period since the war, tax receipts have stayed close to 18% of GDP, despite dramatic changes in tax rates. The lowest point occurred when marginal income tax rates were highest: 14.1% in 1950. Looking at the data, it’s hard to avoid the conclusion that tax rates have had little effect on what people actually paid.

[3] Though in fact the decade preceding the war had been a time of unprecedented federal power, in response to the Depression. Which is not entirely a coincidence, because the Depression was one of the causes of the war. In many ways the New Deal was a sort of dress rehearsal for the measures the federal government took during wartime. The wartime versions were much more drastic and more pervasive though. As Anthony Badger wrote, “for many Americans the decisive change in their experiences came not with the New Deal but with World War II.”

[4] I don’t know enough about the origins of the world wars to say, but it’s not inconceivable they were connected to the rise of big corporations. If that were the case, 20th century cohesion would have a single cause.

[5] More precisely, there was a bimodal economy consisting, in Galbraith’s words, of “the world of the technically dynamic, massively capitalized and highly organized corporations on the one hand and the hundreds of thousands of small and traditional proprietors on the other.” Money, prestige, and power were concentrated in the former, and there was near zero crossover.

[6] I wonder how much of the decline in families eating together was due to the decline in families watching TV together afterward.

[7] I know when this happened because it was the season Dallas premiered. Everyone else was talking about what was happening on Dallas, and I had no idea what they meant.

[8] I didn’t realize it till I started doing research for this essay, but the meretriciousness of the products I grew up with is a well-known byproduct of oligopoly. When companies can’t compete on price, they compete on tailfins.

[9] Monroeville Mall was at the time of its completion in 1969 the largest in the country. In the late 1970s the movie Dawn of the Dead was shot there. Apparently the mall was not just the location of the movie, but its inspiration; the crowds of shoppers drifting through this huge mall reminded George Romero of zombies. My first job was scooping ice cream in the Baskin-Robbins.

[10] Labor unions were exempted from antitrust laws by the Clayton Antitrust Act in 1914 on the grounds that a person’s work is not “a commodity or article of commerce.” I wonder if that means service companies are also exempt.

[11] The relationships between unions and unionized companies can even be symbiotic, because unions will exert political pressure to protect their hosts. According to Michael Lind, when politicians tried to attack the A&P supermarket chain because it was putting local grocery stores out of business, “A&P successfully defended itself by allowing the unionization of its workforce in 1938, thereby gaining organized labor as a constituency.” I’ve seen this phenomenon myself: hotel unions are responsible for more of the political pressure against Airbnb than hotel companies.

[12] Galbraith was clearly puzzled that corporate executives would work so hard to make money for other people (the shareholders) instead of themselves. He devoted much of The New Industrial State to trying to figure this out.

His theory was that professionalism had replaced money as a motive, and that modern corporate executives were, like (good) scientists, motivated less by financial rewards than by the desire to do good work and thereby earn the respect of their peers. There is something in this, though I think lack of movement between companies combined with self-interest explains much of observed behavior.

[13] Galbraith (p. 94) says a 1952 study of the 800 highest paid executives at 300 big corporations found that three quarters of them had been with their company for more than 20 years.

[14] It seems likely that in the first third of the 20th century executive salaries were low partly because companies then were more dependent on banks, who would have disapproved if executives got too much. This was certainly true in the beginning. The first big company CEOs were J. P. Morgan’s hired hands.

Companies didn’t start to finance themselves with retained earnings till the 1920s. Till then they had to pay out their earnings in dividends, and so depended on banks for capital for expansion. Bankers continued to sit on corporate boards till the Glass-Steagall act in 1933.

By mid-century big companies funded 3/4 of their growth from earnings. But the early years of bank dependence, reinforced by the financial controls of World War II, must have had a big effect on social conventions about executive salaries. So it may be that the lack of movement between companies was as much the effect of low salaries as the cause.

Incidentally, the switch in the 1920s to financing growth with retained earnings was one cause of the 1929 crash. The banks now had to find someone else to lend to, so they made more margin loans.

[15] Even now it’s hard to get them to. One of the things I find hardest to get into the heads of would-be startup founders is how important it is to do certain kinds of menial work early in the life of a company. Doing things that don’t scale is to how Henry Ford got started as a high-fiber diet is to the traditional peasant’s diet: they had no choice but to do the right thing, while we have to make a conscious effort.

[16] Founders weren’t celebrated in the press when I was a kid. “Our founder” meant a photograph of a severe-looking man with a walrus mustache and a wing collar who had died decades ago. The thing to be when I was a kid was an executive. If you weren’t around then it’s hard to grasp the cachet that term had. The fancy version of everything was called the “executive” model.

[17] The wave of hostile takeovers in the 1980s was enabled by a combination of circumstances: court decisions striking down state anti-takeover laws, starting with the Supreme Court’s 1982 decision in Edgar v. MITE Corp.; the Reagan administration’s comparatively sympathetic attitude toward takeovers; the Depository Institutions Act of 1982, which allowed banks and savings and loans to buy corporate bonds; a new SEC rule issued in 1982 (rule 415) that made it possible to bring corporate bonds to market faster; the creation of the junk bond business by Michael Milken; a vogue for conglomerates in the preceding period that caused many companies to be combined that never should have been; a decade of inflation that left many public companies trading below the value of their assets; and not least, the increasing complacency of managements.

[18] Foster, Richard. “Creative Destruction Whips through Corporate America.” Innosight, February 2012.

[19] CEOs of big companies may be overpaid. I don’t know enough about big companies to say. But it is certainly not impossible for a CEO to make 200x as much difference to a company’s revenues as the average employee. Look at what Steve Jobs did for Apple when he came back as CEO. It would have been a good deal for the board to give him 95% of the company. Apple’s market cap the day Steve came back in July 1997 was 1.73 billion. 5% of Apple now (January 2016) would be worth about 30 billion. And it would not be if Steve hadn’t come back; Apple probably wouldn’t even exist anymore.

Merely including Steve in the sample might be enough to answer the question of whether public company CEOs in the aggregate are overpaid. And that is not as facile a trick as it might seem, because the broader your holdings, the more the aggregate is what you care about.

[20] The late 1960s were famous for social upheaval. But that was more rebellion (which can happen in any era if people are provoked sufficiently) than fragmentation. You’re not seeing fragmentation unless you see people breaking off to both left and right.

[21] Globally the trend has been in the other direction. While the US is becoming more fragmented, the world as a whole is becoming less fragmented, and mostly in good ways.

[22] There were a handful of ways to make a fortune in the mid 20th century. The main one was drilling for oil, which was open to newcomers because it was not something big companies could dominate through economies of scale. How did individuals accumulate large fortunes in an era of such high taxes? Giant tax loopholes defended by two of the most powerful men in Congress, Sam Rayburn and Lyndon Johnson.

But becoming a Texas oilman was not in 1950 something one could aspire to the way starting a startup or going to work on Wall Street were in 2000, because (a) there was a strong local component and (b) success depended so much on luck.

[23] The Baumol Effect induced by startups is very visible in Silicon Valley. Google will pay people millions of dollars a year to keep them from leaving to start or join startups.

[24] I’m not claiming variation in productivity is the only cause of economic inequality in the US. But it’s a significant cause, and it will become as big a cause as it needs to, in the sense that if you ban other ways to get rich, people who want to get rich will use this route instead.

Thanks to Sam Altman, Trevor Blackwell, Paul Buchheit, Patrick Collison, Ron Conway, Chris Dixon, Benedict Evans, Richard Florida, Ben Horowitz, Jessica Livingston, Robert Morris, Tim O’Reilly, Geoff Ralston, Max Roser, Alexia Tsotsis, and Qasar Younis for reading drafts of this. Max also told me about several valuable sources. Essay from http://paulgraham.com/re.html

Bibliography

Allen, Frederick Lewis. The Big Change. Harper, 1952.

Averitt, Robert. The Dual Economy. Norton, 1968.

Badger, Anthony. The New Deal. Hill and Wang, 1989.

Bainbridge, John. The Super-Americans. Doubleday, 1961.

Beatty, Jack. Collossus. Broadway, 2001.

Brinkley, Douglas. Wheels for the World. Viking, 2003.

Brownleee, W. Elliot. Federal Taxation in America. Cambridge, 1996.

Chandler, Alfred. The Visible Hand. Harvard, 1977.

Chernow, Ron. The House of Morgan. Simon & Schuster, 1990.

Chernow, Ron. Titan: The Life of John D. Rockefeller. Random House, 1998.

Galbraith, John. The New Industrial State. Houghton Mifflin, 1967.

Goldin, Claudia and Robert A. Margo. “The Great Compression: The Wage Structure in the United States at Mid-Century.” NBER Working Paper 3817, 1991.

Gordon, John. An Empire of Wealth. HarperCollins, 2004.

Klein, Maury. The Genesis of Industrial America, 1870-1920. Cambridge, 2007.

Lind, Michael. Land of Promise. HarperCollins, 2012.

Mickelthwaite, John, and Adrian Wooldridge. The Company. Modern Library, 2003.

Nasaw, David. Andrew Carnegie. Penguin, 2006.

Sobel, Robert. The Age of Giant Corporations. Praeger, 1993.

Thurow, Lester. Generating Inequality: Mechanisms of Distribution. Basic Books, 1975.

Witte, John. The Politics and Development of the Federal Income Tax. Wisconsin, 1985.


World Economic Forum- Why Experts Expect Global Growth

82% of chief economists expect the global economy to remain stable or strengthen this year – almost twice as many as in late 2023
Over two-thirds predict a sustained rebound of global growth, driven by technological transformation, artificial intelligence and the green transition.
There is near-unanimity that geopolitics and domestic politics will drive economic volatility this year. Read the May 2024 Chief Economist Outlook here

Geneva, Switzerland,May 2024 – The latest Chief Economists Outlook released today presents a growing sense of cautious optimism about the global economy in 2024. More than eight in ten chief economists expect the global economy to either strengthen or remain stable this year – nearly double the proportion in the previous report. The share of those predicting a downturn in global conditions declined from 56% in January to 17%.
 
But geopolitical and domestic political tensions cloud the horizon. Some 97% of respondents anticipate that geopolitics will contribute to global economic volatility this year. A further 83% said domestic politics will be a source of volatility in 2024, a year when nearly half the world’s population is voting.
 
“The latest Chief Economists Outlook points to welcome but tentative signs of improvement in the global economic climate,” said Saadia Zahidi, Managing Director, World Economic Forum. “This underscores the increasingly complex landscape that leaders are navigating. There is an urgent need for policy-making that not only looks to revive the engines of the global economy but also seeks to put in place the foundations of more inclusive, sustainable and resilient growth.”
 
Regional variations
 
Growth expectations have improved, though unevenly, across the globe. The survey reveals a significant boost in the outlook for the United States, where nearly all chief economists (97%) now expect moderate to strong growth this year, up from 59% in January.
 
Asian economies also appear robust, with all respondents projecting at least moderate growth in the South Asia and East Asia and Pacific regions. Expectations for China are slightly less optimistic, with three-quarters expecting moderate growth and only 4% predicting strong growth this year.
 
By contrast, the outlook for Europe remains gloomy, with nearly 70% of economists predicting weak growth for the remainder of 2024. Other regions are expected to experience broadly moderate growth, with a slight improvement since the previous survey.


A challenging landscape for decision-makers
 
The latest survey highlights the escalating challenges confronting businesses and policy-makers. Tensions between political and economic dynamics will be a growing challenge for decision-makers this year, according to 86% of respondents, while 79% expect heightened complexity to weigh on decision-making.
 
Among the factors expected to affect corporate decision-making are the overall health of the global economy (cited by 100%), monetary policy (86%), financial markets (86%), labour market conditions (79%), geopolitics (86%) and domestic politics (71%). Notably, 73% of economists believe that companies’ growth objectives will drive decision-making, almost double the proportion that cited the role of companies’ environmental and social goals (37%).
 
Long-term prospects and priorities
 
Most chief economists are upbeat about the prospects for a sustained rebound in global growth, with nearly 70% expecting a return to 4% growth in the next five years (42% within three years). In high-income countries, they expect growth to be driven by technological transformation, artificial intelligence, and the green and energy transition. However, opinions are divided on the impact of these factors in low-income economies. There is greater consensus on the factors that will be a drag on growth, with geopolitics, domestic politics, debt levels, climate change and social polarization expected to dampen growth in both high- and low-income economies.


In terms of the policy levers most likely to foster growth in the next five years, the most important across the board are innovation, infrastructure development, monetary policy, and education and skills. Low-income economies are seen as having more to gain from interventions relating to institutions, social services and access to finance compared to high-income economies. There is a notable lack of consensus on the impact for growth of environmental and industrial policies.
 
About the Chief Economists Outlook Report
The Chief Economists Outlook builds on the latest policy development research as well as consultations and surveys with leading chief economists from both the public and private sectors, organized by the World Economic Forum’s Centre for the New Economy and Society. It aims to summarize the emerging contours of the current economic environment and identify priorities for further action by policy-makers and business leaders in response to the compounding shocks to the global economy. The survey featured in this briefing was conducted in April 2024.
 
The Chief Economists Outlook supports the World Economic Forum’s Future of Growth Initiative, a two-year campaign aimed at inspiring discussion and action on charting new pathways for economic growth and supporting policy-makers in balancing growth, innovation, inclusion, sustainability and resilience goals. Learn more about the Future of Growth Initiative here.
The World Economic Forum, committed to improving the state of the world, is the International Organization for Public-Private Cooperation. The Forum engages the foremost political, business and other leaders of society to shape global, regional and industry agendas. (www.weforum.org).

Canada Debt Becoming Unmanageable Economists Warn

With the Canadian government’s high debt-to-GDP ratios, such as a ratio of debt to nominal GDP sitting at 68 percent in March 2023, economists warn that government debt could become unsustainably high if Ottawa fails to reduce spending, increase productivity, and re-establish business confidence.

“We’re not growing our income per capita, which means that we’re not going to get the tax revenues that we need, plus we’re getting a lot of people retiring. So the situation could end up becoming quite unmanageable if we keep our pace that we’re going,” said Jack Mintz, president’s fellow at the University of Calgary’s School of Public Policy.

The federal government has run back-to-back budget deficits since the 2008 financial recession, with government spending spiking during the COVID-19 pandemic. As a result, Canada’s debt as a percentage of nominal GDP rose from around 51 percent in 2009 to 74 percent by 2021, for example. Nominal refers to the current value for the particular year without taking inflation into account.

The two previous federal budgets have attempted to lower government spending, but the federal government will still post a $40 billion deficit in 2023–24, which they project will shrink to a $20 billion deficit by 2028–29.

The Liberal government’s response to criticism by the opposition that Canada’s debt could lead the country into a financial crisis has been that Canada has among the best debt-to-GDP ratios in the G7.

According to Mr. Mintz, while Canada’s debt situation is not as bad as it once was, it doesn’t mean that it may not impact Canada’s prosperity prospects.

Conrad Black: Budget 2024 Is an Assault on Canadian Investment

ANALYSIS: Higher Income Taxes Not Only for Wealthy in Budget 2024

Mr. Mintz points out that Canada’s debt situation is not nearly as bad as in 1996. The government’s ratio of debt to nominal GDP ratio reached 83 percent that year.

Mr. Mintz also noted that Canada continues to have a triple-A credit rating according to the world’s leading credit agencies, meaning the country’s debt is not yet seen as problematic.

“We’re still viewed as having a much better credit line compared to a number of other countries. … But at some point, the credit agencies might look at that gross debt number and start asking the question, ‘Is it starting to become unsustainable?’” he said.

Lower Productivity Hampering Debt Payments

The federal government’s ability to pay off its debt could be hampered by low productivity, according to Steve Ambler, professor emeritus of economics at Université du Québec à Montréal.

“The thing that worries me in terms of federal government debt is we are currently in a period of extremely low productivity growth and low overall growth,” he said.

In March, the Bank of Canada’s senior deputy governor Carolyn Rogers warned that Canada’s poor productivity had reached emergency levels.

Although Statistics Canada said the country’s labour productivity showed a small gain at the end of 2023, that came after six consecutive quarters of productivity decline.

The right honourable Jean Chrétien.

Mr. Ambler said an appropriate way to lower the debt-to-GDP ratio is to keep government spending from increasing while also raising productivity to increase tax revenues. He said this was the strategy of Prime Minister Jean Chrétien, whose Liberal government established a budget surplus in three years by growing the economy and keeping government spending stagnant.

To lower Canada’s debt-to-GDP ratio, Mr. Ambler said the government should focus on increasing worker productivity, allowing its resource sector to grow, and easing back on discretionary spending.

He also cited a November 2023 C.D. Howe paper showing that business investment per worker in Canada has shrunk relative to the United States since 2015. Investments such as better tools for workers would increase productivity, while productivity growth would in turn create opportunities and competitive threats that spur businesses to invest, the paper said.

“Re-establishing business confidence would be almost the number one priority, especially in the resource sector,” Mr. Ambler said, adding that a future government might also be wise to lower the feds’ “wildly extravagant subsidy programs” for the electric vehicle (EV) sector.

The Liberal government has given tens of billions of dollars in subsidies for EV manufacturing projects in Canada since 2020, saying the factories will eventually create thousands of new jobs.

‘No Cushion’ to Mitigate Debt Issue

Joseph Barbuto, director of research at the Economic Longwave Research Group, has a more pessimistic view of Canada’s debt. He says that while federal debt is at levels similar to the 1990s, the crisis will be “larger” because the government does not have the “fiscal room to mitigate the downturn.”

Mr. Barbuto said that while the Canadian government was able to help alleviate its debt issues in the 1930s and 1990s by lowering its interest rates, it does not have that same luxury in 2024. The Bank of Canada lowered its key policy rate from 1.25 percent to 0.25 percent in 2020, and was forced to raise it to 5 percent by 2023 in response to rising inflation.

“There’s no interest rate cushion on the other side. Interest rates can only fall back to zero,” Mr. Barbuto said, noting that higher interest rates make it more difficult for governments to service their debt.

“The problem with the monetary system is there’s no fiscal discipline that is pushed on governments, unlike [individuals] or corporations,” he said.

“There will be a point where because of the accumulated interest with rising interest rates, eventually it’s going to overwhelm the government and then people will not lend the government any kind of capital.”

Mr. Barbuto also expressed concern over Canada’s private debt-to-GDP ratio. Private debt refers to debt owed by private, non-financial entities such as businesses and households, as opposed to public debt owed by governments and banks. Canada’s ratio of private debt to nominal GDP sat at 217 percent in December 2023 compared to 124 percent in 1995.

Mr. Barbuto said Canada’s private debt-to-GDP ratio is higher than that of Japan’s in the 1990s, and pointed out that the Japanese economy had stagnated after the country’s asset price bubble burst in 1992.

The research director believes the Canadian economy will eventually see a debt crisis and collapse in real estate that will result in austerity measures, a shrinkage in the size of government, and the “creative destruction” of the old political and economic system. He said this would be the continuation of an economic cycle that has repeatedly happened throughout history.

“[It’s] inevitable and necessary. A debt detox or deleveraging is the same thing as a drug detox. Nobody likes it, … but it’s a necessary part of the cycle for it then to go back up,” he said.

For the Silo, Matthew Horwood/Epoch Times.

Beware Of Overreach In Canada Competition Law Reforms

May, 2024 – Many of the federal government’s recent reforms in competition law sensibly strengthen the enforcement powers of the Competition Bureau and private actors seeking redress for allegedly anti-competitive behavior. However, amendments to the Competition Act that simply make it easier to meet legal tests for orders against allegedly anti-competitive conduct are over-reach, says a new report by our friends at the C.D. Howe Institute.

In “Uncertainty and the Burden of Proof in Canadian Competition Law,” author Edward M. Iacobucci, a professor in corporate and competition law at the University of Toronto and Competition Policy Scholar at the C.D. Howe Institute, says that while strengthening the enforcement powers of the Competition Bureau is welcome, other amendments to the Competition Act imply more profound changes to the fundamental posture of competition law.

Specifically, there is a family of amendments and proposals to move away from the bedrock principle that the burden rests with the Bureau to prove, on a balance of responsibilities, that a merger or practice by a dominant firm is likely to be or is anti-competitive. 

For example, the author argues that lowering the burden of proof in mergers cases to “appreciable risk” of anti-competitive effects or something analogous would be a mistake.

“The overwhelming problem with this standard is that it is too easy to meet and fails to distinguish anti-competitive from benign conduct,” he states.  He also disagrees with proposals to rely on market shares rather than competitive assessments in mergers cases.  He objects in addition to abolishing the requirement to analyze anti-competitive effects in abuse of dominant position cases – recent amendments imply that pro-competitive conduct could be treated as an abuse of dominance.

Aside from competition law reform, the author notes that there are other policy reforms that could promote competition. 

 “Assuming competition has worsened in Canada, there are several remedial policies that I suspect would be far more important than competition law reform,” he says. “The OECD ranks Canada near the worst internationally in establishing regulatory barriers to competition.” 

 Regulation, internal trade barriers, restrictions on international competition and ownership, and other policies are all important contributors to reducing competition in Canada and, certainly in their collective impact, are more important than competition law, he argues.

Nevertheless, there are good reasons to take stock of Canadian competition law.

“The vulnerability of digital markets to market power stemming from network externalities and scale economies encourages reflection on whether the Competition Act continues to be suitable for present times.”

“I am skeptical of the narrative that the law requires sweeping reform to address the digital economy or to reverse a strong, secular decline in competition caused by competition law,” Iacobucci added. “But I am not skeptical that there is room for improvement. I encourage the government to focus on strengthening enforcement and to resist and even reverse recent reforms to the burden of proof.”

For The Silo, Edward M. Iacobucci, TSE Chair in Capital Markets, Faculty of Law, University of Toronto and C.D. Howe Competition Policy Scholar.

Read the full report here.

Study in Brief:

• There are good reasons to take stock of Canadian competition law. The vulnerability of digital markets to market power stemming from network externalities and scale economies encourages reflection on whether the Competition Act continues to be suitable for present times.

• Recently, a number of statutory amendments have been proposed to amend the Act, some have been tabled in Parliament and still others already adopted. The federal government recently passed consequential amendments that grant the Minister of Innovation, Science and Economic Development (ISED) the power to initiate market studies, to include scrutiny of vertical agreements as possibly anti-competitive collaborations, to repeal the efficiencies defence to mergers, and to lower the burden of proof in abuse of dominance cases.

• Many of the government’s actions to date sensibly strengthen the enforcement powers of the Competition Bureau and make it easier for private actors seeking redress for allegedly anti-competitive behaviour.

• There are, however, other actual and proposed amendments that imply profound changes to the fundamental posture of Canadian competition law. In particular there are actual and proposed amendments that move away from the bedrock principle that the burden rests with the Bureau to prove, on a balance of probabilities, that a merger or practice by a dominant firm is likely to be or is anti-competitive.

• While enhancing enforcement is welcome, legislative amendments that lower the burden of proof are a mistake.

How Canada Can Help Repair Today’s Global Trading System

The article below (Furthering the Benefits of Global Economic Integration through
Institution Building: Canada as 2024 Chair of CPTPP) was first published by the C.D. Howe Institute by Paul Jenkins and Mark Kruger.

Introduction

Over the last 10 to 15 years, the global economy has become fragmented. There are many reasons for this fragmentation – both economic and geopolitical. A particularly important factor has been the inability of the institutions that provide the governance framework for international trade and finance to adapt to the changing realities of the global economy.

This erosion is reflected in the cycles of outcome-based measures of globalization, such as trade-to-GDP ratios. Research indicates that the development of institutions that promote global integration is highly correlated with more rapid economic growth. To secure the benefits of economic integration, the international community should re-commit to a set of common rules. This should involve the renewal of existing institutions in line with current economic realities.


But institutional renewal alone is not sufficient. Nurturing and growing new institutions are also critical, especially ones reflecting the realities of today’s global economy. Most promising in this regard is the Comprehensive and Progressive Agreement for Trans-Pacific Partnership (CPTPP).


The CPTPP is seen as a “next generation” trade agreement. It takes World Trade Organization (WTO) rules further in several key areas, such as electronic commerce, intellectual property, and state-owned enterprises.
Expansion of CPTPP represents a unique opportunity to strengthen global trade rules, deepen global economic cooperation on trade and sustain an open global trading system. The benefits for Canada of an expanded CPTPP are further diversification of its export markets and deepened ties with countries in the Indo-Pacific region.

Trusted Policy Intelligence


The challenge to enabling broad-based accession to CPTPP is geopolitical, reflecting the rising aspirations of the developing world, the associated
heightened contest between democracy and autocracy, and the prioritization of security. Indeed, for many, today’s security concerns are at the forefront, trumping economic issues. We argue that recognition of the economic benefits
of global economic integration must also remain at the forefront, and that research presented in this paper shows that institutional building is at the core
of securing such benefits.


As 2024 Chair of the CPTPP Commission, Canada has an opportunity to play a leadership role, as it did in the creation of the Bretton Woods institutions 80 years ago, by again promoting global institution building, this time through the successful accession of countries to the CPTPP, both this year and over the long run.

  1. Cycles in Global Economic Integration
    Former US Fed Chair Bernanke points out that the process of global economic integration has been going on for centuries. New technologies have been a major force in linking economies and markets but the process has not been a smooth and steady one. Rather, there have been waves of integration, dis-integration, and re-integration.
    Before World War I, the global economy was connected by extensive international trade, investment, and financial flows. Improved transportation – steamships, railways and canals – and communication – international mail and the telegraph – facilitated this “first era of globalization.” The gold standard linked countries financially and promoted currency stability. Trade barriers were reduced by the adoption of standardized customs procedures and trade regulations. The movement of goods, capital, and people was relatively unrestricted.
    The outbreak of World War I frayed global economic ties and set the stage for a more fragmented interwar period. The Treaty of Versailles imposed
    punitive measures on Germany, exacerbating economic hardships. Protectionist policies, such as high tariffs and competitive devaluations, became widespread as countries prioritized domestic interests.
    The collapse of the gold standard further destabilized international finance. In contrast to the cooperation seen before the war, countries pursued economic nationalism and isolationism.
    Protectionism increased in the 1930s as a result of the dislocation caused by the Great Depression. In an attempt to shield domestic industries from foreign competition and address soaring unemployment, many countries imposed tariffs and trade barriers.
    The Smoot-Hawley Tariff Act in the United States exemplified this trend, triggering a series of beggar-thy-neighbour policies. These protectionist policies exacerbated the downturn and contributed to a contraction in international trade that worsened the severity and duration of the Great Depression.
    Mindful of the lessons of the 1930s, a more liberal economic order was established in the aftermath of World War II. The creation of the Bretton Woods Institutions – the International Monetary Fund (IMF), the World Bank and the General Agreement on Tariffs and Trade (GATT) – provided the principal mechanisms for managing and governing the global economy over the second half of the 20th century.
    Building on the GATT, the formation of the World Trade Organization in 1995 provided the institutional framework for overseeing international trade and settling disputes. China became the 143rd member of the WTO in 2001 and almost all global trade became subject to a common set of rules.
    The rise and fall of international economic governance are reflected in the cycles of outcome-based measures of globalization. Looking at trade openness, i.e., the sum of exports and imports as a percentage of GDP, the IMF divides the process of global integration into five periods: (i) the
    industrialization era, (ii) the interwar era, (iii) the Bretton Woods era, (iv) the liberalization era, and (v) “slowbalization” (Figure 1).
    Many factors have contributed to the plateauing of trade openness in the last 10 to 15 years. The fallout from the Global Financial Crisis was severe and the recovery was tepid. Brexit, with its inward-looking perspective, has disengaged the UK from Europe.
    Populist protectionism has led to “re-shoring” in an effort to address rising inequalities and labour’s falling share of national income. There has been far-reaching cyclical and structural fallout from COVID-19.
    And while the AI revolution portends significant opportunities, uncertainties over labour displacement abound.
    Geopolitics has also played a critical role. Security concerns have become more important, trumping economic issues in the eyes of many. This has led to multiple sanctions, along with export and investment controls, being imposed to protect national security interests.
    The IMF has carried out several modelling exercises that estimate the consequences of fragmentation if further trade and technology barriers were to be imposed. The studies employ a variety of assumptions regarding trade restrictions and technology de-coupling. In summary, the cost of further fragmentation ranges from 1.5 to 6.9 percent of global GDP. As with all modelling exercises, a degree of caution is warranted. At the same time, these studies should not be viewed as upper-bound estimates because they disregard many other transmission channels of global economic integration.
  2. De Jure and De Facto Globalization
    In assessing the evolution of globalization, however, it would be misleading to focus too narrowly on outcome-based measures such as the trade-to-GDP ratio depicted in Figure 1.
    The data compiled by KOF, a Swiss research institute, provide a more nuanced view of global economic integration. KOF constructs globalization
    indices that measure integration across economic, social, and political dimensions. Its globalization indices are among the most widely used in academic literature. KOF’s data set covers 203 countries over the period 1970 to 2021. Our focus here is on KOF’s economic indices.
    In terms of economic globalization, KOF looks at the evolution of finance as well as trade. Moreover, one of the unique aspects of KOF’s work is that it examines globalization on both de facto and de jure bases.
    KOF’s de facto globalization indices measure actual international flows and activities. In terms of trade, it includes cross-border goods and services flows and trading partner diversity. For financial globalization, its indices measure stocks of international assets and liabilities as well as cross-border payments and receipts.
    KOF’s de jure globalization indices try to capture the policies and conditions that, in principle, foster these flows and activities. For trade globalization,
    these include income from taxes on trade, non-tariff barriers, tariffs, and trade agreements. De jure financial globalization is designed to measure the institutional openness of a country to international financial flows and investments. Variables to measure capital account openness, investment restrictions and international agreements and treaties with investment provisions are included in these indices.
    The trends in KOF’s de facto and de jure economic globalization indices are shown in Figure 2. Both globalization measures increased rapidly from 1990
    until the Global Financial Crisis. Both measures subsequently plateaued. In 2020, as the global pandemic took hold, the de facto index plunged to its
    lowest level since 2011. In 2021, it recovered half of the distance it lost the previous year. The de jure index has essentially been flat for the last decade.
    There has been a sharp divergence between KOF’s de facto and de jure trade globalization measures in the last five years (Figure 3). By 2020, de facto trade globalization had dropped to a 25-year low. Although it recovered somewhat in 2021, it remains well below the average of the last decade. In contrast, de jure trade globalization levelled off after the Global Financial
    Crisis. It reached a modest new high in 2019 and has essentially remained there since then.
    The trends in financial globalization are almost the reverse of those of trade globalization. De facto financial globalization continued to increase through
    2020 and dipped slightly in 2021. De jure financial globalization has been essentially flat over the last two decades (Figure 4).
    The KOF researchers provide convincing econometric evidence that economic globalization supports per capita GDP growth. Importantly,
    their analysis shows that institutions matter. They demonstrate that the positive impact on growth from trade and financial globalization comes from
    institutional liberalization rather than greater economic flows. Through a series of panel regressions, the researchers show that it is the de jure trade and financial globalization indices that are correlated with more rapid per capita GDP growth. In contrast, there is no significant relationship between growth and the de facto indices.
    KOF’s conclusions are consistent with the work of Rodrik, Subramanian and Trebbi who examine the contributions of institutions, geography, and trade
    in determining relative income levels around the world. They find that institutional quality “trumps everything else.” Once institutions are controlled for, conventional measures of geography have weak effects on incomes and the contribution of trade is generally not significant.
    Thus, to recapture the economic benefits of free trade and open markets, countries need to recommit to finding ways to further de jure globalization; that is, putting in place the institutional building blocks in
    support of enhanced trade and financial integration.
  3. Geopolitical Realities
    Institutional reform, however, requires trust and mutual respect among partners. Many would argue that such trust and respect is in limited supply
    today, especially between the United States and China. The United States is willing to endure the costs of heightened protectionism to purportedly
    strengthen the resilience of its economy and secure greater political security. This has resulted in multiple sanctions, particularly in areas of digital technologies.
    In response, China, amongst other measures, has imposed export controls on critical minerals used in advanced technology in defence of its geopolitical goals.
    Yet, as discussed by Fareed Zakaria in a Foreign Affairs article, The Self-Doubting Superpower, China has become the second largest economy in the world richer and more powerful within an integrated global economic system; a system that if overturned would result in severely negative consequences for China.
    For the United States, its inherent strength has been its commitment to open markets and its vision of the world that has considered the interests of others. In many respects, it remains uniquely capable of playing the central role in sustaining the global economic system.
    Following a recent trip to China, Treasury Secretary Yellen stated that “the relationship between the United States and China is one of the most consequential of our time,” and that it “is possible to achieve an economic
    relationship that is mutually beneficial in the long-run – one that supports growth and innovation on both sides.”
    This means that the United States would need to accommodate China’s legitimate efforts to sustain a rising standard of living for its citizens, while
    deterring illegitimate ones. For China, it would mean a clear and abiding commitment to an open, rules-based global economic system.
    It appears that there is currently no clear path forward for this change in mindset, given what many see as insurmountable geopolitics in both the United States and China. Yet, history shows that achieving and sustaining long-term economic growth is in every country’s best interest, and that such growth is best secured through ongoing global economic integration.
  4. A Way Forward
    Recent discussions at the IMF’s Annual Meeting in Marrakech about IMF quota reform, including quota increases and realignment in quota shares to
    better reflect members’ relative positions in the global economy, are important signals of possible renewal.
    Similarly, calls to revamp the World Bank’s mandate, operational model, and ability to finance global public goods, such as climate transition, reflect a growing consensus that the Bretton Woods Institutions must change in the face of today’s realities.
    But institutional renewal alone is insufficient.
    Broad-based accession to the CPTPP represents a unique opportunity to strengthen global governance overall, and to address common challenges in ways that benefit both countries as well as the global economy.
    The CPTPP sets a high bar, requiring countries to:
  • eliminate or substantially reduce tariffs and other
    trade barriers;
  • make strong commitments to opening their markets;
  • abide by strict rules on competition, government
    procurement, state-owned enterprises, and
    protection of foreign companies; and
  • operate within, as well as help promote, a
    predictable, comprehensive framework in the critical
    area of digital trade flows.
    The United Kingdom formally agreed to join the
    CPTPP in July 2023. Once its Parliament ratifies
    the Agreement, the UK will join Australia, Brunei
    Darussalam, Canada, Chile, Japan, Malaysia, Mexico,
    New Zealand, Peru, Singapore, and Vietnam in the
    trading block.
    Such a diverse membership clearly demonstrates
    that countries do not have to be geographically close
    to form an effective trading block.
    A half-dozen other countries have also applied
    to join the CPTPP, with China’s application having
    been the earliest received.
    Petri and Plummer estimate that joining the
    CPTPP would yield large economic benefits for
    China and the global economy. For the latter, the
    boost to global GDP would be in the order of $600
    billion annually. The United States in joining would
    gain preferential access to rapidly growing Pacific Rim
    markets. Much of the additional market access would
    come from China’s opening of its service sector.
    Industrial policy and state-owned enterprises,
    however, will continue to play a much larger role
    in China than they do in Western economies. The
    key for China is to demonstrate that a socialist
    market economy (i.e., one that has a mixed capitalist
    market and government-controlled economy) can be
    consistent with fair trade.
    The process of China joining the CPTPP will
    undoubtedly be time-consuming. It took 15 years of
    negotiations before China joined the WTO in 2001.
    This was five more years, on average, than it took
    those countries that joined after 1995.
    The challenge for Canada, and subsequent chairs,
    is to ensure that China’s entry maintains the high
    standards CPTPP members have met so far.
    Broad based accession to the CPTPP, including
    the United States and China, however, is best viewed
    Page 8 Verbatim
    Trusted Policy Intelligence
    as a long-term goal. China would need to undertake
    unprecedented reforms, involving complex political
    challenges, including Taiwan’s potential accession. For
    its part, the United States would need to step well
    back from its current mercantilist mind set, which
    risks worsening.

Canada as Chair in 2024

While efforts to renew existing global institutions to better reflect current economic realities are important, we see promoting broad accession to the CPTPP as the best means to turn today’s global economic fragmentation around.
At the heart of the global economic system is the open trading framework put in place at Bretton Woods in 1944. Many would see today’s fragmentation as becoming more acute, rather than getting better, due to geopolitical divisions.
But further fragmentation is no way to save the open, rules-based global trading system that has served so many countries so well for so long.


While restrictions reflecting legitimate security concerns are inevitable, an open, competitive trading system remains in the best interests of all countries.
As 2024 Chair of the CPTPP Commission, Canada has an opportunity to contribute to turning around the fragmentation of today’s global trading system and moving the global economy back along a path towards a
more open, rules-based trading system.


An important goal for Canada’s chairmanship would be to clarify the rules of accession. This would be a big step forward in sustaining expansion of CPTPP. While today’s geopolitical realities surrounding the applications of both China and Taiwan represent a particularly challenging area to advance, significant progress in other areas must be made. It should accelerate inclusion of Costa Rica, Uruguay, Ecuador, and Ukraine, all of whom have applied. And it should help move forward discussions with South Korea, Indonesia, Philippines, and Thailand, who have expressed interest in joining.


Over and above all that, however, at a more strategic level, Canada should also champion discussion and understanding of why building towards the long-run goal of broad accession to CPTPP is important. Open and inclusive institutions are at the core of providing the benefits of global economic integration to all countries.


Canada will also be Chair of the G7 Summit in 2025. This, along with the various ministerial and officials’ meetings leading up to the Summit, offers another critical avenue for Canada to take a leadership role in sustaining and promoting an open, rules-based global trading system.

    UN Specialized Fund & Program Combats Hunger In World’s Fragile Contexts

    Storybook       JOINT PRESS RELEASE IFAD and WFP work together to combat hunger in fragile contexts 
    Rome, Italy, March 2024. The UN’s International Fund for Agricultural Development (IFAD) and the World Food Programme (WFP) have today launched an action plan to work together in fragile contexts — countries simultaneously affected by economic shocks, and extreme weather, in combination with little or no institutional and government capacity to help people cope.

    The UN agencies seek to leverage the strengths and expertise of each organization to enhance resilience in fragile environments and improve food security for those who need it most.

    Fragility is a significant barrier to eradicating hunger and poverty. Moreover, frequent and severe extreme weather events are compounding these often-protracted crises worldwide. “We have decades of experience working in fragile contexts, because that is where so many of the rural poor live. But today, the rural environment is changing. It is becoming less predictable. Rapid changes in climate and demographics are making it harder than ever for rural populations to thrive on the land,” said Alvaro Lario, President of IFAD. “This new Action Plan is very exciting because together, we can be more than the sum of our parts,” added Lario.PR-20-2024©IFAD/Daniele Bianchi
    Fragile situations are on the rise and could impact as much as 60 percent of the world’s extreme poor by 2030. Nearly 1 billion people are currently living in such contexts worldwide, according to the International Monetary Fund estimates. 
    “WFP and IFAD teams work in many of the most fragile and challenging regions of the world, where millions of families who live on the frontlines of conflict, climate change and economic turmoil face a daily battle against hunger,” said WFP Executive Director Cindy McCain. “But it doesn’t have to be this way. Combining our expertise, resources and extensive global network, WFP and IFAD will step up our collaboration in key areas, such as food systems and climate resilience, to support sustainable development, peace and progress in the most vulnerable communities.”

    IFAD and WFP will carry out joint assessments on fragility, integrate smallholder farmers into food assistance programmes, invest in rural communities’ climate resilience, and share logistical capacity, data, analysis and expertise, as well as provide technical and operational support.
    For instance, IFAD’s investments in sustainable agricultural practices, such as the use of climate-resilient crops and climate insurance, will be combined with WFP’s climate-resilient local infrastructure and services.

    Ethiopia, Haiti, Mozambique, Pakistan, South Sudan, Sudan, Yemen and Zambia are the initial countries for collaboration to address fragility and food insecurity in addition to geographic areas across the Sahel and Pacific islands. The action plan aims at maximizing impact, being responsive to dynamic challenges, and focuses on tackling some of the main drivers of fragility. The partnership also builds upon the broader collaboration of the three Rome-based UN food and agriculture agencies, including the Food and Agriculture Organization of the United Nations (FAO), which was reinforced with a new five-year partnership agreement signed last August during a joint visit to South Sudan.

    Being able to work in fragile contexts is a priority for IFAD’s next three-year cycle (2025-2027), as the UN Fund plans to reach 100 million rural people. FAO, IFAD and WFP cover a spectrum of work that spans from humanitarian responses to emergencies and shocks, to resilience and development activities, aligning with the 2030 Agenda.

    The Rome-based agencies are working together on agri-food systems transformation, nutrition, gender equality and women’s empowerment, resilience-building, youth, and climate change to achieving maximized impact and delivering tangible value added to countries and populations.
    The United Nations World Food Programme is the world’s largest humanitarian organization saving lives in emergencies and using food assistance to build a pathway to peace, stability and prosperity for people recovering from conflict, disasters and the impact of climate change. Follow us on X, formerly Twitter, via @wfp_media

    For the Silo, Julie Marshall.

    Speedrunning (Beating Videogames Fast As Possible) Champs Playing For Make A Wish

    For the first time this year, the European Speedrunner Assembly (ESA) is set to host their recurring speedrunning event, where gamers aim to conquer video games at record speeds and showcase mind-blowing talents.

    For the first time ever, ESA is teaming up with Make-A-Wish International — an organization dedicated to fulfilling the wishes of children facing critical illnesses. Last year, ESA Winter and Summer collectively raised an impressive $200,000 for Alzheimer’s research. ESA Winter is taking place right now in Malmö until February 24th. 

    Set in Malmö, Sweden, the event will revolve around gaming, entertainment, and interactive fundraising. An onsite global audience of several hundred attendees are already interacting, accompanied by a substantial online viewership exceeding two million. Both the onsite and online audience have the opportunity to actively support the charity, for example, by donating $25 to influence the course of the games or to support various shows and performances, such as a Ikea furniture building duel or rhythmic displays.

    Last year, Make-A-Wish International granted more than 19,500 wishes to children living with critical illnesses around the world, including more than 5000 gaming and entertainment wishes. They are the second most popular type of wish granted by the charity, after travel wishes.

    Ida Lidholt, one of the ESA organizers says: “We are delighted to announce our new partnership with Make-A-Wish International. ESA Winter is a festival where gamers and the community unite. Through video games and speed, we level up to raise funds for children living with critical illnesses. It is heart-wrenching to witness the struggles of these kids. If we can alleviate their burden even a little by helping them fulfil their wishes, it holds profound significance for us.”

    Luciano Manzo, President & CEO, Make-A-Wish International says: “Children undergoing treatment for critical illness can experience anxiety, loss of hope, and isolation from friends and loved ones. For many of these children, gaming offers them a sense of escape, helps them connect with friends and distracts them from their long and often difficult treatment journeys. That’s why gaming and entertainment wishes are so popular among wish children. The funds raised from ESA Winter 2024 will help continue to grant these types of wishes and many others. We are so grateful to ESA and the gaming community for helping make wishes come true with this event.”

    ESA is globally livestreamed on Twitch.tv/esamarathon. Viewers are urged to contribute during the broadcast, with opportunities to, for instance, name game characters, present challenges to players, or vie for fantastic prizes. By backing ESA and Make-A-Wish, everyone can play a role in fulfilling the wishes of children living with critical illnesses. Support the talented speedrunners and participate in the fundraising—tune in to ESA and make a donation!

    Follow the event at www.twitch.tv/esamarathon

    About ESA 

    European Speedrunner Assembly (ESA) is a biannual charity marathon dedicated to video game speedrunning, held in Sweden. Since its inception in 2012, these events have collectively raised over one million dollars for various charitable causes.

    The two main flagship events, ESA Winter and ESA Summer, occur annually in February and July, respectively, each spanning seven days. Beyond these, ESA also organizes smaller speedrunning gatherings such as ESA Legends, a five-day in-person event uniting top RPG speedrunners, and Break the Record: Live, a three-day competition aimed at breaking world records in specified games and categories.

    About Make-A-Wish International

    Make-A-Wish creates life-changing wishes for children with critical illnesses. Founded in 1980, Make-A-Wish is the world’s leading children’s wish-granting organization, having granted more than 585,000 wishes in 50 countries worldwide. Together with generous donors, supporters, staff and more than 27,000 volunteers around the globe, Make-A-Wish delivers hope and joy to children and their families when they need it most. Make-A-Wish aims to bring the power of wishing to every child living with a critical illness because wish experiences can help improve emotional and physical health. For more information about Make-A-Wish International, visit worldwish.org

    Three Ways to Make $1,000 Using Artificial Intelligence

    Whether you need a side hustle or want to make a full career out of AI, here are ways to start

    A few years back, I read Warren Buffett’s book, Snowball. It turned out to be one of my favorite books of all time. In this book, Warren shares stories of when he was a kid and some of his favorite books. One book in particular, 1,000 Ways to make $1,000 by F.C. Minaker, helped shape his idea around business and making money. 

    After reading this legendary book many times, I decided to refresh the concept to help others by sharing ideas on how to use current AI technology to make money. As an entrepreneur who uses AI in my business, I know there are many ways in which AI can help you create side hustles, start businesses, and even help make your current jobs more efficient.

    Whether you would like to start a small side business, or whether you want this to be your full career, there are many opportunities to make money with AI.

    If you’re not a techie type, there may be a learning curve to become adept at the skills to succeed at AI. But if you have an interest in it and a desire to learn, and are willing to undergo some training and education, it’s possible to learn enough to make money with AI.

    Here are three ways to begin your journey into making money with AI technology.

    Prompt generators are becoming a lucrative business. Humans will pay for AI prompts that are ‘ready to go’.

    • Prompt Engineering refers to the process of designing and fine-tuning prompts for natural language processing (NLP) models. It involves creating a set of instructions or guidelines that tell the model what information to look for and how to use that information to generate a response. Here are a few steps and platforms I would use to start earning money today:
      1. Create an account at PromptBase.
      2. Check out this helpful tutorial on YouTube to get you prepared.
      3. Quickly read over some guidelines on how best to sell prompts to the marketplace to start earning.
      4. Take a look at some successful prompts that are for sale on the marketplace to get an idea how best for you to start earning.
      5. Start earning!
    • Transcription Services involve the conversion of audio or video recordings into written or text format. This service is provided by professional transcriptionists who are trained to accurately transcribe spoken words into written form. Here are a few steps and platforms I would use to start earning money today:
      1.                Create an account at Speak Write.
      2.                Check out the helpful tutorial video to get you prepared.
      3.                Quickly read over some FAQ’s on how best to prepare to start earning for transaction services.
      4.                Take a look at someones daily schedule for earning money on Speak Write
      5.        Start earning!
    • Labeling and Annotation are processes in which data is manually labeled or tagged with specific attributes or metadata that make it easier for machines to understand and analyze the data. Labeling involves assigning a specific category or label to data, such as identifying objects in an image or sentiment in a text. Annotation involves adding additional information, such as context or relationships between data points. Here are a few steps and platforms I would use to start earning money today:
      1.                Create an account at Clickworker.
      2.                Check out this helpful tutorial on YouTube to get you prepared.
      3.                Quickly read over some FAQ’s on how best to prepare to start earring for transaction services.
      4.                Take a look at the tasks you can pick from to start earning money on Clickworker.
      5.                Start earning!

    The next decade will be a Decade of Abundance due to technological advancements like AI. While AI has its detractors, I believe we should be leaning in to explore this life-changing technology because it will empower the globe. 

    AI has already been able to improve our lives in many ways, and it has the potential to solve some of the world’s most pressing problems, including in healthcare, education, and security. There’s no reason why you cannot be a part of this revolution, too. For the Silo, Joe Nigro.


    Connecticut-based Joe Nigro is an investor, advisor, and entrepreneur who has used AI extensively in his career.

    Featured image: Students summarize a text then tried to figure out which summaries were penned by classmates and which was written by a chatbot.Timothy D. Easley, FRE / AP