Tag Archives: capital

Thinktank- Time To Change Single Head Governance Of Canada’s OSFI

  • Since its creation in 1987, the Office of the Superintendent of Financial Institutions (OSFI) has served as Canada’s federal micro-prudential regulator, operating under a single-head governance model that was suitable at the time but has not undergone a major review in nearly three decades.
  • Particularly following the 2008 financial crisis, OSFI’s activities have expanded in response to a more complex and rapidly evolving environment in which Canadian financial institutions operate. Meanwhile, governance practices across the financial sector have modernized, leaving OSFI’s structure increasingly out of step with its domestic and international peers.
  • To modernize OSFI’s governance, policymakers should mandate regular parliamentary oversight and introduce a multi-member model, such as a board of directors supported by advisory committees. These changes would strengthen transparency, accountability, and diversity of perspectives, ensuring that OSFI remains a credible and responsive regulator.
  • OSFI would also benefit from a periodic review of its governance framework. A formal review cycle, at least once every decade, would help keep its governance model current, effective, and aligned with its expanding responsibilities.

Introduction

Canada’s financial system faces a brave new world of risks, from geopolitical fragmentation and cyber threats to climate-related shocks, that place new demands on its regulators. But the governance structure of the Office of the Superintendent of Financial Institutions (OSFI), the country’s federal prudential regulator, has remained largely unchanged for decades.

OSFI was established in 1987 to ensure the safety and soundness of the Canadian financial system, based on recommendations from the Estey Commission. It was formed by consolidating the Department of Insurance and the Office of the Inspector General of Banks.

A Superintendent, supported by deputies and staff, holds sole responsibility for prudential regulation and supervision. While OSFI is an independent agency, it is accountable to Parliament through the minister of finance. Its internal governance includes a Departmental Audit Committee (DAC), which advises on risk management, control, and governance frameworks, and an internal audit team that reports to the Superintendent.

This structure differs meaningfully from those of comparable domestic and international regulators. And there are reasons to ask whether its governance structure remains appropriate for today’s environment.

We start with the premise that, since 1987, governance practices, financial services, the risk environment, and OSFI’s mandate and activities have all evolved significantly. Yet the model underpinning OSFI’s structure (see Box 1) has not undergone a major review since the MacKay Task Force in 1998, nearly 30 years ago.

Historically, Canada’s financial system included five main groups: chartered banks, trust and loan companies, the co-operative credit movement, life insurance companies, and securities dealers. These pillars began to dissolve shortly after the formation of OSFI with the 1987 and 1992 revisions to the Bank Act, as large banks acquired trust and loan companies and securities dealers. Recently, some credit unions have become federally regulated.

Today, Canada’s financial sector faces a convergence of risks that challenge traditional prudential supervision and place new demands on regulatory governance. Beyond post-financial crisis concerns about capital adequacy and credit risk, the current landscape includes geopolitical tensions that could disrupt cross-border resolution and capital flows (Zelmer 2025), increasingly sophisticated cyber threats (including state-linked attacks [OSFI 2025]), and escalating physical and transition risks from climate change (IMF 2025a). While OSFI has strengthened its supervisory frameworks in areas such as cyber resilience and climate risk, these pressures highlight the importance of a governance structure capable of navigating complex trade-offs between stability, competitiveness, resilience, and public confidence.

OSFI’s responsibilities have also expanded. Since 2012, it has overseen the insurance activities of the Canada Mortgage and Housing Corporation (CMHC). In 2016, it introduced a mortgage stress test, increasing its direct impact on individual Canadians. More recently, the passage of Bill C-47 in 2023 requires OSFI to examine whether federally regulated financial institutions have adequate policies and procedures related to integrity and security.

Compared with its peers, OSFI’s governance model is unusual. Many comparable regulators operate with boards (OECD 2010). The OECD (2014) identifies several advantages of multi-member governing bodies: they are less susceptible to regulatory capture than a single decision-maker; they better balance judgment in complex, principles-based regulatory environments; and they provide collective support for strategic oversight. All three apply to OSFI. While its track record reflects strong leadership, distributing authority would reduce institutional vulnerability by design, rather than relying on any one individual. A multi-member body would also provide a structured forum for debating complex trade-offs and challenging internal decision-making as OSFI confronts emerging risks such as AI and cyber threats.

International counterparts following such practices include the UK’s Prudential Regulation Authority and Australia’s Prudential Regulation Authority. Domestically, newer regulators such as the Financial Services Regulatory Authority of Ontario (FSRA), along with securities regulators like the Ontario Securities Commission (OSC), have adopted board governance structures.

Given the evolving financial landscape, a shift from a single-head model to a multi-member structure is warranted. Regulating the financial system requires a balancing act that collective decision-making provides by offering a diversity of opinions, expertise, and perceptions. As OSFI’s activities expand into areas such as cybersecurity and financial institution governance, it also requires new subject-matter expertise to develop compliance and enforcement capabilities in new areas.

We therefore recommend that OSFI transition to a multi-member governance structure, including a board of directors and advisory councils. This would strengthen independence, enhance transparency and accountability, and align OSFI with best practices in regulatory governance.

OSFI’s governance model should also undergo periodic review – something that has not occurred since the MacKay Task Force nearly three decades ago (see Box 2). This absence has left the framework misaligned with international best practices. Conducting a formal review at least once every 10 years would ensure that the model remains current and fit for purpose in fulfilling OSFI’s mandate and Canadians’ expectations.

OSFI Expanded Responsibilities and Activities

Since the 2007-08 global financial crisis, OSFI’s mandate and responsibilities (Figure 2) have broadened significantly in response to rising systemic risks and a more complex financial landscape. As noted, OSFI oversees CMHC, particularly its commercial activities in the mortgage insurance sector – an area critical to housing market dynamics and, by extension, to household debt and consumption patterns.

OSFI has also taken a more proactive role in setting regulatory expectations. Since 2016, it has accelerated the issuance of guidelines on governance, capital adequacy, and insurance practices of federally regulated financial institutions (FRFIs). In some cases, these guidelines go beyond traditional supervisory functions and increasingly influence Canadians’ everyday financial experiences.

One prominent example is the Minimum Qualifying Rate (MQR) or “mortgage stress test” introduced by OSFI in 2018. It requires lenders to verify income and apply a minimum qualifying rate to uninsured mortgages. The stress test is designed to evaluate the solvency of mortgage holders under adverse interest rate conditions, reduce systemic risk in the housing market, and support sound financial management of financial institutions. While it strengthens system resilience, this approach may limit household credit availability and affect Canadians’ capacity to purchase homes.1

More recently, the passage of Bill C-47 by the federal government in 2023 further expanded OSFI’s authority. It allows OSFI to assess whether FRFIs have adequate integrity and security policies and procedures. This change reflects the shift toward a broader conception of financial stability. As a result, the Superintendent’s responsibilities have grown in both complexity and impact.

Although OSFI has developed the in-house expertise2 to manage its expanded functions, its evolving role would benefit from greater external input.3 Incorporating diverse perspectives would strengthen its ability to challenge prevailing internal perspectives and ensure that its regulatory approach remains well-informed, while anchored in its prudential mandate.

The Pros and Cons

Before making the case for transitioning OSFI to a multi-member model, it’s useful to set out the advantages and limits of each governance model. Regulators generally use three models. The first is a multi-member body that sets strategic direction and operational policy, while delegating regulatory decisions to a chief executive officer. The second is a commission model, also multi-member, in which a collective makes most substantive decisions. The third is a single-head model, where one individual holds primary decision-making authority.

The Organisation for Economic Co-operation and Development (OECD 2014) provides the established international framework for evaluating regulatory governance, including the choice between single-member and multi-member governance structures for independent regulators. It identifies when a multi-member governance model adds value, outlines the design considerations, and offers a framework for applying these factors to a specific regulator. Table 1 summarizes the main advantages and disadvantages of a multi-member body.

When a multi-member body adds value

The OECD (2014) identifies five factors in determining whether a multi-member governing body adds value.

  • Potential consequences of regulatory decisions: A collective is less susceptible to regulatory capture4 than an individual and benefits from a wider range of perspectives.
  • Need for diverse judgment: In complex or principles-based regulation, collective decision-making better balances judgment factors and minimizes the risks of varying judgments.
  • Degree of strategic guidance and oversight required: This is especially important when developing new regulations and deploying resources because a multi-member model provides the necessary collective support for strategic considerations.
  • Maintaining regulatory consistency over time: A group can better maintain consistency by providing “corporate memory” in decisions that rely heavily on judgment.
  • Decision-making independence: Boards are generally less susceptible to political or industry influence than a single decision-maker.5

What the single-head model offers that a multi-member model risks losing

By identifying when multi-member governance adds value, the OECD framework implicitly identifies the conditions under which a single-head model is better suited.

One of the clearest advantages of the single-head model is that responsibility is unambiguous. At OSFI, the Superintendent is directly accountable to the minister of finance, Parliament, and the public. Having a board does not automatically improve accountability. It can, if poorly designed, diffuse it.

The single-head model also enables faster, more decisive action. It avoids the delays of consensus-building and supports rapid responses to emerging risks or mandate changes. It can also minimize the risk of policy conflict that may arise when multiple board members hold divergent views.

These are not trivial considerations. As a microprudential regulator, OSFI must often respond rapidly to emerging risks and take swift decisions on a case-by-case basis. The ability to act without delay is valuable. A poorly designed multi-member body could slow responsiveness and introduce the kind of internal disagreement that undermines regulatory certainty. The OECD (2014) acknowledges this risk, noting that where a regulator has a high volume of time-sensitive decisions, the full governing body may need to delegate extensively.

The tension between models is genuine.

The OECD framework does not prescribe a single model but asks whether, on an honest assessment of the five criteria, the case for collective governance has been met. As the following sections argue, OSFI’s expanded mandate, the more complex risk environment, and the breadth of judgement now required shift that balance toward a multi-member model, provided the design risks are carefully managed.

The Evolving Risk Environment: A Case for Enhanced Governance

As this section demonstrates, Canada’s financial sector faces an unprecedented convergence of risks – geopolitical instability, cyber threats, climate change, and complex capital regulation trade-offs – that has expanded well beyond post-financial crisis concerns and fundamentally challenges traditional regulatory approaches. This shift raises the question of whether OSFI needs a new governance approach.

The answer is yes. As these risks grow in scope and complexity, OSFI’s governance structure should evolve accordingly. While the current model concentrates decision-making authority in a single Superintendent, a board could bring together experts in geopolitics, cybersecurity, climate science, international finance, and domestic economic policy to inform OSFI’s strategic direction. It would provide a forum for debating complex trade-offs, such as balancing financial stability with economic growth or weighing international regulatory coordination against domestic competitive concerns, in a more transparent and accountable manner. Most importantly, it would enhance OSFI’s legitimacy and public confidence in its decision-making during periods of intense scrutiny.

Geopolitical Risk and Cross-Border Vulnerabilities

Rising geopolitical tensions present fundamental challenges to Canada’s internationally active financial institutions. As Zelmer (2025) notes, weakening cross-border cooperation, particularly involving the United States, could make it harder to manage the recovery or orderly resolution of internationally active Canadian financial institutions during periods of distress. Foreign regulators may ring-fence assets within their jurisdictions, limiting Canadian authorities’ access to the capital and liquidity needed to protect domestic depositors and creditors. This risk is especially significant because Canada’s six major banks have substantial operations and exposures in the United States and other foreign markets.

These emerging and potentially politicized risks highlight the value of a board in providing independent, collective support for OSFI’s strategic direction.

Cyber Risk and Technological Threats

Cyber threats targeting financial institutions have increased in frequency and sophistication. In 2023, 26 percent of finance and insurance firms experienced cybersecurity incidents, compared with 16 percent across the private sector.6 Furthermore, the threat of cyberattacks remains high in Canada (IMF 2025b), and money laundering and fraud attempts from criminals and state-linked actors are becoming more advanced and difficult to detect (OSFI 2025). These activities will likely intensify with advances in AI and digitalization.

OSFI has acknowledged that foreign actors may target Canadian institutions for financial gains and geopolitical purposes (OSFI 2025). Repeated incidents in the financial sector could erode confidence and threaten its stability, causing spillovers to the rest of the economy.7

A 2025 IMF Financial Sector Assessment Program review of Canada found that while OSFI’s cyber risk supervisory framework is strong, gaps remained in coordination with federal and provincial authorities, and that OSFI’s integrated mandate enables it to detect advanced cyber threats beyond conventional risks (IMF 2025b). Given the complexity of these risks, a well-designed board with the right expertise could offer appropriate support in developing a strategic plan to mitigate these risks.

Climate Risks

Climate change presents both transition and physical risks to Canada’s financial system, with broader macroeconomic effects. It can reduce GDP (Dahlhaus 2025), increase inflation volatility (Duprey and Fernandes 2025), and negatively affect employment (Duprey et al. 2024). The 2016 Fort McMurray wildfire alone caused an estimated $9.9 billion in damages and reduced quarterly GDP by 0.4 percent (Statistics Canada 2024). These risks are expected to intensify, with projections indicating more frequent and severe weather conditions and longer wildfire seasons across much of Canada (IMF 2025a).

OSFI’s Guideline B-15 sets out expectations for FRFIs’ management of climate-related risks.8 However, the IMF’s recent assessment of climate risk in Canada’s financial sector recommends that OSFI strengthen its climate risk supervision through better data, coordination, and stress testing (IMF 2025a). A board with relevant expertise could help guide OSFI’s strategic response, while an advisory committee could support technical policy development in this area.

Domestic Regulatory Complexity: Basel III and Capital Requirements

Implementing Basel III reforms has created significant domestic challenges. In 2024-2025, OSFI faced intense public scrutiny over its approach to implementing the Basel III standardized capital floor (Zelmer 2024), with Superintendent Peter Routledge noting that the intensity of attention was new to OSFI and provided an opportunity to communicate more clearly to Canadians (OSFI 2024). The Superintendent noted that some observers argued that OSFI’s decision would have “a consequential and negative impact on economic growth, arguing that dramatically rising capital requirements
would slow lending and then economic growth” (OSFI 2024).

OSFI’s decision to indefinitely defer increases to the Basel III standardized capital floor level reflected concerns about competitive balance in the international banking system, as uncertainty remained about when other jurisdictions would fully implement Basel III.9 These are precisely the kinds of complex, multi-dimensional trade-offs that a board, equipped with expertise in international finance, economics, and competition policy, could be designed to support and challenge. A structured deliberative process within a governing board could provide a forum to assess these issues transparently and reduce perceptions of reactive or politically influenced decision-making.

The General Case for Multi-Member Governance at OSFI

The previous sections have shown that, across multiple dimensions of OSFI’s expanded mandate and activities, a multi-member governance structure could create net benefits over the current single-head model. This section shows how OSFI’s governance structure is out of step with comparable regulators domestically and internationally and draws lessons for reform.

International Comparison of the Governance Structures of Financial Institutions’ Regulatory Supervisors

We compare OSFI’s governance structure with the Australian Prudential Regulatory Authority (APRA), the UK’s Prudential Regulatory Authority (PRA), and Switzerland’s Financial Market Supervisory Authority (FINMA). All have similar mandates: they regulate financial institutions but are not responsible for promoting consumer protection.10

APRA uses a commission model that supports collective decision-making and incorporates a range of perspectives, thereby reducing dependence on any single leader. Its executive board of three to five government-appointed members, including the CEO as chair, manages operations and sets strategy. However, the responsibility for balancing immediate operational demands with long-term strategic priorities ultimately remains concentrated in a single authority. A clearer separation of these roles might yield a more effective balance. Consequently, this governance approach remains vulnerable to some of the same challenges faced by the single-head model. Furthermore, a lack of external views may hinder strategic decisions, given that the members are all employees and thus not independent of APRA.

Switzerland’s FINMA represents a cleaner governance board model and is widely seen as best practice (OECD 2014). An independent board of seven to nine expert members from academia and industry sets the strategic oversight and long-term planning, and oversees an executive team led by a CEO. No FINMA employees or ministry of finance officials sit on the board, ensuring independence. Its architecture creates a clear distinction between strategic and operational management. The board enhances the executive team’s accountability, and its composition strikes the right balance of multidisciplinary expertise between market practitioners and academics. Bringing expertise from law, finance, economics, and insurance helps align long-term strategy with evolving risks. However, safeguards are needed to prevent decision-making delays and mitigate potential biases.11

The PRA in the UK functions uniquely as part of the country’s central bank, and the Bank of England (BoE) employs the PRA staff. As a microprudential regulator, the PRA focuses on ensuring individual financial institutions are well capitalized and avoid excessive risk-taking, but through the lens of the effects those firms can have on system stability.12

Its structure is similar to the APRA’s in that it’s also governed by a commission, the Prudential Regulation Committee (PRC). At least six external expert members appointed by the government sit on the PRC, which makes it more independent.13 External members bring both market experience and academic insight, balancing practical relevance with historical and policy context. However, the presence of the BoE Governor on the board of both institutions, though a deliberate institutional choice given the PRA’s mandate orientation toward the systemic effects of firm-level risk, may raise questions about accountability and the separation of firm-level and system-level considerations in a crisis.

While OSFI’s single-head governance model offers advantages, experience across comparable jurisdictions reinforces the view that a multi-member governance structure is the most adequate for financial sector regulators. Diverse expertise and collective judgment improve decision-making and help regulators meet increasingly complex mandates. Given OSFI’s similar responsibilities, industry context, and evolving risk environment, these international experiences offer practical lessons for transitioning to a multi-member structure.

The Evolution of Provincial Financial Regulators

Recent Canadian reforms also support this shift. In 2022, the Ontario government revised the governance structure of the OSC (see Figure 3)14 to embrace evolving governance best practices as recommended by the Ontario Capital Markets Modernization Taskforce. The Taskforce determined that the OSC’s previous single-headed leadership structure hindered strategic oversight and operational execution, thereby limiting the organization’s overall effectiveness. It separated the Chair and CEO roles and established a board of directors (Capital Markets Modernization Taskforce 2021). Under this new model, the CEO oversees day-to-day regulatory operations, while the board sets strategic direction and governance.

Prior to that, Ontario adopted modern governance standards when it created FSRA in 2019, replacing FSCO and DICO with an agency led by an independent board and a separate CEO responsible for day-to-day management (FSRA 2025). The board sets strategic direction, oversees governance, and monitors the regulator’s performance against its mandate. The Chair of the Board serves as the primary liaison with the responsible ministry. The board has 12 members (up to 11 independent permitted plus the CEO), all with financial sector experience.15

The Canada Deposit Insurance Corporation as Institutional Comparator

The case for external board governance at OSFI is not limited to international and provincial precedents. The Canada Deposit Insurance Corporation (CDIC), which is part of Canada’s federal financial safety net, has a similar institutional structure.

CDIC operates with a board of directors, handles institution-specific supervisory data of comparable sensitivity to OSFI’s, and carries a mandate – deposit insurance, financial system stability, and resolution authority – that is functionally interdependent with OSFI’s prudential supervision role.

CDIC’s board comprises 12 members: six ex officio public sector directors drawn from the Department of Finance, the Bank of Canada, OSFI, and FCAC; and six private sector directors appointed by the Governor in Council for terms of up to four years. The CDIC Act16 bars current federal public servants, members of Parliament, and anyone affiliated with a federal or provincial financial institution from sitting on the board as private sector director. This exclusion addresses conflicts of interest while preserving access to relevant expertise. This demonstrates that statutory design can resolve the tension between independence and sectoral knowledge without foreclosing either.

The board’s mandate extends beyond administrative oversight to include strategic direction and decision-making authority over interventions in member institutions. These decisions are sensitive and time-critical, and often cited as incompatible with OSFI’s operating environment. CDIC’s experience suggests otherwise: a board can exercise strategic authority without displacing management.

Confidentiality concerns are also manageable. CDIC’s board routinely handles granular information on member institutions, subject to the conflict-of-interest rules and confidentiality obligations set out in the CDIC Act and the FAA. The practical management of confidential supervisory information within a board governance structure can be an established operating condition. There is no clear reason why similar arrangements could not function at OSFI, which is subject to comparable statutory confidentiality provisions and operates within the same inter-agency information-sharing framework.

The Office of the Auditor General of Canada has validated this model,17 finding CDIC’s governance sound and its board effective. This is further evidence that board governance of a federal financial body operating in a confidential supervisory environment is institutionally sustainable and withstands rigorous independent scrutiny over time.

In addition, the OSFI Superintendent already sits on CDIC’s board as an ex officio member, participating in board governance. The Superintendent is therefore already a participant in board-level governance of a federal financial institution operating under the same confidentiality constraints.

Taken together, the CDIC model helps in making the case for an OSFI board and shows that confidentiality constraints don’t render external governance impractical and need not compromise operational independence. The relevant question for reform is not feasibility, but how to define the boundary between board oversight and the Superintendent’s authority to preserve supervisory independence. We turn to that question next.

OSFI’s Next Review

The preceding sections have shown that board governance can coexist with operational independence across a range of international and domestic institutional comparators. The next question relates to design – how to structure such a board and allocate authority among the board, the Superintendent, and the minister.

OSFI’s mandate and governance structure have not been reviewed since 1998. This lack of periodic reviews is itself a structural gap. Comparable financial regulators in Canada and abroad undergo regular assessments of their mandate, governance, and accountability. OSFI has not. A review is warranted not because of weak performance, but because its governance framework has not been evaluated against current institutional standards, peers, or international norms in nearly 30 years.

A review focused on board governance should address, at minimum:

  • What public policy outcomes should OSFI deliver?
  • What operational, legislative, or regulatory changes would improve its effectiveness in the face of changing market realities?
  • Would a new governance model strengthen or weaken political oversight needed to keep legislation and enforcement up to date?
  • How would alternative governance structures affect the risk of stakeholder regulatory capture?
  • How can governance design account for Canada’s unique federal/provincial division of financial sector regulatory responsibilities and ensure desired regulatory outcomes can be effectively achieved?
  • How should statute define the boundary between board strategic oversight and the Superintendent’s authority?
  • What appointment criteria and processes would ensure board independence without limiting access to relevant financial sector expertise?
  • How should the board be accountable to Parliament, and how would this differ from the Superintendent’s reporting obligations?
  • What, if any, role should the board play in the use of macroprudential tools such as the Domestic Stability Buffer?
  • How should the accountability relationship between the Superintendent and the minister of finance be preserved or clarified in the context of a multi-member governance structure?

The next section addresses some of these questions and sets out a proposed governance architecture that draws on the institutional comparators examined and the design lessons from the MacKay Taskforce.

A Roadmap to Improve OSFI’s Governance

We now turn to how OSFI can improve its governance structure by incorporating diverse perspectives and enhancing its credibility with stakeholders. Effective governance frameworks for government agencies must safeguard against undue political or industry influence.

While OSFI maintains a professional relationship with regulated institutions, there is no evidence of regulatory capture within the Canadian financial system (IMF 2014). Nonetheless, a board structure could further strengthen OSFI’s independence by reducing vulnerability to such influence. Collective governance bodies are less susceptible to capture than individual decision-makers and can enhance institutional credibility (OECD 2014; Jabotinsky and Siems 2017). This is not to suggest that any Superintendent has been susceptible to such influence. Rather, distributed authority and diverse membership provide a durable safeguard that does not depend on any one individual.

Given OSFI’s expanding mandate and activities, the board could provide strategic oversight and support, while reinforcing institutional memory and consistency. It would allow the Superintendent to focus more on day-to-day operations while contributing to long-term strategy.

To achieve this, we recommend two changes: an independent board of directors to provide strategic oversight and expertise; and advisory councils to supplement OSFI’s knowledge in emerging risk domains such as cybersecurity and artificial intelligence.

1. Board of Directors

The board would:

  • Approve strategic direction, policies, culture, and risk appetite, and provide independent advice to the Superintendent.
  • Be accountable to Parliament and subject to its oversight and scrutiny.
  • Periodically review OSFI’s policy effectiveness (e.g., the MQR stress test or the Domestic Stability Buffer).
  • Approve the budget, review OSFI’s Annual Risk Outlook, and provide a challenge function.
  • The board would not:
  • Review institution-specific supervisory decisions, preserving confidentiality.18
  • Manage OSFI’s operations.
  • Execute decisions on prudential tools such as the MQR or the Domestic Stability Buffer.

Structure of the Board

To provide OSFI with diversity of expertise and perspective, the board of directors should:

  • Exclude members from FISC and regulated industries to maintain independence.19
  • Draw members from academia, former regulators (including those from other jurisdictions), risk specialists, and former industry practitioners.20
  • Include an independent chair and five to nine members with multidisciplinary expertise. The Superintendent should serve as a member, and a government representative (e.g., deputy minister of finance) could serve ex officio.21
  • Use three-year renewable terms with staggered appointments to ensure continuity.22

This structure differs fundamentally from the existing DAC. The DAC is an advisory body within OSFI that provides independent advice and recommendations to the Superintendent on risk management, internal controls, and governance frameworks. The DAC is composed of a majority of external members drawn from outside the federal public administration, with relevant experience in private and public sector financial reporting. Members are selected by the Superintendent and approved by the Treasury Board. At least one member must hold a professional accounting designation. The Superintendent sits as an ex officio member.

The proposed board of directors differs from the DAC in many respects (Table 2). Where the DAC looks backward to verify that established processes were followed, the board looks forward to challenge whether OSFI is pursuing the right strategic priorities. Where the DAC reports to the Superintendent, the board exercises independent oversight over the Superintendent. And where the DAC has no parliamentary accountability function, the board would serve as a formal mechanism linking OSFI’s governance to parliamentary scrutiny, which is a function that currently does not exist.

The distinction is substantive, not incremental: the DAC strengthens process integrity, while the board would strengthen the legitimacy of OSFI’s direction. Both are necessary, but one cannot substitute for the other.

2. Advisory Committees

Financial regulators commonly use advisory committees to access industry expertise and incorporate market perspectives into policymaking. For example, the OSC is supported by seven distinct third-party advisory committees to provide input on new policies, assess regulatory impacts, and communicate stakeholder concerns.23 These committees focus on specific technical or sectoral topics and provide advice to staff, drawing on both market participants and regulators.

Internationally, the UK’s PRA uses the Practitioner Panel to represent the interests of industry practitioners to fulfill a statutory duty. This independent panel provides expert input on the PRA’s policies and constructive challenge and advice to ensure that practitioner perspectives are reflected in regulatory decision-making. It meets about six times a year with PRA leadership and has contributed feedback on a range of policy issues, including the implementation of Basel 3.1.

While it is true that financial services regulators already incorporate the views of market participants and stakeholders into their regulatory rules through public consultations, they control these processes by setting the agenda and framing the questions. This approach is episodic and tied to specific rule-making initiatives.

Advisory committees would:

  • Provide OSFI with a diversity of expertise and perspectives on risk-related issues, particularly in emerging areas where in-house capacity may be limited (e.g., cybersecurity).24
  • Challenge OSFI’s policy responses on issues such as technology, security, and integrity risks.

Transparency around such bodies would contribute to the credibility of OSFI’s policy responses. Publishing the membership of each group and any recommendations that the body may provide to OSFI would further enhance credibility.

Advisory committees would not:

  • Engage in federally regulated financial institution work, preserving confidentiality.25
  • Manage OSFI’s operations, including staffing, budgeting, and internal structure.
  • Review OSFI decisions and actions for specific institutions.
  • Participate in OSFI-specific decisions regarding systemic prudential tools such as the MQR or the Domestic Stability Buffer.

Structure of the Advisory Committees

Advisory committees should:

  • Be independent.
  • Include members from academia, regulatory bodies (including other jurisdictions), risk specialists, and selected industry practitioners.26
  • Have an independent chair and at least five expert members with multidisciplinary backgrounds.
  • Be reviewed periodically to ensure expertise remains aligned with emerging risks, informed by sources such as OSFI’s Annual Risk Outlook and the IMF’s Global Financial Stability Report.
  • Be time-limited where appropriate (e.g., three-year terms or until a specific policy issue is addressed), reflecting their specific topic of focus.27

While an independent board and advisory committees will minimize the risk of industry influence through normal course operations, it would not, on its own, address the issue of accountability.

Since OSFI derives its authority from Parliament, we recommend that Parliament play an active role in overseeing OSFI. One option would be to legally require OSFI to regularly appear before the House of Commons Standing Committee on Finance (FINA) and the Senate Standing Committee on Banking, Commerce, and the Economy (BANC). To our knowledge, the Superintendent last appeared before BANC in October 2025 and before FINA in 2024.

Regular appearances have proven effective for other institutions, such as the Bank of Canada, by strengthening transparency without compromising independence or responsiveness to emerging risks. Although not legally required to do so, the Bank of Canada appears before Parliament at least twice a year (Binette and Tchebotarev 2019). In 2024, the Standing Senate Committee on Banking, Commerce, and the Economy released a report on the conduct of monetary policy in Canada, in which it recommended formalizing this practice to strengthen accountability and transparency (Senate 2024).

In addition to stronger governance and parliamentary oversight, OSFI would benefit from a structured periodic review of its governance framework, similar to the IMF’s Financial Sector Assessment Program but focused on the regulator itself. In its nearly four decades of existence, the MacKay Task Force has been the only review of OSFI’s governance, and that was nearly 30 years ago. Establishing a formal review cycle, at least once every decade, would ensure that OSFI’s governance remains current, aligned with international best practices, and capable of supporting an increasingly complex financial sector.

Conclusion

The OSFI Act states that its purpose “…is to ensure that financial institutions and pension plans are regulated by an office of the Government of Canada so as to contribute to public confidence in the Canadian financial system.” Since its creation in 1987, OSFI has played an important role in upholding that confidence. Yet the environment in which Canadian financial institutions operate has changed dramatically and continues to evolve due to forces such as digitalization, artificial intelligence, climate-related risks, and geopolitical uncertainty.

Modernizing OSFI’s governance is both timely and necessary. We recommend moving from a single-head model to a multi-member structure, including a board of directors and advisory councils, to broaden the perspectives informing policy decisions. Further, enhancing transparency and accountability through regular appearances before Parliament would reinforce OSFI’s contribution to public confidence in the financial system.

OSFI should also adopt a formal review cycle (at least once every 10 years) to ensure its governance remains aligned with best practices and responsive to emerging risks. Publishing regular updates, conducting consultations, and providing plain-language summaries of board decisions and advisory committee recommendations would further enhance transparency.

Together, these reforms will help OSFI remain a credible and adaptive regulator.

The authors extend gratitude to Hande Bilhan, Glen Hodgson, Phil Howell, Jeremy Kronick, Victoria Mainprize, Peter MacKenzie, Parisa Mahboubi, and several anonymous referees for valuable comments and suggestions.

Jamey Hubbs currently serves on the board of Laurentian Bank. The authors retain responsibility for any errors, and the views expressed in this paper do not reflect those of their past or current affiliations.

For the Silo, Mawakina Bafale and Jamey Hubbs/C.D. Howe Institute.

REFERENCES

Binette, André, and Dmitri Tchebotarev. 2019. “Canada’s Monetary Policy Report: If Text Could Speak, What Would It Say?” Staff Analytical Note/Note analytique du personnel 2019-5. Bank of Canada.

Bourque, Paul C., and Gherardo Gennaro Caracciolo. 2024. The Good, the Bad and the Unnecessary: A Scorecard for Financial Regulations in Canada. Commentary 664. Toronto: C.D. Howe Institute. July. https://cdhowe.org/publication/good-bad-and-unnecessary-scorecard-financial-regulations-canada/.

Capital Markets Modernization Taskforce. 2021. Capital Markets Modernization Taskforce Final Report. https://files.ontario.ca/books/mof-capital-markets-modernization-taskforce-final-report-en-2021-01-22-v2.pdf.

Caracciolo, Gherardo Gennaro. 2025. Pruning the Rulebook: Canada’s Financial Regulatory Scorecard, Year Two. Commentary 694. Toronto. C.D. Howe Institute. October. https://cdhowe.org/publication/pruning-the-rulebook-canadas-financial-regulatory-scorecard-year-two/.

Dahlhaus, T., T. Duprey, and C. Johnston. 2025. “Estimating the impacts on GDP of natural disasters in Canada.” Staff Analytical Note 2025-5. Bank of Canada.

Duprey, T. and V. Fernandes. 2025. “Natural disasters and inflation in Canada.” Staff Analytical Note 2025-8. Bank of Canada.

Duprey, T., S. Jo, and G. Vallée. 2024. “Let’s get physical: Impacts of climate change physical risks on provincial employment.” Staff Working Paper 2024-32. Bank of Canada.

Edwards, Gary. 2025. Regulatory Reset: A Policy Roadmap for Expanding Financial Advice to Middle- and Lower-Income Canadians. Commentary 693. Toronto: C.D. Howe Institute. https://cdhowe.org/publication/regulatory-reset-a-policy-roadmap-for-expanding-financial-advice-to-middle-and-lower-income-canadians/.

Financial Services Regulatory Authority of Ontario. N.d. “Memorandum of Understanding.” https://www.fsrao.ca/about-fsra/governance#:~:text=The%20Memorandum%20of%20Understanding%20(MOU,Directors%20(BOD)%20and%20Chair.

Hartley, Jonathan, and Paixão Nuno. 2024. “Mortgage stress tests and household financial resilience under monetary policy tightening.” Staff Analytical Note 2024-25. Bank of Canada. November.

House of Commons. 1998. The Future Starts Now. A study of the Financial Services Sector in Canada. Committee Report No. 12, 36th Parliament, 1st Session. https://www.ourcommons.ca/DocumentViewer/en/36-1/FINA/report-12/.

International Monetary Fund. 2025a. “Canada: Financial Sector Assessment Program—Technical Note on Climate Risks Analysis.” IMF Staff Country Reports 2025/234. https://doi.org/10.5089/9798229021920.002.

______________. 2025b. “Canada: Financial Sector Assessment Program—Technical Note on Cyber Resilience of the Financial Sector.” IMF Staff Country Reports 2025/231. https://doi.org/10.5089/9798229021586.002.

______________. 2022. “United Kingdom: Financial Sector Assessment Program — Technical Note on Banking Supervision and Issues in Financial Stability.” IMF Country Reports 2022/105. https://www.imf.org/-/media/files/publications/cr/2022/english/1gbrea2022006.pdf.

______________. 2019. “Australia: Financial System Stability Assessment.” IMF Country Reports 2019/054. https://www.imf.org/en/publications/cr/issues/2019/02/13/australia-financial-system-stability-assessment-46611

Jabotinsky, Hadar Yoana, and Mathias Siems. 2017. “How to Regulate the Regulators: Applying Principles of Good Corporate Governance to Financial Regulatory Institutions.” European Corporate Governance Institute (ECGI) Law Working Paper No. 354/2017. http://dx.doi.org/10.2139/ssrn.2978112.

Office of the Superintendent of Financial Institutions. 2024. “OSFI, Basel III, and Capital Floors.” October 2. https://www.osfi-bsif.gc.ca/en/news/osfi-basel-iii-capital-floors.

______________. 2024. “The OSFI Story.” https://www.osfi-bsif.gc.ca/en/about-osfi/osfi-story.

______________. 2025. OSFI’s Annual Risk Outlook – Fiscal Year 2025-2026. https://www.osfi-bsif.gc.ca/en/print/pdf/node/2625.

Ontario Securities Commission. 2022. “New governance structure takes effect at OSC.” https://www.osc.ca/en/news-events/news/new-governance-structure-takes-effect-osc.

______________. N.d. “Advisory Committees.” https://www.osc.ca/en/about-us/role-osc/advisory-committees.

Organisation for Economic Co-operation and Development. 2010. Making Reform Happen: Lessons from OECD Countries. Paris: OECD Publishing. https://www.oecd.org/en/publications/making-reform-happen_9789264086296-en.html.

______________. 2014. The Governance of Regulators. Paris: OECD Publishing. https://doi.org/10.1787/9789264209015-en.

Privy Council Office. 1999. Guide Book for Heads of Agencies: Operations, Structures and Responsibilities in the Federal Government. Ottawa: Government of Canada. https://www.canada.ca/content/dam/pco-bcp/documents/pdfs/guide-1999-eng.pdf.

Rogers, Carolyn. 2025. “Prosperity through Productivity.” Speech. Bank of Canada. October 9. https://www.bankofcanada.ca/2025/10/prosperity-through-productivity/.

Senate of Canada, Standing Senate Committee on Banking, Commerce and the Economy. 2024. Study on Canada’s Monetary Policy Framework – Interim Findings. Interim report. December. https://sencanada.ca/content/sen/committee/441/BANC/reports/BANC_SS-2_InterimReport_Final_e.pdf

Statistics Canada. 2017. “Fort McMurray 2016 Wildfire: Economic Impact.” Catalogue no. 11-627-M2017007. https://www150.statcan.gc.ca/n1/en/pub/11-627-m/11-627-m2017007-eng.pdf?st=TnD0z4KR.

Task Force on the Future of the Canadian Financial Services Sector. 1998. Change, Challenge, Opportunity: Report of the Task Force on the Future of the Canadian Financial Services Sector. Department of Finance Canada. https://publications.gc.ca/collections/collection_2021/fin/BT22-61-1998-eng.pdf.

Treasury Board of Canada. 2019. Directors of Crown corporations: an introductory guide to their roles and responsibilities. Government of Canada. https://www.canada.ca/en/treasury-board-secretariat/services/guidance-crown-corporations/directors-crown-corporations-introductory-guide-roles-responsibilities.html

Zelmer, Mark. 2024. “Let’s Not Rush New Bank Rules on Capital and Lending.” Intelligence Memos. Toronto: C.D. Howe Institute. https://cdhowe.org/publication/mark-zelmer-lets-not-rush-new-bank-rules-capital-and-lending/.

______________. 2025. Home Advantage: Helping Financial Institutions Prepare for Financial Distress Amidst Rising Geopolitical Tensions. Commentary 692. Toronto: C.D. Howe Institute. https://cdhowe.org/publication/home-advantage-helping-financial-institutions-prepare-for-financial-distress-amidst-rising-geopolitical-tensions/.


Over Fifty Nature Positive Investible Opportunities via World Economic Forum

New Analysis Identifies 50+ Investible Opportunities Delivering Financial Returns

  • More than 50 investible opportunities, across 13 sectors, that are already generating revenue or cost savings for industry and investors have been identified by new World Economic Forum research.
  • Though more than half of global GDP is highly or moderately dependent on nature, capital continues to flow disproportionately towards nature-negative activities, leading to potential systemic risks and undervalued business opportunities.
  • From precision agriculture and sustainable cement to battery recycling and industrial water management, growing numbers of investment opportunities can both protect nature and deliver returns for investors.
  • Learn more about the report here.

Geneva, Switzerland, March 2026 – More than 50 investible opportunities could turn capital flows into lucrative nature-positive business practices and contribute up to $10.1 trillion in annual business revenues and cost savings by 2030, according to a new World Economic Forum report just launched.

The report, 50 Investible Opportunities for a New Nature Economy, developed in collaboration with Oliver Wyman, also highlights how nature risk and capital flow misalignment represents a growing systemic economic risk and a significant missed commercial opportunity for business.


This comes at a time when global capital flows remain deeply misaligned. According to the United National Environment Programme (UNEP), an estimated $7.3 trillion continues to be invested annually in activities that degrade ecosystems, compared to roughly $220 billion invested in nature-based solutions. The report’s 50 investible opportunities offer revenue-generating and cost-saving approaches to close this gap.

Who Is Falling Behind?


Similar to the Paris Agreement for climate targets, the international community is falling behind on biodiversity targets. Renewed action and novel strategies are needed to meet goals of halting and reversing nature loss by 2030.

“We need to transition towards an economic system that delivers prosperity within planetary boundaries,” said Sebastian Buckup, Managing Director, World Economic Forum. “Industries, including the financial sector, will pursue this not just as an act of corporate social responsibility or impact investing but because it makes good business sense to do so.”

As companies face increasing exposure to water scarcity, soil degradation, pollution and tightening environmental regulation, nature-related risks are no longer abstract sustainability concerns but material financial issues affecting long-term profitability.

Drawing on analysis of approximately 250 business activities, the report identifies 50+ investment-ready opportunities across 13 high-impact sectors to support halting and reversing nature loss by 2030.
From precision agriculture and sustainable concrete to battery recycling and industrial water management, these solutions reduce pressure on land, water and resources while generating revenue growth, cost savings and risk mitigation.

Case Study: Sustainable Cement and Concrete Blends


For example, the report looks at sustainable concrete blends as an investible opportunity. These blends reduce reliance on newly quarried raw materials by substituting a portion with recycled industrial byproducts or recovered construction materials. They provide similar structural performance to traditional concrete while helping companies meet regulatory standards and growing market demand for low-impact building solutions.

These blends also have an array of nature benefits, including reducing new quarrying, lowering pollution and reducing the energy intensity needed for new concrete.

While these products are commercially viable today and can often be integrated into existing production facilities with moderate capital investment, many sustainable blends retail at a higher price than conventional concrete, as the latter benefits from established logistics, economies of scale and similar factors that lower costs. As economies of scale are built and business models are derisked, sustainable concrete offers an opportunity for investors to put capital towards a business-ready, nature-positive solution that can generate returns.

“At its core, this is a capital allocation challenge,” said Derek Baraldi, Head of Sustainable Finance, World Economic Forum. “Financial institutions and businesses that integrate nature into strategy today are not just managing risk but positioning themselves for competitive advantage.”

The Role of Capital and Financial Institutions

Financial institutions can help scale these solutions by providing the capital companies need to invest in new production processes and facilities. They can also reduce risk through tools such as sustainability-linked loans, guarantees or blended financing, helping innovative materials reach the market faster.

To support financial institutions looking to invest in nature-positive solutions, the report outlines five priority actions for financial institutions to mobilize capital into nature-positive opportunities. By strengthening internal “nature fluency”, innovating financial products, building coalitions, improving data use and leveraging nature transition conversations to surface investible opportunities, financiers can build a robust pipeline of nature-positive opportunities to deliver both mainstream and sustainable finance.


Business depends on reliable water supplies, fertile soils, biomass and ecosystem services such as pollination and flood protection. Industry successes are already delivering value while supporting nature-positive goals, such as industrial water management to tackle water shortages and precision agriculture techniques that save farmers input costs while reducing fertilizer run-off into waterways. Realigning capital flows with nature-positive investments that protect biodiversity and offer financial returns is essential to safeguarding the natural systems which underpin the global economy.

More about Nature-Positive Transitions


The World Economic Forum’s Nature-Positive Transitions report series explores transformative pathways to halt and reverse nature loss by 2030. Focusing on critical sectors, the series highlights the dual impacts and dependencies of these industries on nature, alongside the priority actions businesses can take to avoid and reduce negative impacts, mitigate nature-related risks, build resilience and unlock opportunities across value chains. Nine sectors have been involved: technology, automotive, cement and concrete, chemicals, household and personal care products, mining and metals, ports and offshore wind.

The World Economic Forum provides a global, impartial, not-for-profit platform and insights to support meaningful connections between political, business, academic, civil society and other leaders. (www.weforum.org).

For the Silo, Jarrod Barker.

Navigating the Great Wealth Transfer: What It Means for Families

The landscape of North American wealth is on the brink of a historic shift. Current research estimates that between $75 trillion usd and $125 trillion usd ($102.5 trillion cad and $170.8 trillion cad) will change hands over the next two decades in American alone as assets pass from the baby boomer generation to younger heirs. This unprecedented movement of capital, now widely referred to as the Great Wealth Transfer, is set to redefine family finances, generational relationships, and the future of estate planning across North America.

While the transfer represents an extraordinary opportunity for Millennials and Gen Xers, it also carries significant legal and emotional risks. Attorney Don Ford, a Board-Certified expert in Estate Planning and Probate Law with Ford + Bergner LLP, warns that without thoughtful preparation, the same wealth intended to provide security can just as easily fracture families and ignite costly disputes.

A Scale Never Seen Before


“The scale of this transfer is unlike anything we have seen before,” explains Ford, Managing Partner at Ford + Bergner LLP—a Texas-based boutique firm specializing in estate planning, probate, and guardianship. “And when large sums of money move quickly through families that are unprepared, conflict becomes far more likely.”

Why This Is Happening Now

Several forces have converged to accelerate this moment.

Americans are living longer, allowing assets to compound over extended periods. Many individuals entering their later years benefited from decades of sustained market growth, dramatically increasing the value of retirement accounts, real estate holdings, and privately owned businesses. Together, longevity and market performance have produced estates that are often far larger and more complex than families anticipate.

Yet wealth has grown faster than planning.

“Many estate plans are static while wealth is dynamic,” Ford notes. “People create documents years earlier and assume they will still work, even though their family structure, asset values, and risks have changed.”

Why Planning Is an Act of Care

Estate planning is often misunderstood as a tax exercise or paperwork requirement. In reality, it functions as a roadmap that protects families, preserves intent, and prevents conflict.

Effective planning allows families to address challenges before they escalate. Trust structures can provide what Ford describes as “training wheels” for heirs who are not yet equipped to manage significant portfolios. Clear language can reduce ambiguity in blended families, ensuring spouses and children from prior marriages are treated according to the individual’s wishes rather than default statutes.

Business continuity is another frequent flashpoint. Without an agreed-upon succession plan, profitable family enterprises can be forced into liquidation simply because heirs cannot agree on control or direction.

“Planning is not about control from the grave,” Ford says. “It is about clarity while you are still here.”

The Rising Tide of Probate Litigation

As wealth transfers accelerate, probate courts in America are bracing for an increase in estate-related litigation and similar situations are set to occur in Canada and Mexico. According to Ford, several recurring issues are already driving disputes.

Cognitive decline and undue influence are among the most common triggers. As older adults reach their eighties and nineties, dementia and other impairments become more prevalent. Late-life changes to wills or trusts are frequently challenged by heirs who believe a loved one was pressured or lacked capacity.

Blended family dynamics also play a major role. Modern families often include second marriages, stepchildren, and competing expectations. When individuals die without updated documents, intestacy laws can produce outcomes no one intended, fueling resentment and lawsuits.

Ambiguous or outdated estate plans remain another risk factor. DIY documents and boilerplate language often fail under scrutiny, leaving courts to interpret vague instructions. Fiduciary disputes are equally common when executors or trustees are accused of mismanagement, lack of transparency, or favoritism.

Family-owned businesses present some of the most complex conflicts. When multiple heirs disagree over leadership, equity, or control, litigation can become the only path forward, sometimes ending in forced sale.

“The tragedy is that most of these disputes are preventable,” Ford emphasizes. “They arise not from greed, but from silence, assumptions, and documents that were never meant to handle modern family realities.”

The Bottom Line

The Great Wealth Transfer is not merely a financial event. It is a social and legal reckoning that will test families’ communication, planning, and preparedness. As trillions of dollars move between generations, proactive estate planning has become less about wealth preservation and more about relationship preservation.

For families willing to plan with intention, the transfer can strengthen legacies rather than divide them. For those who do not, the cost may be far higher than they ever expected.

For the Silo, Merilee Kern.

What Can Be Done About Canada’s Debt Problem?

Presenters at last year’s C.D. Howe Institute’s conference on Canada’s debt problem had some pointed advice for our federal and provincial governments:

  • Canada’s public debt should be reduced about 10 percentage points of Canada’s GDP to ensure fiscal policy can be used to cushion the effects of future economic crises. Since major crises happen frequently, prudence suggests that the target should be achieved before the decade is out.
  • Tax increases harm economic performance, so elimination of public spending that does not provide enough benefits to offset this damage should be the first step in reducing deficits and debt. This will require undertaking comprehensive value-for-money assessments to identify wasteful spending.
  • Post-conference analysis found that achieving this prudent debt target would require increasing the combined federal-provincial primary balance by 1.4 percent of GDP, or $43 billion, starting in 2025/26. This amount includes a buffer – ensuring an 80 percent probability of meeting the debt target – to account for inevitable economic downturns, other crises that raise deficits and debt, and the uncertainty posed by fluctuating interest rates on financing costs.
  • The conference was one of four on deficits and debt held in Canada over the past 40 years. A clear and consistent message from these conferences – which politicians have yet to fully absorb – is that debt has economic costs and, therefore, imposes a burden on future generations. In this Commentary, the authors report on, and offer their analysis of, the findings of the latest conference.

Introduction

Does Canada have a debt problem? The answer from a recent C.D. Howe Institute conference is a resounding “yes.” Canada’s public debt should be about 10 percentage points of GDP lower to ensure sustainability. Given that major crises, which put upward pressure on deficits and debt, happen frequently, this target should be achieved before the decade is out.

The May 2024 conference was one of four on deficits and debt held in Canada over the past 40 years. Each aimed to provide guidance to policymakers on managing deficits and debt. While a common thread was concern about the economic cost of public debt, each conference provided context-specific policy advice.

The first conference, “Deficits: How Big and How Bad?” (Conklin and Courchene 1983), occurred when debt levels were rising rapidly but still relatively low. The key policy issue then was whether fiscal consolidation or expansion to support the economy was appropriate.

In the 1994 conference, “Deficit Reduction – What Pain, What Gain?” (Robson and Scarth 1994), and the 2002 conference, “Is the Debt War Over?” (Ragan and Watson 2004), there were clear recommendations to reduce debt levels. In 1994, this was motivated by concerns over economic damage caused by debt approaching 100 percent of GDP and questions about fiscal sustainability. By 2002, although the debt ratio had fallen substantially, further debt reduction was still advocated to reduce the burden on future generations who will not benefit from the spending.

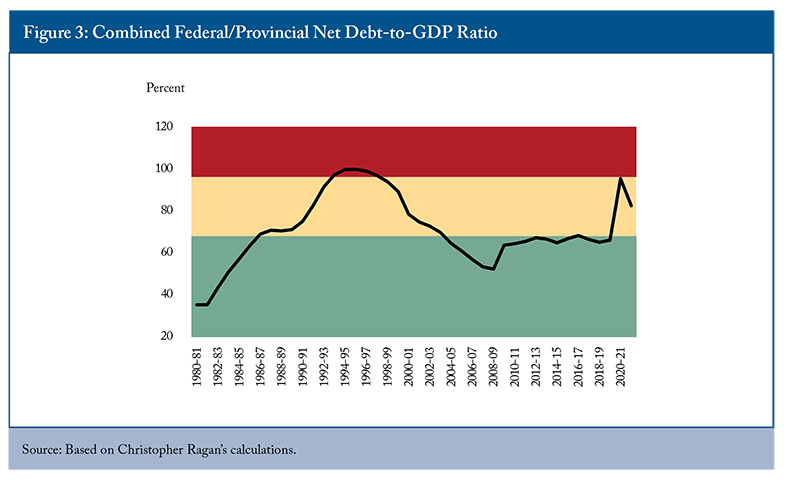
A combination of discretionary measures and sustained economic growth led to a substantial reduction in the combined federal-provincial debt ratio from 2002 until the global financial crisis of 2007-2009. The debt ratio stabilized at a relatively high level after the crisis until the pandemic. The massive increase in debt during the pandemic and subsequent government spending raised the overall federal-provincial net debt ratio to about 75 percent of GDP, nearing levels from the time of the “Debt War” conference. This surge, combined with concerns about further increases, refocused attention on debt sustainability. This concern was reflected in the May conference, “Does Canada Have a Debt Problem?”, which recommended a debt target based on the need for fiscal prudence.

The latest conference included sessions on the economic costs of debt, the sustainability of federal debt, guidance for policymakers on a prudent and fair debt target, and reforming the federal fiscal framework. However, given the one-day format, not all issues could be thoroughly addressed. This report not only summarizes the proceedings but also fills some gaps by providing additional analysis to complement the presenters’ advice.

Economic Costs of Public Debt

Interest expenses were central to the analysis by University of Calgary economist Trevor Tombe of the economic costs of public debt. Interest paid on the public debt is often considered a transfer among individuals with no real impact on the economy. However, higher interest payments for a given level of program spending necessitate higher taxes, which harm economic performance by affecting incentives to work, save and invest. If not financed by tax increases, higher interest payments will crowd out valued program spending.

When discussing the opportunity cost of interest payments – the benefits of lower tax rates or higher program spending – Tombe cited work by Dahlby and Ferede (2022). They estimate the economic cost of raising an extra dollar of tax revenue, referred to as the “marginal cost of public funds” (MCPF). The MCPF includes both the dollar taken from the private sector and the loss in output per dollar of tax revenue raised due to reduced incentives to work, save and invest. Higher taxes shrink the tax base not only because of reduced economic activity but also due to efforts to reduce taxable income without changing economic behaviour.

Dahlby and Ferede (2022) find a very high cost from raising taxes. For the corporate income tax, the federal MCPF in 2021 was approximately two.1The MCPF from raising the top federal personal income tax rate has been higher than its corporate tax counterpart since 2012, when the corporate tax rate was reduced to 15 percent. The gap increased in 2016 when the top federal marginal personal income tax rate increased to 33 percent, pushing the MCPF to about 2.9.

The federal government expects to pay $54.1 billion in public debt charges in the current fiscal year. The economic cost of these payments is substantial. If the opportunity cost of these payments is lower corporate income taxes, their economic cost would also be about $54 billion. If their opportunity cost is a lower top personal income tax rate, their economic cost would exceed $100 billion. If the contribution from corporate income and top personal income tax were equal, the economic cost would be about $75 billion.

Other costs of public debt arise from a reduction in the national savings rate, which is the sum of public and private sector savings rates. Government deficits represent public sector dissaving, so with a constant private savings rate, national savings will decline when governments run deficits. Tombe highlighted the impact of lower national savings on investment, presenting data showing a negative correlation between debt ratios and investment ratios across countries (Figure 1). He stated there is “probably” a causal relationship between higher debt ratios and lower investment ratios.

Although Tombe did not elaborate, there are reasons to be circumspect about asserting causality. One reason is that the private savings rate may rise in response to budget deficits if economic agents anticipate higher future taxes to service the debt. Households might increase savings in anticipation, partially offsetting the decline in national savings. There is evidence that expansionary fiscal policy is partially offset by increased household savings. Johnson (2004) concluded that household savings would increase by 30-50 percent of the increase in government debt. In a recent study of fiscal expansions in the Euro area from 1999 to 2019, Checherita-Westphal and Stechert (2021) found that 19 percent of a fiscal stimulus is offset by higher household savings in the short-term, rising to 41 percent in the long-term.

Another reason for being cautious about inferring causality is that in an open economy, a decline in national savings does not necessarily lead to lower domestic investment, as any shortfall can be offset by borrowing from abroad. However, interest payments on borrowed funds and the return on foreign-owned capital reduce national income. An additional cost arises because the resulting current account deterioration must be offset by higher net exports, which requires a reduction in real wages in the export sector.

To complement Tombe’s analysis, we present an estimate of the economic cost of reduced national savings. In a closed economy with constant household savings, a budget deficit leads to a dollar-for-dollar crowding out of investment. Using historical returns on capital and assuming that national savings decline by 60 percent of the deficit due to offsetting increases in household savings, the $1,372 billion in federal net debt in the current fiscal year would have an economic cost of about $90 billion.2 This calculation does not capture the impact of lower capital intensity on productivity, so it underestimates the true cost.

If foreign savings offset the decline in national savings and foreigners invest directly in Canada, they receive the return on this capital, so the gross economic cost remains the same. However, the return is subject to corporate income tax, so the net economic cost would be about 25 percent lower. If Canadian firms borrow abroad to finance domestic investment, the economic cost is the interest paid to foreigners. While gross interest payments to foreigners will be less than the return on capital unless there is a large country-risk premium, interest payments are taxed more lightly.3 Therefore, the net economic cost may not differ substantially.

An additional cost of accessing foreign savings arises because higher capital servicing charges put downward pressure on the current account balance, which must be offset by an increase in net exports. In a small economy, export and import prices are determined in world markets, so the increase in net exports requires a decline in real wages in the export sector. However, if a country’s exports have unique features, increased supply can lower export prices, adding to the economic cost of borrowing from abroad (Burgess 1996).

Calculating the economic cost of investment crowding out when foreign borrowing is possible as the net-of-tax return on capital paid to foreigners establishes a minimum cost because it excludes the reductions in real wages required to increase net exports. The minimum cost would, therefore, be 0.75 x $90 billion = $68 billion, where the $90 billion reflects the economic cost of lower investment, adjusted by a factor of 0.75 to represent corporate income taxes on the returns paid to foreign investors. The $75 billion cost associated with raising taxes to finance higher federal interest expenses does not change with the availability of foreign financing, so the overall cost of the federal debt is approximately $142 billion, or 4.7 percent of GDP in 2024/25.

A similar calculation can be performed for overall provincial debt. In 2021/22, provincial net debt amounted to $784.7 billion, with debt service charges of $30.6 billion. Using the same weighted average economic cost of taxation as for the federal government, the economic cost of provincial debt service charges was $42 billion. The cost of investment crowding out adds another $39 billion, bringing the total cost of debt at the provincial level to $81 billion, or 3.2 percent of GDP in 2021/22. Assuming provincial debt remains at the same percentage of GDP from 2021/22 to 2024/25, the overall cost of Canada’s debt is about 8 percent of GDP.

Benefits of Debt and Its Optimal Level

Tombe also discussed the benefits of public debt, noting its role in financing long-lived assets, stabilizing the economy and smoothing tax rates over time. Governments should borrow to finance investments that will benefit future generations and should finance current expenditures out of current taxes. Spending on education, health and knowledge creation raises special concerns because it benefits both current and future generations. However, since each generation must make these investments, financing them through current revenues typically aligns with the benefit principle.

Counter-cyclical fiscal policy enhances social well-being by mitigating costly deviations from full employment. Additionally, governments can reduce the harmful effects of distortionary taxes by keeping them stable. Since the efficiency cost of taxes is higher when rates are above average than when rates are below average,4 governments should set tax rates at levels sufficient to support expected spending over the cycle and allow deficits to rise and fall in response to unexpected expenditures.5

An issue absent from discussions at the conference was the role of public debt in addressing market imperfections, which can improve efficiency. One such imperfection is the lack of adequate insurance markets against individual-specific wage income losses. As a result, individuals “self-insure” by increasing savings, which is more costly than paying the premiums in a well-functioning insurance market. Public debt puts upward pressure on interest rates and provides a safe savings instrument, allowing households to reduce their savings closer to the efficient level.

Unlike the efficiency gains from using public debt to stabilize the economy and smooth tax rates, mitigating the impact of inadequate insurance markets may justify a permanent increase in public debt. With a well-functioning insurance market, the optimal public debt ratio would be negative – governments should be net savers rather than net debtors. This would allow governments to finance expenditures from interest received on assets rather than from distortionary taxes.6

Empirical issues raised by the inadequate insurance-market approach include whether correcting the market failure is sufficient to make the optimal debt ratio positive and whether the penalty for deviating from the optimal ratio is significant enough to affect the choice of a debt target. Early analyses of incomplete markets found a positive optimal debt ratio. For instance, Aiyagari and McGrattan (1998) calculated an optimal debt ratio of 66 percent of GDP for the US economy. However, Peterman and Sager (2018), using a model with many of the same features as Aiyagari and McGrattan but incorporating multiple generations with standard life cycles instead of a single generation with an infinite life span, found that net government saving is optimal in the US economy. The main reason for the different result is that individuals in a life-cycle model spend a substantial fraction of their working lives accumulating enough savings to make self-insurance possible, so the benefit from self-insurance is smaller than if infinite life spans are assumed.

These results are less relevant for Canada for two reasons. First, employment insurance and other income support measures are more generous in Canada, so self-insurance leading to excess saving is less of an issue. Second, the US analysis assumes deficits are financed entirely by domestic savings, which is a much less realistic assumption for Canada. Foreign borrowing reduces the optimal debt ratio because it lessens the upward pressure on interest rates, which diminishes the impact of public debt on “self-insurance” savings and raises the cost of debt. James and Karam (2001) modified the Aiyagari and McGrattan model to allow borrowing from abroad, which changes the optimal debt ratio from 66 percent to about -80 percent. This qualitative result – that access to foreign savings reduces the optimal debt ratio – has been confirmed by other researchers (Nakajima and Takahashi 2017; Okamoto 2024; and Cozzi 2022).

This review suggests that the inadequate-markets approach does not reverse the conclusion from standard models that the optimal debt ratio is negative, implying that welfare gains can be realized when debt levels are reduced. However, the studies reviewed indicate that the penalty for deviating from the optimal debt ratio is small. In three of the six optimal debt studies reviewed, it is possible to compare the estimated economic costs. In the Peterman/Sager and Nakajima/Takahashi studies, a one-percentage-point increase in the debt ratio reduces consumption by .003 percent. The corresponding figure in the Cozzi study is much higher, approximately .02 percent. These estimates are very low relative to the estimates presented earlier, which imply a loss of .05 percent per percentage-point increase in the debt ratio.

It seems likely that these models are substantially understating the cost of debt. The benefits would have to be understated by an even larger percentage to overturn the conclusion that governments should be creditors not debtors. Since the argument for incurring debt to improve market efficiency is weak, the debt ratio should be chosen by considering only its impact on generational fairness. However, since debt is one of several factors affecting generational transfers, debt policy may have to deviate from the benefit principle to achieve a desired balance of the well-being of current and future generations.

Sustainability Analysis

High debt also raises concerns about its prudence or sustainability: can the interest expense be financed without requiring tax increases or cuts in program spending in the future? In his presentation, Alex Laurin, the Institute’s Vice President and Director of Research, challenged the federal budget’s claim that federal public finances are sustainable (Canada 2024, 382). The federal government’s sustainability claim is based on long-term projections showing a continuously declining debt-to-GDP ratio, reaching nine percent by 2055/56. Moreover, this trend holds even with less optimistic assumptions about interest rates and economic growth.

Laurin argued that this projection is not a convincing demonstration of sustainability for three reasons:

1) Interest Rate Assumptions: In the base case, the effective interest rate on federal debt (r) remains below the growth rate of the economy (g) for 32 years, which puts continuous downward pressure on the debt ratio. This assumption is inconsistent with the historical record. Over the past 35 and 45 years ending in 2022/23, averages of r-g are positive, at 0.8 and 0.4 percentage points, respectively. Only when the averaging period is extended back to include the high-inflation period starting in the 1970s does the multi-year average turn negative.7

2) Program Spending Assumptions: While revenues are assumed to grow in line with GDP, program spending decreases by about one percentage point of GDP over the projection period, causing the primary surplus to rise and putting downward pressure on the debt ratio. A more realistic “no policy change” assumption would keep the share of program spending roughly constant, allowing an assessment of the sustainability of current spending levels.

3) Exclusion of Economic Downturns: The projection fails to explicitly include economic downturns. Over the last 60 years, Canada has experienced five recessions, each prompting discretionary temporary stimulus measures that permanently increased debt. The policy response averaged 1.09 percentage points of potential GDP for each percentage point deviation from potential GDP (Table 1).

Laurin presented an alternative debt projection, assuming that overall program spending grows in line with GDP from 2029/30 to 2055/56 and that r equals g on average over the projection period.8 With these changes, the decline in the federal debt ratio is less pronounced, reaching 29 percent in 2055/56 compared to 9 percent in the budget projection.

Economic downturns were included in the projection by simulating 1,000 random probabilistic scenarios – assuming the frequency and magnitude of recessions over the past 60 years are representative of the future. Laurin assessed debt sustainability by calculating the probability that the debt ratio remains at or falls below its initial value over the projection period.9 The simulations showed an even chance that the debt ratio will exceed its 2028/29 value late in the projection period. Under the International Monetary Fund’s classification (IMF 2022), Canada’s federal debt would be considered unsustainable.

Some conference participants suggested that Laurin’s analysis might not fully capture the risks associated with the federal fiscal position because it assesses a single r-g profile. They also emphasized the importance of including provincial and territorial governments in any sustainability analysis, as these levels are most affected by demographic aging.

For this report, Laurin modified his approach to include provincial and territorial governments’ net debt and to capture the risks of r-g deviating from its assumed zero average over the long term. He introduced variability in the interest-rate growth-rate gap based on historical data, allowing for a more comprehensive risk assessment (methods and assumptions are provided in Appendix).

The modified analysis showed that, without any simulated shocks, the combined federal and provincial/territorial net debt-to-GDP ratio initially declines and then stabilizes until 2041/42, when rising healthcare costs due to demographic aging – and the associated interest on provincial debt – cause it to rise steadily (Figure 2, black dashed line). Introducing interest rate and recession shocks significantly alters the outlook, indicating a 50 percent chance that the debt ratio will begin its long-term rise in 2035/36, eventually surpassing 100 percent of GDP (black dotted line). There is a 20 percent chance (the 80th percentile) that the debt ratio will not decrease substantially from its current level and start a steady increase in 2033/34 (grey dotted line). Conversely, there is only a 20 percent chance (the 20th percentile) that the ratio will stay below its near-term value for the entire projection period (gold dotted line).

A Prudent and Fair Target

Prudence

According to McGill economist Christopher Ragan, the main concern about Canada’s high public debt is that it will reduce our ability to borrow to address the next economic crisis. He analysed this issue using three zones for the debt ratio: red (top), yellow (middle) and green (bottom) (Figure 3). The red (top) zone, which represents unsustainable debt, starts roughly five percentage points below the 1995 federal-provincial debt ratio’s peak of 100 percent, when Canada entered a period of “forced austerity.” This entry point to the red (top) zone is higher than the 90 percent threshold for negative effects on growth developed by Reinhart and Rogoff (2010). However, the threshold would be lower if the interest rate on public debt (r) were higher than the rate of economic growth (g).

Ragan argued that the current combined federal-provincial debt-to-GDP ratio is in the yellow (middle) “cautionary” zone. The height of this zone is determined by the buffer required to avoid being pushed into the red (top) zone by an economic crisis. Entering the red (top) zone would mean sharply higher interest rates and lower growth.

To avoid this, Ragan set the buffer at 28 percentage points of GDP, about a quarter more than the increase in the debt ratio during the COVID-19 pandemic. Given the frequency of economic crises, he advocated returning to the green (bottom) zone by 2029/30, nine years after the end of the pandemic-induced recession. This requires reducing the federal-provincial debt ratio by about 10 percentage points.

Laurin followed up by determining the fiscal effort required to return to the green (bottom) zone with high probability. His calculations show that, starting in the next fiscal year (2025/26), the combined federal-provincial primary balance would need to increase permanently by 1.38 percent of GDP – or $42.9 billion in 2025/26.10 If implemented through spending reductions, provincial spending would have to decline by about 7 percent, or federal spending would have to fall by almost 9 percent. Note that such spending reductions would still not fully return the combined federal-provincial program spending/GDP ratio to its pre-pandemic 2018/19 value. The federal government could achieve the same effect by raising the GST to 8.5 percent. However, since most spending pressures from an aging population are on provincial governments, it would be sound policy for the federal government to transfer tax points to provincial governments (Kim and Dougherty 2020). Even with near-term fiscal adjustment, additional consolidation may be necessary in the future to prevent a rise in the debt/GDP ratio.

Ragan favoured achieving the debt target through expenditure restraint rather than raising taxes, which he thinks may have reached their limit. Restraining expenditures will be particularly challenging given medium-term pressures from an aging society, rising military and security needs, and potentially increased public investments for the transition to a green economy. Canada, therefore, needs an ongoing and thorough program review to identify low-priority spending.

Fairness

Financing current government spending with debt is generally considered fair if the debt-to-GDP ratio is constant or declining over time, implying that future generations can receive the same level of government services without facing higher tax rates. However, stable tax rates alone are insufficient to prevent intergenerational transfers. Taxes must increase to finance the interest on the debt or remain higher than they would be otherwise. If the tax increase applies to both current and future generations, tax rates would be stable but higher than they would be without the increased debt. The higher tax rates required to finance debt interest and the deficit-induced reduction in national-savings transfer part of the cost of government spending to future generations who do not benefit from the spending.

Assessing generational fairness requires understanding the extent of intergenerational transfers resulting from fiscal policy. The presentation by Parisa Mahboubi, a Senior Policy Analyst at the Institute, offered insights into this issue using generational accounts. These accounts show lifetime net taxes imposed by federal and provincial governments for each birth cohort from 1923 to 2023 and for a composite future generation consisting of all persons born after 2023. The lifetime tax burdens of the 2023 birth cohort and future generations are comparable because a complete life cycle is captured in both cases. Her analysis shows that future generations are expected to face a slightly higher lifetime net tax burden than the youngest living generation.

Preparing generational accounts requires information on lifetime taxes and transfers for each birth cohort alive today and for future generations. Projected values of taxes paid by current birth cohorts are developed based on age-specific profiles of different types of taxes,11 assuming unchanged tax policies. Spending on health, education, elderly benefits, child benefits, social assistance and GST credits vary by age, while other government expenditures are evenly distributed per capita. Per capita taxes, transfers and expenditures are assumed to grow at the same rate as productivity.

The lifetime net tax burdens for currently alive birth cohorts are calculated as the present value of projected tax payments less the present value of projected government transfers the cohort will receive. Lifetime net tax burdens of future generations are calculated using the “no free lunch” constraint: someone, sometime, must pay for all that the government spends (US Congressional Budget Office 1995). The lifetime net tax burden of future generations equals the amount of future spending not paid by currently alive generations.12

In the baseline scenario, productivity grows 0.94 percent annually, the average GDP per capita growth from 2002 to 2022. The discount rate is the average return on real return bonds over the same period, 1.3 percent.13 Statistics Canada’s medium-growth scenario14 is used for demographic projections, with population growing at an average annual rate of 0.85 percent over the 100-year projection, driven entirely by net immigration. The ratio of those over 65 to those aged 18-65 – the old-age dependency ratio – more than doubles over the projection period, rising from 30 percent to 72 percent (Figure 4).

The increase in the old-age dependency ratio drives upward trends in elderly benefits and health-related expenditures as a share of GDP. Other categories of age-specific spending remain roughly constant.

In the baseline scenario, the lifetime net tax burden of future generations (“unborn”) exceeds that of the cohort born in 2023 (“newborn”) by $23,000 per person (Figure 5). Factors influencing this result include:15

  • Fiscal Position in the Base Year: In 2023, federal and provincial tax revenues exceeded program spending by over one percent of GDP. A smaller primary surplus would have decreased the lifetime net tax burden of the newly born, increasing the burden on the unborn.
  • Population Growth: Faster population growth reduces the relative tax burden on future generations by slowing the rise in the old-age dependency ratio and reducing the per-capita burden of existing debt.
  • Healthcare Costs: If real healthcare costs increase faster than productivity growth, the recently born will pay a smaller share, leaving more for future generations.

The baseline assumptions represent the midpoint of a range of plausible values. While results are sensitive to changes in assumptions, the baseline is considered the most likely outcome. The generational accounts, therefore, suggest that fiscal policy is generationally fair.

However, other factors must be considered when assessing fairness:

  • Population Stability: If there were no net population growth, the tax burden on future generations would be much higher, even if the old-age dependency ratio did not change, because the cost of existing debt would be spread over a smaller population. This observation draws attention to the fact that future generations will be paying for services they did not receive, even with stable lifetime net taxes.
  • Income Growth: Future generations will likely be richer due to productivity growth, which could justify asking them to bear some costs of current consumption. However, parents may not wish to pass on costs to their children, even if incomes are rising over time. Population growth through immigration substantially reduces intergenerational linkages, which could encourage the current generation to increase the target size of intergenerational transfers.
  • New Spending Pressures: The generational accounts do not capture new pressures like rising military and security commitments or higher spending to achieve a net-zero emissions economy. In both cases, underspending in the past has pushed costs into the future. Pre-funding some of this spending by increasing taxes in the near term would even out contributions across generations.
  • Comparisons with Near Term Future Generations: Generational accounts compare a representative future generation with the most recent birth cohort. Comparing the tax burden of living generations with the burden on near-term future generations is also relevant.

While the generational accounts indicate that the federal-provincial fiscal stance is fair to future generations under current assumptions, it is beneficial to supplement this analysis with assessments over shorter time horizons. For example, virtually all living generations benefited from the debt-financed income stabilization and health measures implemented during the pandemic-induced recession. There is a strong fairness argument for paying down pandemic-related debt before the next generation starts working and paying taxes, which would occur over the 2035-to-2045 period (Lester 2021).

Federal and provincial Covid-related spending amounted to approximately $430 billion from 2020/21 to 2022/23.16 Federal and provincial debt was $2,092 million in 2022/23. Reducing the level of debt to $1,660 million no later than 2045/46 would be fair to generations born in 2019 and later. However, in Laurin’s prudent scenario, in which debt is sustainable with 80 percent probability, the level of debt rises continuously over the projection period. The gap between the prudent and fair level of debt is $1,200 million in 2035/36. Achieving a fair level of debt would require more fiscal consolidation than is needed to achieve sustainability.

Reforming Expenditure Management

Ragan’s debt target and the recommendation to achieve it through expenditure restraint raise two issues:

1) Building Consensus: How to build a consensus on the proposed debt target and increase the likelihood of achieving it.

2) Identifying Savings: How to identify programs that don’t provide enough value to justify raising taxes to finance them.

Economist and C.D. Howe Institute Fellow-in-Residence John Lester emphasized that achieving a political consensus on a more prudent fiscal approach requires vigorous and sustained advocacy. Part of this advocacy involves convincing governments to surrender some policy flexibility to increase the odds of achieving the target reduction in debt and reduce the risk of relapse after the next crisis.

Lester and Laurin (2023) propose a principles-based fiscal governance framework intended to reduce the bias toward deficit financing in both good times and bad. Governments should adopt guiding principles for fiscal policy, set operational rules for achieving target outcomes and transparently assess consistency with these principles.

At the conference, Lester expanded upon one element of the governance framework: a binding multi-year ceiling on non-cyclical spending. A key motivation for this proposal is the failure to adhere to spending tracks set out in budgets and fiscal updates. For example, in the federal government’s 2019 Economic and Fiscal Update, program spending was projected to decline as a share of GDP, reaching 13.8 percent by 2024/25. The spending ratio projected for 2024/25 increased in successive budgets so that in 2024-25 it will be almost 2 percentage points higher than projected in 2019.18

Binding multi-year expenditure ceilings apply in 11 OECD member countries (Moretti, Keller, and Majercak 2023).19 In the Netherlands and Switzerland, the ceilings are set out in legislation that constrains expenditure growth. Alberta has recently adopted a similar approach.20 However, in most countries, expenditure ceilings are set by the government to ensure consistency with its self-defined fiscal objectives, which may or may not include expenditure restraint. This is the general approach recommended for Canada, although the hope is that the self-defined objective will be to achieve the debt target through expenditure restraint.

The expenditure ceiling would be binding for five years, ideally developed in the first year of a new electoral mandate after a campaign outlining spending plans in detail. The ceiling would cover all categories of spending directly affected by policy decisions. It would be updated annually to account for forecasting errors in program determinants (e.g., inflation, population growth). There would be escape clauses for major economic recessions, natural disasters and war. The ceiling could include a reserve for new policy initiatives, but in the context of expenditure restraint new initiatives may need to be funded by eliminating or modifying existing programs.

Identifying the programs that should be scaled back or eliminated because they don’t provide enough benefits to justify raising taxes to finance them requires, according to Lester, an overhaul of the way the government manages its spending, particularly the performance management framework that is key to establishing value for money. Yves Giroux set the stage for this discussion by describing the federal government’s current expenditure management system.

The requirement to evaluate programs was formalized following the creation of the Office of the Comptroller General in 1978. Despite several modifications, program evaluations have not been successful in affecting strategic spending decisions. The Ministerial Task Force on Program Review (the Nielsen Task Force) from 1984 to 1986 described evaluations as “generally useless and inadequate for the work of program review” (quoted in Grady and Phidd 1993). More recently, McDavid et al. (2018, 302) conclude that evaluations do not “address questions that would be asked as cabinet decision-makers choose among programs and policies.”

Under the current evaluation policy, federal government departments have considerable flexibility in conducting evaluations. They may focus on design and delivery, program beneficiary responses or a comparison of program costs and benefits. A review of 48 evaluations prepared since 2020 in eight departments21 found that only four went beyond assessing operational efficiency and impacts on beneficiaries to examine whether the program represented value for taxpayer money. Three of these applied formal benefit-cost analysis, which is the standard for assessing regulatory proposals.22

Evaluating programs in terms of operational efficiency and beneficiary impacts helps improve programs, but if evaluations are to inform strategic spending decisions, value-for-money assessments must be mandatory. These assessments should be based on the benefit-cost framework applied to regulatory proposals.

Benefit-cost analysis of regulatory proposals – and by extension, spending programs – assesses the overall social benefits and costs of policy initiatives. The quantitative analysis attempts to determine if the economic pie is larger or smaller after government intervention. For example, economic development programs (business subsidies) are implemented with the expectation that they will increase overall real income. To assess this, benefit-cost analysis considers not only the additional investment and employment resulting from the subsidy but also the opportunity cost of workers and capital – the amount that would have been earned otherwise. The net increase in the economic pie is the incremental earnings of workers and capital less efficiency losses from raising taxes or issuing debt to finance the subsidy and resources used to administer and apply for it.

The nature of the assessment should vary by program type. Business subsidies, labour market development programs and climate change mitigation/adaptation measures have benefits and costs measurable in monetary terms. These programs could be ranked by their net social benefits, allowing comparisons within and across program categories. Programs where benefits are less than costs would be candidates for elimination or modification.

A more nuanced approach is needed when assessing social programs and other measures with a fairness goal for several reasons. Their economic impact is ambiguous, and a negative economic impact is not a sufficient reason to eliminate a program. In addition, support for an income redistribution program depends on who benefits from it. As a result, evaluations of social programs should be more descriptive than prescriptive. They should present information on the economic impacts of measures, their fiscal cost, including administration expenses, and a discussion of who benefits from the program and how they benefit. Evaluations should also assess how the program fits into other measures providing support to the target population. This information will allow elected officials and, since all evaluations would be made public, Canadians, generally, to form an evidence-based opinion on the value for money of social programs.

A thorough assessment of government programs through a value-for-money lens may not identify enough wasteful spending to achieve deficit and debt targets. If so, tax increases should be used to achieve the objectives.

Adopting and achieving the debt target will require a political commitment that currently does not exist. The task for policy analysts is to help build a consensus on a more prudent approach to fiscal policy and a revamped expenditure management system. According to Lester, this consensus should be ratified by legislation setting out general principles for sound fiscal policy, supplemented with non-legislated operational rules to guide annual policy and monitor progress. This approach would impose discipline on fiscal policy while allowing flexibility to address unexpected developments. Legislation would strengthen the consensus on fiscal prudence and help prevent backsliding by future politicians.

Conclusion

The evidence presented at the conference confirmed that Canada has a debt problem. Existing debt levels are not prudent, and they raise concerns about generational fairness. Prudence requires that Canada’s public debt be reduced by about 10 percentage points of GDP before the decade’s end. This would require increasing the combined federal-provincial primary balance by 1.4 percent of GDP, or $43 billion, starting in 2025/26.

Tax increases harm economic performance, so elimination of public spending that does not provide enough benefits to offset this damage should be the first step in reducing deficits and debt. Identifying wasteful spending will require comprehensive value-for-money assessments. Governments must not take the easy way out by implementing across-the-board spending cuts. Successful expenditure restraint will also require setting binding multi-year expenditure ceilings to prevent governments from spending revenue windfalls or from increasing spending to improve chances of electoral success.

Canada’s public debt is imposing a burden on future generations. A comparison of the lifetime tax burden on the recently born with distant future generations reveals only a small generational transfer in favour of the recently born. However, burden shifting is much larger from currently living generations to persons born shortly after the pandemic-induced recession. The $430 billion in pandemic-related debt should be paid down by the people that benefited from the income stabilization measures. Achieving this fairness objective would require more fiscal consolidation than needed to ensure sustainability of the debt. For the Silo, Alexandre Laurin/John Lester via C.D. Howe Institute.

Appendix: Assumptions and Methods for the Sustainability Analysis

References

Aiyagari, S. Rao, and Ellen R. McGrattan. 1998. “The Optimum Quantity of Debt.” Journal of Monetary Economics 42 (3): 447–69.

Ambler, Steve, and Craig Alexander. 2015. “One Percent? For Real? Insights from Modern Growth Theory about Future Investment Returns.” E-Brief. Toronto: C.D. Howe Institute. October.

Burgess, David F. 1996. “Fiscal Deficits and Intergenerational Welfare in Almost Small Open Economies.” Canadian Journal of Economics, 885–909.

Canada. 2024. “Budget 2024.” Department of Finance Canada. April.

Checherita-Westphal, Cristina D., and Marcel Stechert. 2021. “Household Saving and Fiscal Policy: Evidence for the Euro Area from a Thick Modelling Perspective.” Available at: https://papers.ssrn.com/sol3/papers.cfm?abstract_id=3992188.

Conklin, David, and Thomas Courchene. 1983. “Deficits: How Big and How Bad?” Special Research Report. Toronto: Ontario Economic Council.

Cozzi, Marco. 2022. “Has Public Debt Been Too High in Canada and the US? A Quantitative Assessment.” University of Victoria, Economics. Available at: http://www.uvic.ca/socialsciences/economics/assets/docs/discussion/ddp2007.pdf.

Dahlby, Bev, and Ergete Ferede. 2022. “What Are the Economic Costs of Raising Revenue by the Canadian Federal Government?” Fraser Institute. Available at: https://roam.macewan.ca/items/73cf71a0-209f-4634-91a7-98d019750638/full.

Grady, Patrick, and Richard W. Phidd. 1993. “Budget Envelopes, Policy Making and Accountability.” Government and Competitiveness Project, School of Policy Studies, Queen’s University. http://global-economics.ca/budgetenvelopes.pdf.

International Monetary Fund (IMF). 2022. “Staff Guidance Note on the Sovereign Risk and Debt Sustainability Framework for Market Access Countries.” 2022–039. IMF Policy Papers.

James, Steven, and Philippe Karam. 2001. “The Role of Government Debt in a World of Incomplete Financial Markets.” Department of Finance, Economic and Fiscal Policy Branch.

Jenkins, Glenn, and Chun-Yan Kuo. 2007. “The Economic Opportunity Cost of Capital for Canada-an Empirical Update.” Queen’s Economics Department Working Paper. Available at: https://www.econstor.eu/handle/10419/189409.

Johnson, David. 2004. “Does the Debt Matter?” In Is the Debt War Over, pp. 173–96. Montreal: Institute for Research on Public Policy. Available at: https://books.google.com/books?hl=en&lr=&id=s4VcGvjVX0MC&oi=fnd&pg=PA173&dq=%E2%80%9CDoes+the+debt+matter%3F%E2%80%9D+&ots=t0fNWzkyoC&sig=TIQrfQbAitqgSIDuHypw_FT6Eeo.

Kim, Junghum, and Sean Dougherty (eds.) 2020. “Adaptability, accountability and sustainability: Intergovernmental fiscal arrangements in Canada,” in Ageing and Fiscal Challenges across Levels of Government, OECD Publishing, Paris.

Lester, John. 2024. “Minding the Purse Strings: Major Reforms Needed to the Federal Government’s Expenditure Management System.” Available at: https://www.cdhowe.org/sites/default/files/2024-09/For%20advance%20release%20EMS%20E-Brief_359.pdf.

Lester, John, and Alexandre Laurin. 2023. “Ottawa Needs a New Approach to Fiscal Policy.” E-Brief 338. Toronto: C.D. Howe Institute. Available at: https://papers.ssrn.com/sol3/papers.cfm?abstract_id=4397967.

Mahboubi, Parisa. 2019. Intergenerational Fairness: Will Our Kids Live Better than We Do? Commentary 529. Toronto: C.D. Howe Institute. January.

McDavid, Jim, Astrid Brousselle, Robert P. Shepherd, and David Zussman. 2018. “Linking Evaluation and Spending Reviews: Challenges and Prospects.” Canadian Journal of Program Evaluation 32 (3): 297–304. https://doi.org/10.3138/cjpe.43176.

Modigliani, Franco. 1983. “Government Deficits, Inflation and Future Generations.” In Deficits: How Big and How Bad, pp. 55–71.

Moretti, Delphine, Anne Keller, and Marco Majercak. 2023. “Medium-Term and Top-down Budgeting in OECD Countries.” OECD Journal on Budgeting 23 (3). https://www.oecd-ilibrary.org/content/paper/39425570-en.

Nakajima, Tomoyuki, and Shuhei Takahashi. 2017. “The Optimum Quantity of Debt for Japan.” Journal of the Japanese and International Economies 46:17–26.

Okamoto, Akira. 2024. “The Optimum Quantity of Debt for an Aging Japan: Welfare and Demographic Dynamics.” The Japanese Economic Review. May. Available at: https://doi.org/10.1007/s42973-024-00156-7.

Panizza, Ugo, Richard Varghese, and Yi Huang. 2019. “Public debt and private investment.” Centre for Economic Policy Research. VOXEU Column. December 4.

Peterman, William, and Erick Sager. 2018. “Optimal Public Debt with Life Cycle Motives.” https://papers.ssrn.com/sol3/papers.cfm?abstract_id=3187698.

Ragan, Christopher, and William G. Watson. 2004. “Is the Debt War Over?: Dispatches from Canada’s Fiscal Frontline.” Vol. 45. IRPP. Available at: https://books.google.com/books?hl=en&lr=&id=s4VcGvjVX0MC&oi=fnd&pg=PP11&dq=%22Is+the+debt+war+over%3F%22&ots=t0fNWqoDsw&sig=Q1poOT4AbHtIkx_NVf5GjrcXEtc.

Reinhart, Carmen M., and Kenneth S. Rogoff. 2010. “Growth in a Time of Debt.” American Economic Review 100 (2): 573–78. https://doi.org/10.1257/aer.100.2.573.

Robson, William, and Parisa Mahboubi. 2024. Another Day Older and Deeper in Debt: The Fiscal Implications of Demographic Change for Ottawa and the Provinces. Commentary 665. Toronto: C.D. Howe Institute. August.

Robson, William, and William Scarth. 1994. Deficit Reduction – What Pain, What Gain? (Policy Study 23). Toronto: C.D. Howe Institute.

US Congressional Budget Office. 1995. “Who Pays and When? An Assessment of Generational Accounting.” Available at: https://www.cbo.gov/sites/default/files/cbofiles/attachments/Genacct.pdf.

Canada Debt Becoming Unmanageable Economists Warn

With the Canadian government’s high debt-to-GDP ratios, such as a ratio of debt to nominal GDP sitting at 68 percent in March 2023, economists warn that government debt could become unsustainably high if Ottawa fails to reduce spending, increase productivity, and re-establish business confidence.

“We’re not growing our income per capita, which means that we’re not going to get the tax revenues that we need, plus we’re getting a lot of people retiring. So the situation could end up becoming quite unmanageable if we keep our pace that we’re going,” said Jack Mintz, president’s fellow at the University of Calgary’s School of Public Policy.

The federal government has run back-to-back budget deficits since the 2008 financial recession, with government spending spiking during the COVID-19 pandemic. As a result, Canada’s debt as a percentage of nominal GDP rose from around 51 percent in 2009 to 74 percent by 2021, for example. Nominal refers to the current value for the particular year without taking inflation into account.

The two previous federal budgets have attempted to lower government spending, but the federal government will still post a $40 billion deficit in 2023–24, which they project will shrink to a $20 billion deficit by 2028–29.

The Liberal government’s response to criticism by the opposition that Canada’s debt could lead the country into a financial crisis has been that Canada has among the best debt-to-GDP ratios in the G7.

According to Mr. Mintz, while Canada’s debt situation is not as bad as it once was, it doesn’t mean that it may not impact Canada’s prosperity prospects.

Conrad Black: Budget 2024 Is an Assault on Canadian Investment

ANALYSIS: Higher Income Taxes Not Only for Wealthy in Budget 2024

Mr. Mintz points out that Canada’s debt situation is not nearly as bad as in 1996. The government’s ratio of debt to nominal GDP ratio reached 83 percent that year.

Mr. Mintz also noted that Canada continues to have a triple-A credit rating according to the world’s leading credit agencies, meaning the country’s debt is not yet seen as problematic.

“We’re still viewed as having a much better credit line compared to a number of other countries. … But at some point, the credit agencies might look at that gross debt number and start asking the question, ‘Is it starting to become unsustainable?’” he said.

Lower Productivity Hampering Debt Payments

The federal government’s ability to pay off its debt could be hampered by low productivity, according to Steve Ambler, professor emeritus of economics at Université du Québec à Montréal.

“The thing that worries me in terms of federal government debt is we are currently in a period of extremely low productivity growth and low overall growth,” he said.

In March, the Bank of Canada’s senior deputy governor Carolyn Rogers warned that Canada’s poor productivity had reached emergency levels.

Although Statistics Canada said the country’s labour productivity showed a small gain at the end of 2023, that came after six consecutive quarters of productivity decline.

The right honourable Jean Chrétien.

Mr. Ambler said an appropriate way to lower the debt-to-GDP ratio is to keep government spending from increasing while also raising productivity to increase tax revenues. He said this was the strategy of Prime Minister Jean Chrétien, whose Liberal government established a budget surplus in three years by growing the economy and keeping government spending stagnant.

To lower Canada’s debt-to-GDP ratio, Mr. Ambler said the government should focus on increasing worker productivity, allowing its resource sector to grow, and easing back on discretionary spending.

He also cited a November 2023 C.D. Howe paper showing that business investment per worker in Canada has shrunk relative to the United States since 2015. Investments such as better tools for workers would increase productivity, while productivity growth would in turn create opportunities and competitive threats that spur businesses to invest, the paper said.

“Re-establishing business confidence would be almost the number one priority, especially in the resource sector,” Mr. Ambler said, adding that a future government might also be wise to lower the feds’ “wildly extravagant subsidy programs” for the electric vehicle (EV) sector.

The Liberal government has given tens of billions of dollars in subsidies for EV manufacturing projects in Canada since 2020, saying the factories will eventually create thousands of new jobs.

‘No Cushion’ to Mitigate Debt Issue

Joseph Barbuto, director of research at the Economic Longwave Research Group, has a more pessimistic view of Canada’s debt. He says that while federal debt is at levels similar to the 1990s, the crisis will be “larger” because the government does not have the “fiscal room to mitigate the downturn.”

Mr. Barbuto said that while the Canadian government was able to help alleviate its debt issues in the 1930s and 1990s by lowering its interest rates, it does not have that same luxury in 2024. The Bank of Canada lowered its key policy rate from 1.25 percent to 0.25 percent in 2020, and was forced to raise it to 5 percent by 2023 in response to rising inflation.

“There’s no interest rate cushion on the other side. Interest rates can only fall back to zero,” Mr. Barbuto said, noting that higher interest rates make it more difficult for governments to service their debt.

“The problem with the monetary system is there’s no fiscal discipline that is pushed on governments, unlike [individuals] or corporations,” he said.

“There will be a point where because of the accumulated interest with rising interest rates, eventually it’s going to overwhelm the government and then people will not lend the government any kind of capital.”

Mr. Barbuto also expressed concern over Canada’s private debt-to-GDP ratio. Private debt refers to debt owed by private, non-financial entities such as businesses and households, as opposed to public debt owed by governments and banks. Canada’s ratio of private debt to nominal GDP sat at 217 percent in December 2023 compared to 124 percent in 1995.

Mr. Barbuto said Canada’s private debt-to-GDP ratio is higher than that of Japan’s in the 1990s, and pointed out that the Japanese economy had stagnated after the country’s asset price bubble burst in 1992.

The research director believes the Canadian economy will eventually see a debt crisis and collapse in real estate that will result in austerity measures, a shrinkage in the size of government, and the “creative destruction” of the old political and economic system. He said this would be the continuation of an economic cycle that has repeatedly happened throughout history.

“[It’s] inevitable and necessary. A debt detox or deleveraging is the same thing as a drug detox. Nobody likes it, … but it’s a necessary part of the cycle for it then to go back up,” he said.

For the Silo, Matthew Horwood/Epoch Times.

International Monetary Fund- World Economy Still Recovering

The IMF announced today (Tuesday, April 11, 2023) in the World Economic Outlook’s press briefing that the baseline forecast for global output growth is 0.1 percentage point lower than predicted in the January 2023 WEO Update, before rising to 3.0 percent in 2024.

“The world economy is still recovering from the unprecedented upheavals of the last three years, and the recent banking turmoil has increased uncertainties.”

“We expect global output growth to fall from 3.4% last year to 2.8% in 2023, before rising to 3% in 2024, mostly unchanged from our January projections. Advanced economies are expected to see an especially pronounced growth slowdown from 2.7% in 2022 to 1.3% in 2023. Global headline inflation is set to fall from 8.7% in 2022 to 7% in 2023 on the back of lower commodity prices but underlying core inflation is proving to be stickier. Importantly, this outlook assumes that recent financial stresses remain contained,” said Pierre-Olivier Gourinchas, the IMF’s Chief Economist.

Much uncertainty clouds the short- and medium-term outlook as the global economy adjusts to the shocks of 2020–22 and the recent financial sector turmoil. Recession concerns have gained prominence, while worries about stubbornly high inflation persist.

Chart- world economic outlook projections including Canada.

“Once again, risks are heavily tilted to the downside, they have risen with the recent financial turmoil. Most prominently, recent banking system turbulence could result in a sharper and more persistent tightening of global financial conditions. The simultaneous rate hikes across countries could have more contractionary effects than expected, especially as debt levels are at historical highs. There might be a need for more monetary tightening if inflation remains stickier than expected. These risks and more could all materialize at a time when policymakers face much more limited policy space to offset negative shocks, especially in low-income countries,” added Gourinchas.

With the fog around current and prospective economic conditions thickening, policymakers have a narrow path to walk towards restoring price stability while avoiding a recession and maintaining financial stability. Achieving strong, sustainable, and inclusive growth will require policymakers to stay agile and be ready to adjust as information becomes available.

“First, as long as financial stress is not systemic as it is now, the fight against inflation should remain the priority for central banks. Second, to safeguard financial stability, central banks should use separate tools and communicate their objectives clearly to avoid unwarranted volatility. Financial policies should remain laser focused on preserving financial stability and watch for any buildup of risks in banks, non-banks, and the real estate sectors. Third, in many countries fiscal policy should tighten to ease inflation pressures, restore debt sustainability, and rebuild fiscal buffers. Finally, in the event of capital outflows that raise financial stability risks, emerging market and developing economies should use the integrated Policy framework, combining temporary targeted foreign exchange interventions and capital flow measures where appropriate,” said Gourinchas.

Threat to Prosperity: Canada Should Mind Business Investment Gap

August, 2022 – Business investment in Canada is so weak that capital per member of the labour force is falling, and the implications for incomes and competitiveness are ominous. Governments, particularly the federal government, need to get serious about growth to get workers more of the tools they require to compete and thrive, according to a new report from the C.D. Howe Institute.

In “Decapitalization: Weak Business Investment Threatens Canadian Prosperity”, authors William B.P. Robson and Mawakina Bafale write that since 2015 Canada’s stock of capital per available worker has been declining and its rate of gross investment per worker has been well below that in the United States and other OECD countries.

Capital= Business “bread and butter”

They examine why Canada might be lagging as well as what action to take.

“Business investment and productivity are closely related: productivity growth inspires investment by creating opportunities, and investment drives productivity growth by equipping workers with more and better tools,” says Robson. “Investment per available worker lower in Canada than abroad tells us that businesses see less opportunity in Canada, and prefigures weaker growth in Canadian earnings and living standards than in other OECD countries.”

New investment per available worker in Canada, adjusted for purchasing power, was only slightly above 50 cents for every dollar of investment per available United States worker in 2021 – lower than at any point since the beginning of the 1990s. In addition, in 2022, OECD projections show that Canadian workers will likely enjoy only 73 cents of new capital for every dollar enjoyed by their counterparts in the OECD excluding the US, according to Robson and Bafale.

The authors’ calculations from OECD projections for 2022 show $20,400 of new capital per available worker this year for OECD countries excluding the United States, compared to $14,800 for Canada.

In other words, new capital per available worker in Canada will be more than one-quarter less than in those countries this year.

Declines in the stock of machinery and equipment (M&E) and intellectual property (IPP) per member of the workforce are particularly worrisome, the authors explain, because those types of capital may be particularly important for economy-wide productivity. “Whatever special messages the recent M&E and IPP numbers may convey, the message from stocks of business capital overall is clear: the average member of Canada’s labour force began 2022 with less capital to work with than she or he had in 2014,” says Bafale.

Robson and Bafale identify a few probable causes for Canada’s dismal investment performance. These include: weak business in the natural resource industries; restricted access to finance for small and mid-size firms; a loss in Canada’s competitive edge in business taxation, notably against the United States; an uncongenial environment for IP investment; regulatory uncertainly; unpredictable fiscal policy; and governments’ in-house spending and transfers to households that are steering resources into consumption and housing rather than non-residential investment.

Is business investment capital trajectory predetermined?

“The prospect that Canadians will find themselves increasingly relegated to lower value-added activities relative to workers in the United States and elsewhere, who are raising their productivity and earnings faster, should spur Canadian policymakers to action,” conclude Robson and Bafale. “The first step is to recognize that recent trends are a symptom of threats to Canada’s prosperity and competitiveness – that low business investment is a problem that governments can and should address.”

Supplemental- Are you a small Canadian business frustrated with the difficulties involved in accessing capital? For example, our experience has shown that the multitude of Business Development Corporations operate with autonomy but without accountability, poor vision and nepotism. Essentially, gleaning business plans and strategies before revealing ‘jump through these application hoops” which include personal finance and personal life details. It is sobering to discover that they also receive a hefty commission % for every applicant they ‘certify as successful’. Do you agree or have you had a more positive experience? We want to hear from you in the comments below.

Should You Take Out a Second Mortgage?

With housing prices cooling off a bit but still generally soaring in cities across Canada, many homeowners are asking themselves how they can cash in on the market without actually having to sell their property. For many, a second mortgage will be the ideal way to do so.  

Second mortgages are one of the perfect mortgage solutions for homeowners who want to tap into their home equity to get lump-sum cash payments at low rates of interest. If you want to know if a second mortgage is right for you, here are three questions you should ask yourself. 

1. How Much Home Equity Do I Have? 

Before you start approaching mortgage brokers about a second mortgage, it’s a good idea to do some calculations around home equity, as the amount of money available to you through a second mortgage is determined by how much home equity you have.  

Fortunately, home equity is easy to calculate: simply subtract your existing mortgage from the current market value of your property. The difference is your home equity — the amount of your home value that you own outright.  

If you don’t know how much your home is worth, you can use a free calculator like this one to get a general estimate based on the going rate for properties in your neighbourhood. 

2. Should I Get a Home Equity Loan or Refinance? 

Generally speaking, there are two ways a homeowner can cash out a percentage of their equity: through refinancing or through a second mortgage. Both can be good ways to unlock capital, but which option you go for will depend in part on your financial situation. 

  • Refinancing: When you refinance your home, you replace an existing mortgage loan with a new mortgage loan. This new loan can be negotiated to include a cash payout based on your home equity, and while cashing out will likely extend the time it takes to pay off your mortgage, you will still only be dealing with a single mortgage loan.  
  • Second Mortgage: A second mortgage is an additional mortgage loan taken on against your home equity. Because it is an additional loan, it will usually come at a higher interest rate. 

In Canada, most mortgages are refinanced every five years, but they can also be refinanced more frequently. But if you already have a low interest rate on your existing mortgage and rates are increasing, a second mortgage may be the cheapest way to turn equity into cash. 

3. Will this Loan Save Me Money? 

A second mortgage can be a powerful financial tool, but it isn’t free money: you will still need to pay it back with interest, so you should be careful about how you use it.  

Taking out a second mortgage to consolidate debt, or to build an addition on your house, are smart investments because they put your money to work by reducing your interest payments or enhancing the value of your property. This puts you in a better financial position than you would have been if you didn’t borrow the money.  

Doing a cost/benefit analysis and working out how much money borrowing against home equity will save you is the key to making a strategic decision. 

Given how much real estate values have gone up over the past few years, figuring out how you can use your newfound wealth to improve your financial situation is essential for good money management. If you want to know more about whether a second mortgage is right for you, get in touch with a local mortgage broker to explore interest rates and options.  

Feautured image: Precondo CA Via Unsplash/ Silo Content Production

5 Home Renos That Add The Most Home Value

Whether you wish to improve your living space or you are going to sell your home, a home renovation will add instant value to your property. 

Many home buyers are looking for homes that are ‘move in ready’ and don’t require much or any work prior to moving in. Because of this desirability, many homeowners are deciding to make upgrades to their home to increase the resale value. If you have a number of projects in mind that are on your ‘wish list’, but aren’t sure which one to start with, you might find these suggestions helpful. 

  1. Kitchen Remodel – This is probably the biggest project that you will undergo, but the one that has the most impact. The kitchen is the most used room in a house and the central hub for most activities. Thus, it makes sense to have a kitchen that is both functional and attractive. If the cabinets are old looking and the countertops are in poor condition, it is hard to overlook. For some, a major renovation might be out of reach, but there are smaller scale options that will also work to spruce up the appearance. You can add a fresh coat of paint or even just reface the cabinetry with new wood panels and hardware. Overall, you can likely recoup 60% to 80% of the cost of the kitchen remodel. 
     
  1. Garage Door Replacement – A garage door makes a great design element to your home as it is one of the first things people see when they come to your home. Although it doesn’t always top the list of most popular projects, it should not be overlooked in terms of overall home value and curb appeal. Over 80% of Realtors believe a new garage door can impact home value – all the more reason to take on this project. 
     
  1. Fiberglass Entry Door Replacement – Nothing makes a more impactful statement than the attractiveness of your front door. Replacing the standard fiberglass entry door to something more stylized to your home will add to the ‘first impression’ element of your home. There are many attractive alternatives for a front door and finding a suitable design that goes with the home will add value straight away without having to undergo a major renovation. According to a recent study, replacing your front door has an average ROI of 75%.   
     
  1. Window Replacement – Having old windows with cracked or chipped frames greatly affects the look of your home. Potential buyers will notice them and so do appraisers. If you’ve got questions about buying new windows, get the answer from a reputable company before you buy. Replacing the windows in your home can add thousands of dollars to its market value, and with an average  ROI of up to 85%, so it makes sense to consider it as a priority upgrade option, especially if you are planning on selling in the near future.  
     
  1. Deck Addition – A wood deck addition falls on the inexpensive side of remodeling projects, but it’s one of the more valuable. In fact, some experts claim that installing a deck can increase the value of your home significantly more than if you were to add another bathroom or living room at a fraction of the cost. The overall cost of installing a deck will largely depend on the size of the deck and material you use. However, most homeowners will recoup nearly 70% of the build cost after they have sold their home.  

If you want to take on any of these home improvement projects, but don’t have the immediate cash on hand to make them a reality, then a home improvement loan might be something to consider.  

3 Best Steps To Find The Best Home Renovation Contractor For Your House |  listofinformation

What is a home improvement loan? 

A home improvement loan can be a home equity loan, a HELOC loan, or any loan using home equity used for home improvement purposes. Borrowers will typically use these types of loans to access the capital they need to build on their investment. 

According to a recent study, the value of residential mortgage loans from alternative lenders is steadily growing. Canadians are choosing to opt-out of traditional lenders’ extended waiting periods and paperwork and are finding that working with a mortgage broker is an easier, more streamlined process that saves time, effort and money. If you are a homeowner considering a renovation to your home, a reputable broker such as Burke Financial can help you with every stage of the process.