Did you know that the majority of Ontario Wasaga beaches are no longer protected, including critical piping plover habitat? That’s because the Ontario government recently removed Wasaga’s beaches from the Provincial Park and are giving them to the municipality despite fierce opposition from Ontarians, including many of you.
Wasaga’s beaches are the birthplace of 70 percent of all Ontario-fledged piping plovers that have survived to adulthood since the species returned to Ontario in 2007. This irreplaceable habitat is now at immediate risk from destructive mechanical beach and sand dune raking planned by the Town Council for as soon as this spring.
Emergency Order
Although Wasaga’s beaches are no longer in a Provincial Park, there is still a way to protect the piping plover. The Federal government can and should issue an Emergency Order under the Species at Risk Act to protect this endangered shorebird from the destruction of the places where it eats and raises its young.
While this solution seems obvious, ensuring the Federal government does the right thing is not guaranteed. That’s why we urgently need your help. We want to launch a comprehensive public awareness campaign to mobilize Ontarians to push the federal government to fulfill its responsibility and protect Wasaga’s critical piping plover habitat. Will you help us?
Mechanical Raking Of Beaches
Time is running out. The Town of Wasaga Beach has already purchased mechanical raking equipment and announced a development plan that would bring beach clearing and raking to known piping plover nesting and feeding sites.
Mechanical beach raking destroys the natural debris piping plovers need to nest, forage, and hide from predators. Evidence from other Ontario beaches shows that once raking occurs, plovers often fail to return. With only three other active breeding sites left in Ontario, the loss of Wasaga would be catastrophic.
Environmental Defence has successfully fought and saved the homes of this bird before. After years of advocacy, we stopped the illegal bulldozing of piping plover habitat at Saugeen Beach (formerly known as Sauble Beach), and we will use our experience to fight the habitat destruction now threatening Wasaga. We know that only the immediate action of the federal government stands between the loss and the survival of the endangered piping plover on Wasaga’s beaches. The time for action is now.
Tourism Balance Can Be Established
The Town of Wasaga Beach is, and can continue to be, both a thriving home for endangered piping plovers and a world-class tourism destination. Together, we must demand that the federal government issue an Emergency Act under the Species at Risk Act and prevent the irreversible loss of Wasaga’s piping plover habitat. We hope we can count on your support by clicking here.
This report via our friends at Canadian thinktank C.D. Howe Institute, argues that front-end security screening cannot replace in-person questioning at a hearing.
Accepting Asylum Claims Without Hearings Raises Legal, Security, and Integrity Risks
January, 2026 – Since 2019, the Immigration and Refugee Board of Canada (IRB) has accepted tens of thousands of asylum claims without holding an oral hearing through a paper-based process known as “File Review.” A new report from the C.D. Howe Institute argues that this policy raises serious legal, security, and governance concerns, may exceed the IRB’s authority, and risks undermining core safeguards in Canada’s asylum system.
In “Accepting Asylum Claims Without a Hearing: A Critique of IRB’s ‘File Review’ Policy,” lawyer James Yousif examines how File Review originated as a pilot during the 2017 Yeates Review, when structural reforms, including the possible dissolution of the Refugee Protection Division (RPD), were under consideration. The policy was formally institutionalized in 2019. Introduced as an efficiency measure, the policy allows certain categories of claims – defined by nationality and claim type – to be accepted without questioning claimants or holding a hearing.
Irreplaceable: Oral Interview
The report argues that front-end security screening cannot replace in-person questioning at a hearing, which can reveal inconsistencies, misrepresentation, and inadmissibility concerns that may not be detectable through document review alone.
The report finds that File Review did not achieve its stated objective of reducing the asylum backlog. Despite substantial increases in IRB staffing, resources, and annual decision output between 2016 and 2024, the backlog expanded dramatically from roughly 17,000 claims to nearly 300,000. Over the same period, Canada’s overall asylum acceptance rate rose to approximately 80 percent, roughly double that of peer jurisdictions.
While global migration pressures, post-pandemic travel patterns, and other policy factors contributed to the surge in claims, the report cautions that maintaining a policy that permits rapid acceptance of claims without hearings may reinforce perceptions of speed, success, and reduced scrutiny – potentially increasing Canada’s attractiveness as an asylum destination.
So Called ‘Soft Law’ Was Used To Implement Policy
The report notes that File Review was implemented by the IRB unilaterally using a Chairperson’s Instruction, a form of internal “soft law” typically used for tribunal operations, not for system-wide policy change. The report also raises concerns about adjudicative independence. It argues that File Review may improperly fetter the discretion of RPD adjudicators, delegate aspects of fact-finding functions to non-adjudicative staff, and impose a mandatory internal consultation process. These features, the report suggests, may be inconsistent with established principles of administrative law.
The report concludes that the File Review policy should be brought to an end and that the default requirement of oral hearings should be restored. While this would likely reduce short-term decision volumes, the author argues that a more rigorous adjudicative process would strengthen long-term system integrity, better protect genuine refugees, and help restore public confidence.
“Efficiency gains that rely on shortcuts may prove illusory,” says Yousif. “A policy that prioritizes speed over scrutiny risks reinforcing the very pressures it is meant to relieve.”
Ottawa’s forthcoming AI strategy needs to walk a tightrope between two equally important principles: safeguarding Canadians from possible misuses of AI but also giving our private and academic sectors the leeway to use Canada’s AI strengths to develop and commercialize new technologies and products.
Planned AI adoption rose sharply between Q3 2024 and Q3 2025, but progress remains highly uneven across industries. Knowledge-intensive sectors – such as information and cultural industries, finance and insurance, and healthcare – show the strongest gains, while several goods-producing and operational sectors, including manufacturing, wholesale trade, and mining, show stagnant or declining expectations.
The federal government must clearly define a framework for responsible, widespread AI innovation – one that encourages beneficial development and adoption while setting firm expectations about the harms innovators must avoid.
Canada’s competition reforms must keep pace with data-driven business models by empowering authorities with modern tools to detect, assess, and stop conduct that genuinely harms competition, innovation, or consumers.
The explosive growth of online shopping is reshaping Canadian retail by empowering consumers with unprecedented choice, driving omnichannel innovation, and intensifying competition.
December, 2025 – Trade tensions, regulation and growth-stifling taxes are depressing business investment in Canada, undercutting productivity growth and workers’ incomes, according to a new C.D. Howe Institute report. The report notes that the US is far more robust, hurting Canadian competitiveness and threatening to widen the gap between US and Canadian living standards.
.William B.P. Robson and Mawakina Bafale warn that (read below) a decade-long decline in capital per member of Canada’s labour force is putting Canada on a path toward a more labour-intensive, lower-wage economy. The authors urge policymakers to equip Canadian workers with the tools they need to compete and thrive.
Canada stuck in a vicious cycle
“Canada is stuck in a vicious cycle. We need higher productivity to spur capital investment – but we need higher capital investment to spur productivity,” says Robson, President and CEO of the C.D. Howe Institute. “Canadian workers today effectively have less and older capital to work with than they did a decade ago. We need to address this crisis by fixing growth-stifling regulations and taxes.”
Looking globally, the picture is even more concerning. Many OECD peers, and most notably the United States, have increased their investment levels more strongly than Canada, widening longstanding gaps. For example, in 2024, Canadian workers received 41 cents of machinery and equipment investment for every dollar received by US workers. The pattern is similar in intellectual property, where Canadian workers received just 32 cents for every US dollar of investment. These gaps translate directly into differences in productivity and wages, and they affect Canada’s ability to attract and retain talent.
Robson and Bafale identify several factors behind Canada’s weak investment performance: a long-standing tilt toward residential construction; regulatory delays for major projects; tax structures that discourage scaling up; elevated government consumption crowding out private investment; and growing policy and trade uncertainty. Rising US protectionism and the upcoming 2026 CUSMA review add an additional layer of risk for Canadian businesses assessing long-term investments.
To reverse the decline, the authors call for streamlined regulations, more competitive tax policies, stronger innovation support, a clearer path for energy investment, and a more assertive trade strategy.
“We need a renewed focus on growth and investment,” says Bafale, Research Officer for the C.D. Howe Institute. “Without faster, clearer rules and stronger incentives for businesses and workers, Canada will continue to fall behind its international peers.”
Business investment in Canada has been so weak since 2015 that capital per member of the workforce is falling, undermining growth in labour productivity and compensation.
The longstanding gap between investment per available worker in Canada and other OECD countries narrowed from the late 1990s through the early 2010s, but has since widened, especially relative to the United States. In 2025, Canadian workers will likely receive only 70 cents of new capital for every dollar received by their counterparts in the OECD as a whole and 55 cents for every dollar received by US workers.
Labour productivity and business investment go together. Rising productivity creates opportunities and competitive pressures that spur businesses to invest. Investment increases productivity by equipping workers with better tools. Low investment per worker signals that businesses see fewer opportunities in Canada and prefigures lagging growth in earnings and living standards.
Regulatory and fiscal policy changes, particularly those affecting natural resources and investment-related taxes, can prevent Canadian workers from being relegated to lower value-added activities compared to their counterparts in the United States and other advanced economies.
Introduction and Overview
Slow growth in Canadian productivity and living standards has become a top-of-mind concern for Canadian economy watchers and, increasingly, for Canadians themselves. Recent publications highlight Canada’s declining real gross domestic product (GDP) per person and its ominous implications for future living standards (Porter 2024, Marion and Ducharme 2024, McCormack and Wang 2024). Escalating trade tensions between the United States and Canada have led many firms to delay investment decisions (Bank of Canada 2025). Sluggish productivity growth has been a key factor behind Canada’s stagnant living standards, as the Organisation for Economic Co-operation and Development (OECD) recently highlighted in its Economic Survey of Canada (OECD 2025a).
The OECD predicts that the real GDP per capita in Canada will fall for the third consecutive year in 2025. This slide is a troubling break from Canada’s historical pattern of rising living standards. It contrasts with what is happening in other OECD countries, which have overtaken Canada, and contrasts especially strongly with the United States (Figure 1). Declining output per person implies that Canada is becoming a less attractive place for talented people to live and work.
Many influences on GDP per person may not be easily or desirably influenced by policy.
More people participating in the workforce and/or working longer hours will raise output per person, but more work per person has obvious costs. Higher human capital – enhanced skills and more education – and improved technology can raise output per person, but building human capital takes time, and improved technology is not, on its own, something policymakers can directly engineer. Increasing the amount of capital per worker, by contrast, is relatively straightforward to achieve and has positive results that are relatively likely to occur.
High or low levels of business capital, such as non-residential structures, machinery and equipment, and intellectual property products, are strongly associated with higher or lower output per worker. Productivity gains spur investment, and investment in turn boosts productivity. Higher productivity creates opportunities and competitive threats that promote business investment. In turn, higher business investment gives workers newer and better tools, embodies new technologies and gives managers and workers new opportunities to “learn by doing” – all of which raise each worker’s productivity.1
These links between investment and labour productivity make recent figures on Canada’s capital stock and new investment worrying. Canada’s capital stock in the business sector has grown so little since 2015 that capital per member of Canada’s labour force has been falling. Clearly, the recent extraordinary growth in Canada’s labour force, driven by permanent and temporary immigration, has not prompted businesses to provide tools to augment the productivity of the newly available brains and hands.
The spectacle of falling capital per worker forces attention to the fact that capital and labour are not only complementary factors of production – they are also substitutes. Industries and production methods vary in how intensively they use capital relative to labour. In international trade, countries with higher capital per worker tend to specialize in capital-intensive goods and services, while countries with lower capital per worker gravitate toward labour-intensive ones. Since living standards are higher in capital-intensive countries, Canada must confront the risk that low business investment and fast workforce growth are leading Canada down a labour-intensive path.
The United States and other OECD countries are investing at higher rates. Business investment per available Canadian worker was closing in on US and OECD levels from the early 2000s to the middle of the last decade, but the convergence stopped around 2015. Canada’s relative performance then plummeted during the COVID pandemic and has lagged badly since.
Canada’s workers need better tools to thrive and compete. Governments must change policies that are taking Canada’s economy down a more labour intensive, lower-wage path.
The Numbers
Many types of capital enhance productivity and living standards. Our focus in this report is on “reproducible” or “built” capital in the business sector. Human capital and natural capital, such as skills, land and water matter, but they cannot be reliably measured or compared internationally. Capital created and owned by governments also matters, but the services it yields are harder to relate to production and income.
Measures of built capital are relatively robust and easier to compare internationally. Non-residential buildings include offices, warehouses and industrial facilities, as well as engineering structures such as transportation infrastructure. Machinery and equipment (M&E) includes motor vehicles, tools and electronic equipment. Intellectual property (IP) products have three major sub-components (see Box 1). These types of built capital complement other types of capital – human, natural and government – in producing goods and services, generating incomes and helping workers compete internationally.
Labour force measures are also relatively robust and normally easy to compare internationally.2 However, the surge in temporary residents in Canada in recent years has coincided with a growing discrepancy between the number of temporary foreign workers reported by Immigration, Refugees and Citizenship Canada (IRCC) and the number of temporary residents reported in Statistics Canada’s Labour Force Survey (LFS), the most widely used source of data on the workforce and the one relied on by the OECD. Skuterud (2025) shows that IRCC’s count exceeded the LFS figure by 1.3 million in 2024. In translating Statistics Canada’s labour-force count to our measure of available workers, we multiply the labour-force figures since the first quarter of 2022 by the ratio of the populations in Statistics Canada tables 17-10-0009-01 and 14-10-0287-01. This adjustment adds 272,000 more available workers on average to the LFS numbers since the first quarter of 2022.
Notwithstanding variations in the efficiency with which various countries combine labour and business capital to produce output – variations arising from other inputs and influences such as organization of firms, often grouped under the term “multifactor productivity” – countries with high capital stocks tend to enjoy high output. Labour productivity growth and investment interact. Anticipated higher productivity creates opportunities for growth and profit for businesses, as well as threats from innovative competitors and losses. Those opportunities and threats incent investment, which increases the quantity and quality of the capital stock. A larger, newer capital stock raises productivity and workers’ incomes. The correlation between capital stock per member of the labour force (adjusted for undercount in Canada’s case) – for which we use the term “available worker” – and output per available worker across countries is clear (Figure 2).3
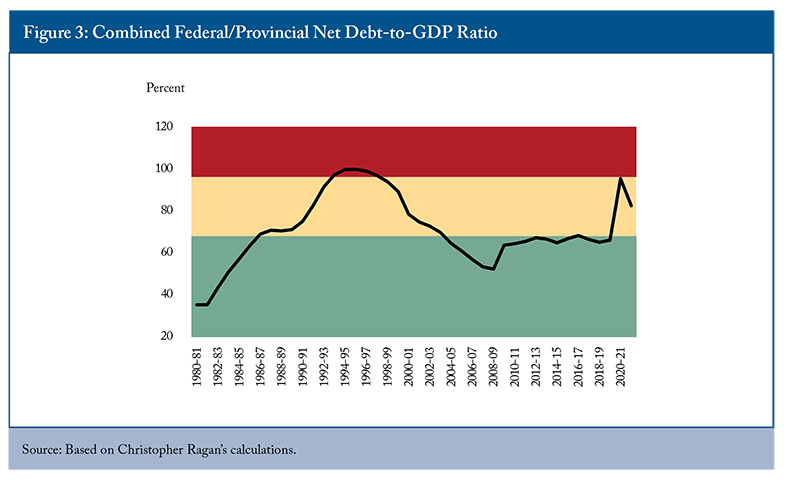
The fact that capital formation is both a result of productivity growth and a driver of it makes recent trends in Canada’s capital stock troubling. Figure 3 shows real stocks of each type of capital per available worker.
Total non-residential capital per available worker in Canada peaked in the last quarter of 2015.4 By the third quarter of 2025, per-worker levels of all types of capital were well below the late 2015 benchmark. IP products per available worker were down 4 percent. Engineering construction was down 6 percent. Non-residential buildings were down 12 percent. M&E was down a dramatic 20 percent. The dismal summary: the latest figures show the average member of Canada’s labour force had 9 percent less capital to work with than in 2015.
Because we do not have comparable time-series of capital stocks for many other countries, we turn to a closely related flow measure – gross business non-residential investment – to set up an international comparison over time. Figure 4 shows the Canadian numbers for the three types of business investment – non-residential structures (buildings and engineering), M&E and IP products – per available worker since 1990.
Absent major changes in estimated depreciation and write-offs, changes in gross investment should closely track changes in net capital stock. From 1990 to 2014, notwithstanding setbacks during the slump of the early 1990s and the 2008-2009 financial crisis and recession, the trend in investment per worker was up. But during the second half of the 2010s, investment in structures and M&E per member of the workforce declined, and investment in IP products flatlined. The economic shutdowns and uncertainty around the COVID-19 pandemic hurt business investment in everything except IP products.
Since then, performance in all three categories has been lacklustre. Adjusted per-available-worker investment in the third quarter of 2025 was only about $15,000 in 2024 dollars – down almost one quarter from its 2014 peak of $19,400.
Predictably, low levels of new investment have coincided with ageing of the capital stock and a decrease in the average remaining productive lives of assets.5 When new investment exceeds depreciation and scrapping, the remaining useful life of assets tends to rise, as it did in most categories before 2015. When new investment falls short of depreciation and scrapping, the remaining useful life of assets declines, as it has since then. In 2024, the remaining useful life ratio of non-residential buildings was 1 percent below its 2015 peak, whereas the ratios for IP and engineering construction were 13 and 7 percent lower than their 2015 benchmarks, respectively. An exception is machinery and equipment, where a shift in spending toward longer-lived assets such as transportation equipment has offset weak gross spending. Overall, the remaining useful life ratio of non-residential capital in 2024 was 4 percent below its 2015 peak. This trend highlights the need for increased investment to maintain Canada’s productive capacity as its capital stock ages and becomes obsolete.
Canada’s Investment Performance in International Perspective
Many factors that affect business investment in Canada also affect other developed countries. Over the long term, the growing importance of intangible assets beyond those measured in IP products, such as organizational efficiency, and services that escape traditional measures of value-added, such as internet search engines, may make lower levels of traditional business investment consistent with rising living standards everywhere. Short-term influences such as the pandemic and trade uncertainty also affect many countries. We can check Canada’s experience against that of the United States and other OECD countries with comparable data (the same countries that appear in Figure 2). Is Canada’s apparent path toward lower capital intensity part of a broader and possibly benign global pattern, or is Canada on a unique path that raises unique concerns?
Canada versus the United States
Canada and the United States collect similar capital investment data, and Statistics Canada takes particular care to compare Canadian to US prices. We can therefore measure investment per available worker in the two countries with some confidence that we are getting meaningful comparisons.
We convert the different types of capital investment into Canadian dollars using Statistics Canada’s measures of relative capital-equipment price levels to adjust for purchasing power differences.6 This approach gives a clearer sense of the “bang per buck” spent on structures, M&E or IP products on either side of the border. The results of these calculations appear in Figure 6, panels A through D.
Canada has a longstanding edge in investment in structures (panel A), reflecting the importance of non-residential buildings and engineering structures in natural resource industries. This gap was particularly wide in 2014, at almost $4,000 per worker, when Canadian investment in natural resources, notably oil and gas production and transmission, was booming. Since then, it has shrunk – to less than $500 in 2024.
The picture for M&E investment (panel B) is markedly different. The United States has always invested more heavily in M&E, and that advantage has grown over the past 15 years. Recently, US M&E investment per available worker has been almost three times higher than in Canada – about $11,000 annually in the US compared to $4,600 in Canada. Given the potentially outsized importance of M&E investment for productivity growth (Sala-i-Martin 2001, Rao et al. 2003, Stewart and Atkinson 2013), this gap bodes poorly for the competitiveness of Canadian workers and for Canada’s attractiveness as a place to live and work.
The IP products gap (panel C) is worse yet. In 2024, the Canadian figure stood at about $3,300, up from about $2,600 in 2014, while the US figure stood at $10,600, up from $7,000 in 2014. Part of this gap reflects slumping exploration expenditures and their associated IP by Canada’s struggling resource sector. In general, Canadian firms tend to use IP products owned abroad more than US firms do, which reflects in part Canada’s relative lack of success in commercializing domestic intellectual property.
Looking at all three categories combined (panel D), the United States has outpaced Canada since the 1990s. The gap narrowed in the 2000s but widened markedly after the mid-2010s and expanded further after the pandemic, reaching $13,300 per potential worker in 2024. That is a chasm. Differences in investment per worker on that scale could represent a significant shortening of the replacement and upgrade cycle for equipment such as trucks, excavators, machine tools, workplace equipment, and the potential replacement of entire information and communications technology systems – meaning US workers benefit from more modern tools and higher productivity.
One way to summarize these differences is to ask how many cents of new investment per available Canadian worker occur for every dollar of new investment per available US worker. Figure 7 presents our measure of investment in Canada per dollar of its US equivalent in total and in each investment category.
Canada’s relatively robust rate of structures investment stands out in Figure 7. The surge in the early 2010s is striking: in 2013, each available Canadian worker was getting $1.63 for every dollar received by a US worker. The subsequent decline is just as striking. By 2024, the average member of the Canadian workforce received $1.05 of new non-residential structures for every dollar received by the average member of the US workforce.
As the comparison in Figure 6 suggests, the contrast is worse for M&E. After improving from just 50 cents around the turn of the century to nearly 70 cents around the time of the 2008-2009 financial crisis and slump, Canada’s relative performance has deteriorated. In 2015, M&E investment for every available Canadian worker per dollar enjoyed by a US worker stood at 47 cents for every US dollar. By 2024, it had dropped to a dismal 41 cents – a number that has fallen further since (Robson and Bafale 2025).
The situation with IP products is worse yet. A declining trend since the mid-2000s has led to the point where the average member of the Canadian workforce in 2024 enjoyed only 32 cents of new investment in IP products for every dollar enjoyed by their US counterpart. The measurement of IP products in the two countries is not identical (Box 1), but focusing on the comparable categories reveals that US investment per worker in software is about double Canadian investment per worker, and that US investment in R&D is about four times Canadian investment.
Canada versus the OECD
Widening the international comparison to other OECD countries offers more perspective on Canada’s situation.7 This broader and more forward-looking view comes with caveats. Not all OECD countries break down business investment by type the same way Canada and the United States do, and some measures, notably IP products, differ across countries. Therefore, we use aggregate investment with less confidence that we are comparing like with like. We also do not have current measures of relative prices for different types of investment. We resort to a less precise “bang-per-buck” adjustment: purchasing-power-adjusted exchange rates benchmarked to relative prices of capital investment goods and services in 2017.
For consistency, we use the same OECD measures for the United States as well, which means that the per-available-worker numbers in Canadian dollars are not identical to those in our Canada-US comparison. But the big picture – notably, the story of Canadian underperformance – is consistent (Figure 8).8
Investment per available worker in the other OECD countries with comparable data has typically been less robust than in the United States but more robust than in Canada. This tendency was less pronounced in the early 2010s, when Canada’s resources sector was booming and many other advanced economies were suffering the lingering effects of the 2008-2009 financial crisis and slump. At that point, the gap between investment per Canadian labour-force member and those in other OECD countries (excluding the United States) narrowed, and the two measures were almost equal in 2014.
Since then, the gap has widened again. The OECD’s projections for 2025 yield a figure of about $19,300 of new capital per available worker this year for the other OECD countries, compared with just $15,800 for Canada. In other words, the OECD’s projections for countries other than Canada and the United States indicate that gross new capital per available worker in Canada will be about 20 percent less than in those countries this year.
Figure 9 highlights this relative performance by showing Canadian investment per worker for each dollar invested elsewhere. The figure shows how much new capital each available worker in Canada enjoyed per dollar of new capital per available worker in the United States, the OECD as a whole and in the other OECD countries since 1991, along with the figures calculated from the OECD’s 2025 projections.
For every dollar of investment received by the average worker across the OECD as a whole, the average Canadian worker enjoyed about 75 cents in the early 2000s. Excluding the United States, Canadian workers enjoyed 79 cents. By 2014, this gap had narrowed: the average Canadian worker was enjoying some 89 cents of new investment for every dollar invested per worker in the OECD overall, and 97 cents relative to workers in other OECD countries. By 2025, however, Canadian workers will likely enjoy only about 70 cents of new capital for every dollar enjoyed by their OECD counterparts. The figure compared to workers in OECD countries other than the US is 82 cents. The figure compared to US workers is a dismal 55 cents.
Canada’s Productivity Performance in International Perspective
Higher investment is not a goal in itself. Subsidies and regulations that spur investment in uneconomic assets could raise capital spending but lower productivity and future incomes.9 Our concern about these numbers is their implication that Canadian businesses either do not see opportunities and competitive threats that would prompt them to undertake productivity-improving capital projects, or that when they see such opportunities and threats they respond slowly or incompletely. To that extent, these numbers presage trouble for Canadian workers.
As the relationship in Figure 2 illustrates, and as previous research such as Rao et al. (2003) has noted, countries with higher capital intensity tend to have higher productivity and higher wages. Likewise, countries with lower capital intensity tend to lag on both fronts. Unless human capital per worker is rising and/or multifactor productivity is rising fast enough to offset it, falling built-capital per worker means less output generated per hour worked.
In the 1990s, the US economy produced $27,000 more per available worker than Canada, and the gap has widened since. In the 2000s and 2010s, Canadian output per available worker averaged $128,000 and $136,000, respectively, compared with $164,000 and $184,000 in the United States. By 2024, Canada generated $143,000 per available worker, compared to almost $200,000 in the United States (Figure 10).
Canada generated more output per worker than in other OECD countries in the 1990s, but that advantage has disappeared. Specifically, in the 1990s, Canadian workers produced $3,000 more per worker than their counterparts in other OECD countries. By 2024, notwithstanding a productivity decline post-COVID, workers in other OECD countries were generating $10,000 more per worker than those in Canada.
As with investment per available worker, we can highlight Canada’s relative performance by showing Canadian output per available worker for each dollar of output generated per available worker elsewhere (Figure 11).
In the 1990s, Canadian workers produced 80 cents for every dollar of output generated by US workers. By the 2010s, the ratio was around 74 cents, and by 2024, it had fallen further to 72 cents. In the 1990s, Canada generated $1.03 per worker for every dollar generated per worker in other OECD countries. By 2024, this figure had dropped to 93 cents.
Diagnoses and Possible Responses
What lies behind these ominous numbers and how might Canadian governments respond? Causation flows both ways between labour productivity and investment, but an investigation can usefully start by asking why Canadian businesses may not respond to opportunities and threats as much as they did previously or compared to businesses in other countries. We explore that question in the next subsection, and then ask why Canadian businesses might see fewer opportunities and threats than before and fewer than those in other developed countries.10
Why Might Canadian Businesses Respond Less to Opportunities and Threats?
Do Canadian businesses have some structural predisposition against innovation, entrepreneurship, investment and productivity growth? Porter (2023) provides a list of commonly blamed factors, including low population density, a cold climate, reliance on resource-sector revenues, weak private-sector research and development efforts and interprovincial barriers. As Porter points out, however, other countries with similar characteristics are outperforming Canada. Moreover, factors that have remained unchanged for decades cannot fully explain Canada’s poor performance since the mid-2010s, unless their impact has intensified. What, then, might have changed?
One possible factor is Canada’s bias toward residential construction.11
The federal government backs mortgage lending through Canada Mortgage and Housing Corporation (CMHC) insurance, likely leading lenders to favour residential over non-residential investments (Omran and Kronick 2019). Although mortgage lending has exceeded business lending in Canada since the mid-1980s, a tougher environment for non-residential investment and higher immigration since the mid-2010s may have made residential investment even more attractive. While imports can augment the resources available for capital investment in a given year, domestic output over time limits the total amounts available for consumption and investment of all kinds. As a result, a growing share of residential investment in GDP could limit the responsiveness of non-residential investment to opportunities and threats.
Another clearly negative influence has been the hostile regulatory environment for Canada’s fossil fuel industry since 2015.12
While global investment in oil and natural gas dropped when prices weakened in 2014, the subsequent recovery spurred a much stronger response in the United States than in Canada. Oil and gas investment per worker in Canada has fallen relative to the US, indicating a muted response to strong demand and high prices on the Canadian side of the border. A hint about the importance of the regulatory environment in the Canadian data is the relatively robust performance of investment in conventional oil production in Canada, which has followed a path more similar to that of the US industry. In contrast, investment in oil sands projects, which involve larger commitments of capital for longer periods, has been more subdued.
Porter’s list of suspects also includes the small scale of many Canadian businesses. The widening gaps between the effective tax rate on small businesses and both the general corporate income tax rate and personal income tax rates, combined with generally low interest rates, might have dulled business response to incentives that could have otherwise spurred investment and growth. The wider the gap between the small business tax rate and other rates, the stronger the incentive to keep earnings and assets below the thresholds at which the small business rate phases out, increasing marginal tax rates over that range. This creates distortions (OECD 2025a) and a “lock-in’’ effect, where businesses are incentivized to reinvest earnings within even mediocre firms rather than taking them as personal income. This incentive varies with the return on assets: the lower the rate of return, the larger the marginal effective rate on earnings in the clawback zone.
Dachis and Lester (2015) argue that providing preferential tax treatment to small businesses steers capital from larger, more productive firms to smaller, less productive ones. Since 2009, the gap between effective small business tax rates and ordinary corporate and higher-income personal tax rates has widened, and is wider in Canada than in other G7 countries. Against a backdrop of generally lower returns on assets, this widening gap might help explain relatively lower business investment in Canada in recent years.
The US tax reforms of 2017 likely lowered investment in Canada and certainly did so relative to the United States. Prior to 2017, Canada had improved its tax treatment of investment relative to the United States, with reforms from the late 1980s to the early 2010s reducing the federal general corporate income tax rate from nearly 38 percent to 15 percent and reducing the aggregate marginal effective tax rate on investment in Canada (Chen and Mintz 2015, Bazel and Mintz 2021). These steps strengthened Canada’s investment performance and capital stock (Wen and Yilmaz 2020). As noted already, Canada’s investment performance relative to the US and other OECD countries did improve from the early 1990s until 2014, when the slump documented in this report began.
Those 2017 US reforms, notably the reduction of the federal corporate income tax rate from 35 to 21 percent and faster write-offs for M&E, undid Canada’s business tax advantage (Bazel and Mintz 2021, McKenzie and Smart 2019). As intended, the US reforms lowered the marginal effective tax rate on business investment. Bazel and Mintz (2021) calculate the average US federal and state effective marginal rate at less than 26 percent in 2019, down from nearly 40 percent in 2000. By contrast, the average Canadian federal and provincial/territorial rate was above 26 percent, down much less from nearly 30 percent in 2000.
Chodorow-Reich et al. (2023) compare investment by US-based companies to investment by similar companies abroad, including those in Canada, around the time of the reforms and find a stronger investment performance among the US group, post-reforms. Crawford and Markarian (2024) similarly show that the reforms reversed Canada’s previous tax advantage. They find that US companies significantly increased their capital spending compared to Canadian firms after the reforms.
The US tax reforms also aimed to encourage US-based multinationals to repatriate profits held abroad. Although success in that respect would likely depress capital formation in Canada (Mathur and Kallen 2017, McKenzie and Smart 2019), that result is not guaranteed. Foreign investments can complement domestic investments, and the immediate post-reform US global intangible low-tax income (GILTI) regime applied only to foreign income above 10 percent of foreign tangible capital, which created an offsetting incentive for businesses to invest abroad. However, matched-firm analyses by Chodorow-Reich et al. (2023) found weaker investment among Canadian firms than among US firms following the reforms, and Crawford and Markarian (2024) conclude that the surge in US investment was driven primarily by domestic activity.
A notable trend since 2017 is the decline in Canadian M&E investment per worker relative to the United States, despite Canada responding to the US reforms by introducing accelerated depreciation on almost all capital assets in 2018. This suggests that some of the robust US domestic investment might have come at Canada’s expense or that other factors made Canadian companies’ investment weaker than that of their US counterparts.
The GILTI regime also addressed previous incentives for US multinationals to hold and commercialize IP products abroad (Singh and Mathur 2019). Since the 2017 reforms, Canada’s performance in IP investment relative to the US has been worse than its performance in other asset types. The GILTI rules imposed such a significant tax burden that many IP investments yielded higher after-tax returns in the US than overseas. This reduced the tax advantage of locating intangible assets outside the US. While this does not prove causation, it strongly suggests that the US reforms have played a significant role.13
Why Might Canadian Businesses See Fewer Opportunities and Threats?
A regular critique of Canadian business, also noted by Porter (2023), is a lack of entrepreneurial drive and risk tolerance. These traits may have become more problematic with the rise of information and communication technology, which rewards countries with stronger human capital in these areas. This could explain Canada’s recent poorer showing against the United States.
Another reason for Canadian businesses revising their investment-spurring expectations down, at least relative to US firms, is increased population growth since the mid-2010s.14 This surge reflects higher immigration, shifted toward students and temporary foreign workers, and lower economic stream thresholds. This may have led businesses to favour labour substitution over capital investment (Doyle et al. 2024).
The rising share of government consumption may also mean fewer opportunities for Canadian businesses.15 Government consumption – spending on public employees and other resources – draws directly on the same resources as the private sector. It is expected to rise during downturns, such as the early 1990s, the 2008 financial crisis, the 2014 oil-price collapse, and the pandemic, while business investment – which is strongly affected by economic cycles – falls. But if government consumption remains elevated as the economy strengthens, it can crowd out private spending, including business investment. Canada’s post-pandemic experience is concerning because government consumption has continued to rise while business investment has struggled (Figure 12). Although recent slack in the Canadian economy might appear to reduce the potential for government consumption to crowd out other uses of resources, the sluggish growth in productive capacity prefigured by current feeble investment suggests that competition for resources by government will remain a problem if governments do not reduce their claims on the economy.
Another factor behind Canada’s lower investment rates is US protectionism. Donald Trump’s recent trade policies are exacerbating a problem with many roots. Secure access to the US market has long been a goal of Canadian trade policy, ensuring that Canada remains an attractive production base. Even before Donald Trump’s 2017 inauguration, the 2016 campaign featured anti-NAFTA rhetoric from both parties, potentially discouraging Canadian investment. The 2024 campaign prefigured more protectionism, which hammered Canada’s exports of goods to the United States after his inauguration, down 22 percent between January and August 2025.
Domestic policy uncertainty may also have reduced business dynamism, slowing productivity growth and blunting competition that spurs investment. Key sectors – such as energy, plastics, financial services and telecommunications – have faced restrictive regulations, reducing innovation, competition and investment across the economy. Cette et al. (2025) provide evidence that phasing out restrictive regulations in these key upstream sectors could significantly boost productivity and investment.
The OECD’s Product Market Regulation (PRM) project quantifies regulatory burdens by comparing national regulations to international best practices (OECD 2024). The latest PRM data compare 2023 to 2018. In 2018, Canada scored 1.43, slightly better than the OECD average of 1.46 (lower scores indicate less distortion), but worse than the 0.8 average of top performers. By 2023, Canada improved to 1.38, yet lagged behind the OECD average (1.30) and top performers (0.67). Problem areas include licensing, foreign direct investment barriers, public procurement, and governance of state-owned enterprises (OECD 2024).
Furthermore, indexes of policy uncertainty rose far more in Canada after 2014 than in the United States, Europe and even globally (Figure 13).16 While trade tensions have boosted the Canadian index, other policies that undermine business confidence are more directly under the control of Canadian policymakers. Eliminating internal trade barriers and phasing out supply management in dairy, eggs and poultry would reduce these distortions, lowering prices for consumers and costs for businesses that use the affected products as inputs.
What tax-related influences might account for slower productivity growth in Canada and the reduced perception by Canadian businesses of investment opportunities and threats?
One influence is the increased distortion from varying marginal effective tax rates across industries and capital types. Bazel and Mintz (2021) find inter-industry and inter-asset dispersion in marginal effective tax rates more than doubled from 2016 to 2020. Manufacturing investments faced a 13.7 percent average rate – negative in Atlantic Canada due to tax credits – while communications investments faced an average rate of 22.1. Such disparities reduce overall capital productivity.
Labour mobility and personal income tax salience have grown. Post-pandemic remote work enabled more Canadians to work abroad, and emigration data – though incomplete and affected by a methodology change17 – show increased churn since 2015.18 Remote work may have increased opportunities for higher-earning Canadians to work abroad.19 The associated loss of high-skilled workers may reduce incentives for domestic capital investment.
Populist tax policies further undermine investment confidence. The “Canada Recovery Dividend,” imposed on the largest banks and insurers post-COVID, and higher corporate tax rates on large financial institutions introduced in the 2022 budget, lacked economic rationale (Kronick and Robson 2023). The 2021 luxury tax was based on a similar logic (Halpern-Shavin and Balkos 2023). The abortive move to increase capital gains tax rates in 2024 badly shook entrepreneurial confidence. Like policy uncertainty, perceptions of capricious tax policy reduce the dynamism that could otherwise spur consumer-friendly investment.
Potential Responses
The list of likely negative influences on investment in Canada that may have worsened since 2014 is long, and the list of potential policy responses is nearly as long. Some issues are easier to address in the short run than others.20
The bias toward residential construction is difficult to tackle. Slowing the inflow of permanent and temporary immigrants, whose rapid growth has intensified housing market pressure, would reduce the draw of residential investment on resources otherwise available for non-residential capital investment and lessen any disincentive created by abundant low-skilled labour (Doyle et al. 2024). But the government’s announcements have so far not moved the actual numbers much (C.D. Howe Institute 2025).
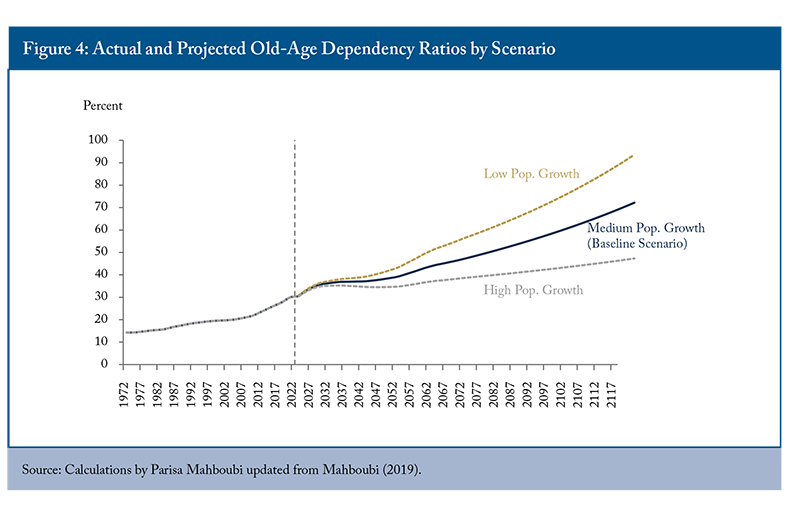
Current plans to cut business immigration and shift away from human-capital-based selection toward filling in-demand occupations risk undermining Canada’s ability to attract high-skill workers (Mahboubi 2025). Prioritizing lower-skill positions does little to encourage the high-skilled labour that complements business investment.
By contrast, the hostile regulatory environment for Canada’s fossil fuel industry is easier to fix. The case for Canada to suppress its fossil fuel production to lead global emissions reduction has never been convincing. Global energy demand continues rising, fossil fuels supply most of the world’s energy, and Canadian fossil fuels are economically, strategically and environmentally preferable to most others. The federal government’s recent announcements about easing impediments to expanded production and exports are promising; if followed by action, they could boost capital investment measurably in the years to come.
The materialization of US protectionism demands a proactive and strategic defence of Canada’s trade interests, mirroring the diplomatic intensity seen during the 1988 Canada-US Free Trade Agreement and the evolution of NAFTA into the Canada-US-Mexico Agreement (CUSMA). As the 2026 CUSMA review approaches, Ottawa must calibrate trade concessions and complementary initiatives – such as boosting Canadian defence capabilities – and reinforce the mutual benefits of North American economic integration to US businesses, consumers and policymakers. Canada must also reduce its trade exposure to the US by diversifying trade via agreements with the UK and the Association of Southeast Asian Nations (ASEAN), accelerating high-impact energy and mineral projects, investing in trade infrastructure, and working with provinces to lower internal trade and labour mobility barriers.
Reducing policy uncertainty requires clearer processes and criteria. Businesses need stable rules and predictable outcomes. The federal government needs more rigorous ex post evaluations of regulations (OECD 2025b). At present, it often misses critical insights from the real-world evidence on whether rules work as intended. The federal government’s recent initiatives to accelerate approvals for major projects may help, and a national infrastructure plan sounds good, but specific initiatives such as privatizing federal airports are too few and far off to make a difference.
Addressing the bevy of negative tax-related distortions is required. These include the gap between effective tax rates on small and large businesses; the lower effective tax rate on investment in the post-2017 United States; uneven tax rates across regions, sectors and assets (exacerbated by the November 2025 budget’s faster write-offs for selected machinery and processing equipment only); and Canada’s high personal income tax rates all point to the need for comprehensive, long-overdue tax reform. Options include adopting an allowance for corporate equity (Milligan 2014; Boadway and Tremblay 2016), shifting to a cash-flow tax base (McKenzie and Smart 2019) or taxing only distributed profits (Mintz 2022) could foster more investment and higher productivity. To stimulate innovation, Scientific Research and Experimental Development (SR&ED) incentives should better support large firms, link post-secondary research funding to commercialization plans and reorient the Industrial Research Assistance Program (IRAP) toward commercialization (Lester 2025). Eliminating capital gains tax on Canadian small and medium-sized enterprise (SME) shares would incentivize domestic scale-up. A review of small business supports is also needed to ensure they do not entrench low-productivity firms.
Near-term reforms may need to be less ambitious. Consensus on Canada’s tax system flaws and solutions is weaker than in the United States before its 2017 reforms.21 Major tax reforms are easier when they reduce revenue, but most senior governments in Canada are wary of forgoing revenue at that scale. The most promising near-term responses may be simple reductions in the most distorting tax rates – a lower general corporate income tax rate and lower top personal rates.
Though politically challenging, such cuts are easy to legislate, and evidence suggests the relevant tax bases are elastic enough to limit revenue loss.22 Lower top rates do not fix all tax system flaws that blunt business responses to opportunities, but they are uniquely broad in reducing distortions that suppress investment and productivity.
Another near-term option to jolt Canada out of a low-investment, low-productivity trap is a temporary general investment tax credit. Though more complex to legislate and administer than a tax rate cut, a general investment tax credit (ITC) is a familiar tool with predictable effects. Ideally, it would replace the Atlantic Investment Tax Credit and pre-empt other sector-specific ITCs like the Clean Technology Manufacturing Investment Tax Credit. However, a meaningful general credit – say 5 percent – would entail major short-run revenue costs.
Applying a lower tax rate to business income from IP products would directly address Canada’s lagging performance in this sector. The term “patent boxes” is too narrow: applying the lower rate to income from IP embedded in other goods and services would better incentivize broader IP investment and align with emerging international norms than a lower rate on income from patents alone. The federal government could offset near-term revenue costs by reducing R&D subsidies for small firms, which likely promote too much low-quality, non-commercializable work (Lester 2022).
Beyond changing the tone of tax policy, the federal government must change its fiscal stance. It should rein in regular program spending and subsidies delivered through the tax system, which are disguised spending that raise borrowing costs and interest payments. Even after pandemic-related measures wound down, projections in successive fall economic statements and the November 2025 budget have shown projected federal spending rising sharply (Robson 2025).
Call to Action
Ongoing economic uncertainty continues to plague Canadian firms, which, according to the Bank of Canada’s latest Business Outlook Survey, report weak investment intentions and limited expansion plans (Bank of Canada 2025). This backdrop increases the urgency for policy changes that can reverse Canada’s unprecedented, prolonged decline in capital per worker.
The risk that Canadian workers will become increasingly concentrated in lower-value activities relative to their US and international peers should prompt Canadian policymakers to take action. Canada’s persistently weak business investment, relative to its historical performance and that of OECD economies, threatens long-term prosperity and competitiveness.
It is encouraging that Canada’s low productivity and chronic underinvestment have recently gained more prominence in public discourse. Awareness is a critical first step. Addressing the challenge requires decisive action, however: more effective tax and regulatory policies, and a fundamental reorientation of economic policy toward sustained, long-term growth.
The authors extend gratitude to Don Drummond, Alexandre Laurin, John Lester, Nick Pantaleo, Daniel Schwanen, Trevor Tombe and several anonymous referees for valuable comments and suggestions. The authors retain responsibility for any errors and the views expressed.
REFERENCES
Allen Rupert, Wulong Gu and Ryan Macdonald. 2025. “Data, Intangible Capital and Economic Growth in Canada.” Statistics Canada Catalogue 11F0019M, No. 482. March 13.
Bafale, Mawakina, and William B.P. Robson. 2022. “Canadian Investment in Intellectual Property Products is Too Low.” Intelligence Memo. Toronto: C.D. Howe Institute. May.
Baker, Scott R., Nicholas Bloom, and Steven J. Davis. 2016. “Measuring Economic Policy Uncertainty.” Quarterly Journal of Economics 131(4): 1593-1636.
Bank of Canada. 2025. “Business Outlook Survey – Third Quarter of 2025.” October.
Bazel, Philip, and Jack Mintz. 2021. “2020 Tax Competitiveness Report: Canada’s Investment Challenge.” SPP Research Papers 14(21). University of Calgary.
Boadway, Robin, and Jean-Francois Tremblay. 2016. Modernizing Business Taxation. Commentary 452. Toronto: C.D. Howe Institute. June.
Caselli, Francesco, and James Feyrer. 2007. “The Marginal Product of Capital.” The Quarterly Journal of Economics 122(2): 535-568.
Casi, Elisa, Mohammed Mardan, and Barbara M.B. Stage. 2023. Citizenship/Residence by Investment and Digital Nomad Visas: The Golden Era of Individual Tax Evasion and Avoidance? NHH Department of Business and Management Science Discussion Paper 2023/12. Bergen: Norwegian School of Economics, Department of Business and Management Science. August.
Cette, Gilbert, Jimmy Lopez, Giuseppe Nicoletti, and Oceane Vernerey. 2025. “The Potential Impact of Pro-competitive Regulatory Reforms on Productivity and Growth in Canada.” International Productivity Monitor, No. 49, Fall 2025.
Chen, Duanjie, and Jack M. Mintz. 2015. “The 2014 Global Tax Competitiveness Report: A Proposed Business Tax Reform Agenda.” SPP Research Papers 8(4). University of Calgary.
Chodorow-Reich, Gabriel, Matthew Smith, Owen Zidar, and Eric Zwick. 2023. “Tax Policy and Investment in a Global Economy.” Working Paper no. 2023-141. Becker Friedman Institute for Research in Economics, University of Chicago. November.
Crawford, Steven, and Garen Markarian. 2024. “The Effects of the Tax Cuts and Jobs Act of 2017 on Corporate Investment.” Journal of Corporate Finance 87. August.
Cross, Philip, and Jack Mintz. 2024. “Canada’s Resource Sector: Protecting the Golden Goose.” Ottawa: Macdonald Laurier Institute.
Dachis, Benjamin, and John Lester. 2015. Small Business Preferences as a Barrier to Growth: Not So Tall After All. Commentary 426. Toronto: C.D. Howe Institute.
Doyle, Matthew, Mikal Skuterud, and Christopher Worswick. 2024. Optimizing Immigration for Economic Growth. Commentary 662. Toronto: C.D. Howe Institute.
Grootendorst, Paul, Javad Moradpour, Michael Schunk, and Robert Van Exan. 2022. Home Remedies: How Should Canada Acquire Vaccines for the Next Pandemic? Commentary 622. Toronto: C.D. Howe Institute. May.
Gu, Wulong. 2024. “Investment Slowdown in Canada After the Mid-2000s: The Role of Competition and Intangibles.” Analytical Studies Branch Research Paper Series, Statistics Canada. February 22.
Halpern-Shavim, Zvi, and Elena Balkos. 2023. “Evaluating Canada’s New Federal Luxury Tax.” Perspectives on Tax Law and Policy 4(1).
Kronick, Jeremy M., and William B.P. Robson. 2023. “Special Taxes on Large Canadian Banks and Life Insurers: How Necessary? How Evil?” Perspectives on Tax Law and Policy 4(1).
Laurin, Alexandre. 2018. “Unhappy Returns: A Preliminary Estimate of Taxpayer Responsiveness to the 2016 Top Tax Rate Hike.” E-Brief. Toronto: C.D. Howe Institute.
Lester, John. 2022. “Tax Support for R&D and Intellectual Property: Time for Some Bold Moves.” E-Brief. Toronto: C.D. Howe Institute, July.
_________. 2025. “An Economic Strategy for Canada’s Next Government.” Special Policy Report. Toronto: C.D. Howe Institute, April.
_________. 2024 “Federal Business Subsidies: Explosive Growth Since 2014.” SPP Research Papers 17(1). University of Calgary.
Mahboubi, Parisa. 2025. “Liberal immigration plan needs more clarity”. Intelligence Memo. Toronto: C.D. Howe Institute. November.
Marion, Stéfane, and Alexandra Ducharme. 2024. “Canada is caught in a population trap.” National Bank of Canada. January 15.
Marple, James. 2021. “Meeting Canada’s Innovation Challenge through Targeted Investment and Competition.” TD Economics. July.
Mathur, Aparna, and Cody Kallen. 2017. “Business Tax Reform, Investment and GDP: Potential Impacts of the Tax Cuts and Jobs Act.” Daily Tax Report 1-7. American Enterprise Institute. December.
McCormack, Carter, and Weimin Wang. 2024. “Canada’s gross domestic product per capita: Perspectives on the return to trend.” Statistics Canada. April 24.
McKenzie, Kenneth J., and Michael Smart. 2019. Tax Policy Next to the Elephant: Business Tax Reform in the Wake of the US Tax Cuts and Jobs Act. Commentary 537. Toronto: C.D. Howe Institute. March.
Milligan, Kevin. 2014. Tax Policy for a New Era: Promoting Economic Growth and Fairness. Benefactors Lecture 2014. Toronto: C.D. Howe Institute and Chartered Professional Accountants Canada.
Mintz, Jack M., and V. Balaji Venkatachalam. 2020. “Adjusting to Reality: As Proposed, Restricting Corporate Interest Deductibility Is Ill-Advised.” E-Brief. Toronto: C.D. Howe Institute. April.
Mintz, Jack M. 2022. “A Proposal for a ‘Big Bang’ Corporate Tax Reform.” SPP Research Papers. University of Calgary.
Omran, Farah, and Jeremy Kronick. 2019. “The Productivity Opportunity in Canada’s Financial Sector.” Intelligence Memo. Toronto: C.D. Howe Institute. November 21.
Organisation for Economic Co-operation and Development. 2009. Measuring Capital – OECD Manual 2009: Second edition. Paris: OECD Publishing. https://doi.org/10.1787/9789264068476-en.
Porter, Douglas. 2023. “Canada’s Perennial Productivity Puzzle.” Focus: A Weekly Financial Digest. Bank of Montreal. November 3.
_________. 2024. “Canadian Growth: Time for a Rethink.” BMO Economics. March 8.
Rao, Someshwar, Jianmin Tang, and Weimin Wang. 2003. “Canada’s Recent Productivity Record and Capital Accumulation.” Industry Canada.
Raymunt, Monica. 2023. “VW lays off workers at key EV factory over cratering demand.” The Financial Post. September 14.
Robson, William B.P., and Mawakina Bafale. 2022. Decapitalization: Weak Business Investment Threatens Canadian Prosperity. Commentary 625. Toronto: C.D. Howe Institute. August.
_________. 2025. “We Need to Get Going on Canada’s Four-Alarm Productivity Emergency.” Intelligence Memo. Toronto: C.D. Howe Institute. October.
Robson, William B.P. 2024. “Weak Canadian Investment and Productivity: How Tax Policy Can Help.” Canadian Tax Journal.
_________. 2025. “Fiscal Fantasies: Four Incredible Projections in the November 2025 Federal Budget.” C.D. Howe Institute Verbatim. November 13.
Robson, William B.P., Don Drummond, and Alexandre Laurin. 2023. The Morning After: A Post-Binge Federal Shadow Budget for 2023. Commentary 638. Toronto: C.D. Howe Institute. February.
Sala-i-Martin, Xavier. 1997. “I Just Ran Four Million Regressions.” National Bureau of Economic Research. Working Paper 6252.
_________. 2001. “15 Years of New Growth Economics: What Have We Learnt?” Speech, Fifth Annual Conference of the Central Bank of Chile. November.
Schwanen, Daniel. 2018. “NAFTA: The Case for More Competition in the Dairy Market.” Intelligence Memo. Toronto: C.D. Howe Institute. September.
Sharpe, Andrew, and Tim Sargent. 2023. “The Canadian Productivity Landscape – An Overview.” Canadian Tax Journal 71(4).
Singh, Kartikeya, and Aparna Mathur. 2019. “The Impact of GILTI and FDII on the Investment Location Choice of U.S. Multinationals.” Columbia Journal of Tax Law 10(2). September.
Skuterud, Mikal. 2025. “The Growing Data Gap on Canada’s Temporary Resident Workforce.” E-Brief. Toronto: C.D. Howe Institute. February.
Stewart, Luke A., and Robert D. Atkinson. 2013. “Restoring America’s Lagging Investment in Capital Goods.” The Information Technology & Innovation Foundation. October.
Trebilcock, Michael. 2017. “Ontario’s Green Energy Experience: Sobering Lessons for Sustainable Climate Change Policies.” E-Brief. Toronto: C.D. Howe Institute.
Wen, Jean-Francois, and Fatih Yilmaz. 2020. “Tax Elasticity Estimates for Capital Stocks in Canada.” IMF Working Paper WP/20/77.
The views expressed here are those of the authors and are not attributable to their respective organizations. The C.D. Howe Institute does not take corporate positions on policy matters.
Canada’s fertility rate has just hit a record low.
In case you missed it- the world is quietly entering a population crisis. Global fertility rates have plunged to their lowest level in 60 years, raising profound questions about how societies will sustain themselves in the decades ahead. In Canada, births have fallen to just 1.25 children per woman, the lowest in our history. Behind the numbers are shifting values, economic pressures, and growing uncertainty about the future. This week, let’s examine the global decline in birth rates and explore what’s driving it—and what it means for the economy, family, and national identity.
An Impending Population Crisis? World Fertility Rate Hits 60-Year Low For the Silo, By Sylvia Xu / Epoch Times.
Fertility rates have plummeted worldwide over the past six decades, leading experts to warn of dire consequences as the downward trend continues. Continued low fertility rates will cause “a gradual implosion of the world’s economy as the population ages and dies,” Steven Mosher, president of the Population Research Institute. Mosher is an expert on population control, demography, and China.” This will not occur overnight, of course, but once it is well underway, it will be difficult, if not impossible, to reverse course,” he said. The fertility rate is the average number of children born to a woman in her lifetime; the birth rate is the number of live births per 1,000 people in a population over a given period. Macroeconomist Jesús Fernández-Villaverde called low fertility rates “the true economic challenge of our time” in a February report for the American Enterprise Institute. In 1960, the fertility rate was between four and five. By 2023, that number had halved to 2.2, approaching 2.1, the level at which a population replaces itself from one generation to the next.In July, the U.S. Census Bureau projected that the world’s population will reach 8.1 billion this year. Experts say that although the figure has grown from 3 billion in 1960, the number to watch is the pace of population growth.” The rate of growth peaked decades ago in the 1960s and has been declining since and is projected to continue declining,” the Census Bureau stated. Fernández-Villaverde warned that although the sagging rate of growth may not have immediate consequences, in less than 50 years, declining fertility will affect the world economy. Countries with low or negative birth rates will contend with a shrinking workforce and the ballooning costs associated with an aging population. Global Fertility Rates Only about 4 percent of the world’s population is in countries with high fertility rates—more than five children per woman—and all of those nations are in Africa, according to the Census Bureau. Even in those countries, fertility rates are generally lower than they once were. The Census Bureau reported that nearly three-quarters of the world’s population is in countries where fertility rates are at or below the replacement level. The fertility rate in India, the world’s most populous country, has steadily declined over the past six decades. In June, the U.N. Population Fund reported that India’s fertility rate stood at 1.9 children per woman, down from five or six children in 1960. In Canada, fertility rate fell to 1.25, well below the replacement level of approximately 2.1 children per woman needed to maintain a stable population. In 1990, China’s fertility rate was 2.51, despite its one-child policy. By 2023, it had dropped to less than one birth per woman, according to the U.N.’s population division.In the United States, fertility has undergone a persistent decline. It fell below the replacement level in 1972, and in 2023, it reached 1.62—a historic low.Asian and European countries have the lowest fertility rates in the world, and South Korea (0.72), Singapore (0.97), Ukraine (0.977), and China (0.999) all have rates below one. (Read More →)
November, 2025 – The federal Canadian government is expected to unveil proposed changes to its electric vehicle sales mandate this winter. The upcoming announcement comes as Canada’s 2026 Zero Emissions Vehicle (ZEV) mandate – requiring 20 percent of new light-vehicle sales to be electric – faces mounting evidence it was unlikely ever to be met, according to a new report by the C.D. Howe Institute.
In “Mandating the Impossible? Assessing Canada’s Electric Vehicle Mandate for 2026 and Beyond,” Brian Livingston, at the C.D. Howe Institute, finds that the policy’s trajectory remains unrealistic beyond 2026. “Even if incentives return, the targets far exceed what consumers are willing or able to buy,” says Livingston. “Mandates alone won’t generate the demand or the vehicles needed to meet these goals.”
The analysis shows that under the 2026 requirement, automakers collectively would have had to spend hundreds of millions of dollars to comply. Companies falling short of their targets could face over $200 million in penalties to generate “Charging Fund Credits,” along with unknown additional costs to purchase “Excess Credits” from firms such as Tesla and Hyundai. To meet compliance thresholds, manufacturers might have been forced to restrict non-ZEV sales, reducing total vehicle supply by more than 400,000 units – leaving significant consumer demand unmet.
Meanwhile, companies exceeding the 20 percent target – primarily foreign-based automakers – would benefit from windfall revenues by selling excess credits. Canadian-based producers such as GM, Ford, Toyota, Stellantis, and Honda, which manufacture domestically, would bear higher costs and face reduced competitiveness.
Federal officials recently noted that the government’s highly anticipated review of the ZEV mandate – launched after Prime Minister Mark Carney paused the 2026 target in September – will report back this winter and unveil proposed changes to targets and credit rules.
Livingston recommends that Ottawa either abandon or substantially revise the ZEV mandate. Options include revising percentage targets to align with market realities, counting increasingly popular hybrid vehicles toward compliance, redirecting credit proceeds to the federal government, or suspending the mandate until trade negotiations with the United States and China clarify the future of Canada’s auto sector.
“The waiver of the 2026 target is only a first step,” Livingston cautions. “Unless the policy is recalibrated to reflect consumer demand and production capacity, Canada’s ZEV mandate risks driving up costs, shrinking supply, and undermining competitiveness – without delivering meaningful emissions reductions.”
From electro-chromatic e-windows to using supernova explosions to explore the earth for mineral deposits: World Economic Forum 2025 Technology Pioneers Leading New Wave of Global Innovation
The World Economic Forum selects 100 start-ups from 28 countries to join its Technology Pioneers community.
The new cohort marks a global surge of emerging technologies, from smart robotics and spatial AI to flying taxis and scalable quantum solutions.
Now in its 25th year, the community has recognized over 1,200 start-ups that have gone on to transform industries and societies worldwide.
For more information on the Annual Meeting of the New Champions 2025, visit wef.ch/amnc25 and share on social media using the hashtag #amnc25, or #2025夏季达沃斯#. Read more about the 2025 Technology Pioneers here.
Geneva, Switzerland, 2025 – The World Economic Forum 2025 Technology Pioneers community is a group of 100 early-stage companies from 28 countries driving innovation across industries and borders. Now in its 25th year, the program celebrates its strongest cohort yet, marked by broader geographical representation, greater diversity beyond Silicon Valley and the rise of more ambitious frontier technologies.
Reflecting wider shifts in the innovation landscape, many of the companies spotlighted are using artificial intelligence (AI) to reach greater scale and sophistication with fewer resources. Several are venturing into less explored frontiers – from asteroid mining and flying electric taxis, to leveraging satellite imagery to transform agriculture and harnessing energy from supernova explosions to locate critical minerals beneath the Earth’s surface.
The geography of innovation is also evolving.
While the United States remains the top contributor to the community, Europe’s share has surged to 28% – up from 20% last year – reflecting the rise of strong tech ecosystems across the region. China and India are also emerging as major tech innovation hubs.
“There has never been a more exciting time to dive headfirst into tech innovation. But no one gets far alone – you need a community to move your mission forward,” said Verena Kuhn, Head of Innovator Communities, World Economic Forum. “As we mark 25 years of the Technology Pioneers programme, this global community continues to connect start-ups to the networks and ecosystems they need to scale.”
This year also marks the 25th Anniversary of the Technology Pioneers programme. Since its inception in 2000, the community has championed early-stage innovation and recognized more than 1,200 companies, many of which have gone on to reshape industries worldwide. Alumni include household names such as Google, PayPal, Dropbox and SoundCloud, underscoring the community’s role as a launchpad for ideas and impact.
The 2025 cohort stands out for its concentration of companies developing breakthrough technologies to address pressing global challenges. These include advanced robotics, customisable space launch services, micro nuclear reactors and more accessible quantum computing applications. These pioneers will contribute cutting-edge insights to Forum initiatives over a two-year engagement program and will also be invited to participate in the Annual Meeting of the New Champions 2025, taking place on 24-26 June in Tianjin, People’s Republic of China.
The 2025 Technology Pioneers include:
Australia • Cauldron – Commercializing advanced continuous fermentation technology to unlock price parity for mainstream bio-manufactured goods.
Brazil • Brain4care – Using AI-based technology to enable timely medical interventions for patients with neurological conditions.
Canada
• Ideon Technologies – Harnessing the energy from supernova explosions in space to image deep beneath the Earth’s surface, transforming how mining companies recover critical minerals. • Miru – Developing dynamic electrochromic windows that deliver high functionality, experience and energy efficiency for the automotive, transportation and architectural sectors.
Greater China • Deep Principle – Integrating advanced AI models and quantum chemistry to accelerate the discovery and development of chemical materials. • GS Biomats – Developing furan bio-based material, a renewable alternative to petroleum-based chemicals, for various uses including biomedical applications. • HiNa Battery – Producing more sustainable, high-performance, low-cost sodium-ion batteries. • KaiOS – Providing affordable internet and access to financial services to unserved populations, primarily in South Asia and Africa. • Lightstandard – Making large language model computing faster and more energy-efficient with photonic computing. • Noematrix – Focusing on researching and developing embodied intelligence systems and related tools and platforms, which are compatible with diverse hardware. • Novlead – Designing a molecular technology platform providing available, accessible and affordable nitric oxide solutions for major clinical needs. • Shengshu Technology – Building generative AI infrastructure that develops native multi-modal large models such as images, 3D and video. • TRANSTREAMS – Engineering chips and solutions to address the computing power shortages in China during the era of AI-generated content. • Turing – Providing cutting-edge computing infrastructure and comprehensive AI solutions to drive the future of intelligent computing.
Colombia • Plurall – Supporting early-stage entrepreneurs in emerging markets with fast, accessible working capital and digital payment solutions, leveraging AI models for risk assessment, collections and embedded lending.
Denmark • Arcadia eFuels – Developing and deploying technology to produce electro-sustainable aviation and diesel fuels using renewable electricity, seawater, and captured CO2.
Egypt • Thndr – Offering a digital investment platform with a range of flexible funding methods and educational resources to empower investors.
France • Ascendance Flight Technologies – Decarbonizing aviation with a hybrid electric propulsion system and hybrid vertical take-off and landing (VTOL) aircraft. • Beyond Aero – Building the first electric business aircraft powered by hydrogen propulsion, as a sustainable alternative to traditional business jets. • CO2 AI – Helping large and complex organizations measure their environmental impact, identify credible levers and decarbonize at scale through AI. • Jimmy – Developing a micro nuclear reactor to provide carbon-free, competitive heat for industrial processes. • Nabla – Reducing clinician burnout by automating clinical documentation with AI. • Orakl Oncology – Creating a biology and AI-powered simulation platform to revolutionize oncology drug development. • Phagos – Deploying a sustainable alternative to antibiotics using bacteriophages and AI • Quobly – Making scalable, cost-competitive, large-scale quantum computers. • Sweetch Energy – Enabling osmotic power generation by harnessing the salinity gradient between freshwater and seawater.
Germany • Accure – Providing predictive battery analytics software to enhance safety, optimize performance and extend the lifetime of battery systems. • Black Forest Labs – Building generative deep learning models for media, particularly images and videos • eleQtron – Developing quantum computers by leveraging trapped-ion technology. • Tozero – Pioneering the delivery of recycled lithium in Europe by sustainably recovering critical materials from battery waste.
India • Agnikul – Providing affordable and customizable space launch services. • CynLr – Building robots with intuitive vision and enabling manufacturers and logistics providers to build fully automated factories. • Dezy – Leveraging AI-powered diagnostic technology to build affordable and accessible dental care. • Digantara – Providing crucial operational support to commercial space operators and space surveillance intelligence to global space agencies. • Equal – Providing an integrated solution that combines identity verification with consent-driven financial data sharing. • Exponent Energy – Making 15-minute rapid charging for electric vehicles affordable and scalable through an innovative battery management system, charging algorithms, thermal management and a charging network. • Freight Tiger – Building India’s largest software-enabled freight network to help businesses move goods with full visibility, efficiency and lower costs. • GalaxEye – Creating a comprehensive, multi-sensor Earth observation system. • SolarSquare – Helping homes switch to solar in India with its full-stack solar panel systems. • The ePlane Co. – Developing flying electric taxis designed for intra-city transportation.
Israel • Fermata – Providing computer vision solutions for farmers to reduce crop losses and pesticide use. • Illumex – Empowering organizations to run governed and reliable AI agents through unified business data language and to democratize data access to every user. • LightSolver – Building a photonic supercomputer by harnessing the power of coupled lasers. • NanoSynex – Offering a rapid and accurate diagnostic platform for bacterial resistance. • ZutaCore – Developing waterless direct-to-chip liquid cooling for AI and high-performance computing (HPC) data centres.
Italy • Arsenale Bioyards – Building new lab-to-production infrastructure enabling fast, low-cost biomanufacturing at an industrial scale.
Japan • Sagri – Leveraging satellite data and AI to transform agriculture through land use optimization and sustainability.
Republic of Korea • Hylium Industries – Providing safe and innovative liquid hydrogen solutions for carbon-free mobility. • NARA Space – Building South Korea’s first microsatellite constellation for methane point source detection. • Robocon – Developing robotics and smart factory solutions for the construction and steel industries.
Luxembourg • Tokeny Solutions – Building the compliance infrastructure for digital assets in blockchain and fintech.
Mexico • Allie – Creating closed-loop optimization systems for manufacturing that autonomously adjust production parameters in real time.
Nigeria • Cybervergent – Providing a platform to automate cybersecurity compliance and risk governance. • Sabi – Powering the sourcing and distribution of physical goods and critical commodities in Africa. • ThriveAgric – Empowering smallholder farmers across Africa by linking them to finance, data-driven best practices, and access to local and global markets.
Saudi Arabia • Intelmatix – Making enterprise AI accessible through industry-specific, context-aware AI agents.
Singapore • Manus – Automating a wide range of practical tasks for personal and professional use with a general AI agent. • Rize – Decarbonizing rice cultivation in Asia through scalable agricultural innovations.
Spain • Crisalion Mobility – Offering sustainable air and ground mobility solutions. • INBRAIN Neuroelectronics – Developing brain-computer interfaces to treat neurological disorders.
Sweden • Graphmatech – Developing advanced materials infused with graphene to make large-scale industries more innovative and resource efficient. • Lovable – Using AI to help users create software and web apps without coding expertise.
Switzerland • HAYA Therapeutics – Developing RNA-based medicines to treat heart, lung and tissue diseases. • Neural Concept – Accelerating product design through 3D generative engineering and AI.
Uganda • Numida – Using credit models and digital underwriting to provide loans to micro businesses.
Ukraine • Respeecher – Enabling scalable voice cloning across languages and contexts.
United Kingdom • CuspAI – Using frontier AI to accelerate the discovery and development of materials with specific functionalities. • Obrizum – Offering personalized digital learning services at scale through an AI-powered platform. • Oxford Ionics – Building high-performance quantum computers using trapped-ion technology.
United States • Ammobia –Fuelling the world with cost-effective, lower-carbon ammonia production. • Archetype AI – Pioneering a new form of Physical AI capable of perceiving, understanding and reasoning about the world through analysing real-time, multimodal sensor data. • Arine – Integrating cutting-edge AI, clinical expertise and advanced data analytics to deliver medication-based care interventions at the population level. • AstroForge – Making critical minerals more accessible to humanity by mining asteroids. • BforeAI – Using behavioural AI to predict and automatically pre-empt malicious campaigns and stop cyberattacks before they occur. • Candidly – Developing an AI-powered platform to help borrowers manage and overcome educational loans. • Claryo – Helping warehouse operators maximize operational efficiency by leveraging spatial generative AI. • Distyl AI – Enabling enterprises to seamlessly integrate AI agents into operations. • Emvolon – Converting methane emissions into carbon-negative fuels for hard-to-abate sectors onsite. • Exowatt – Delivers solar power on demand by storing energy and converting it into electricity as needed, helping data centres and the grid run on clean energy 24/7. • Foundation Alloy – Commercializing solid-state metals technology to make higher performance metals using less energy. • HAIQU – Developing a new application execution stack for all modalities of near-term quantum computers. • Hertha Metals – Developing technology to decarbonize primary steel production. • Hyfe – “Turns food processing waste into chemicals that replace petroleum in everyday goods”. • Lumu Technologies – Providing cybersecurity operations capabilities to help businesses control the impact of cybercrime. • One Bio – Using biotechnology to add anti-inflammatory plant-based fibres to everyday foods. • Oberon Fuels – Developing innovative carbon-neutral fuels for maritime, propane, and hydrogen sectors. • Osmo – Combining frontier AI and olfactory science to digitize scent and enhance well-being. • Outtake – Securing digital identities by detecting and removing harmful AI-generated content. • Parallel Learning – Providing licensed therapy and instruction to students with learning differences through a digital platform. • Pavilion – Increasing efficiency in US public procurement with an AI-enabled government marketplace. • Reality Defender – Offering multimodal detection of AI-generated media to prevent fraud and disinformation. • RoboForce – Building AI-powered robotic systems designed for high-risk or repetitive work, to enhance efficiency, productivity and safety across industries. • Rubi Laboratories – Using biocatalysis to transform CO2 into essential materials like cellulose. • Shiru – Leveraging AI to identify and develop naturally occurring functional ingredients. • Starcloud – Constructing data centres in space to solve the AI energy challenge. • Waterplan – Delivering an AI-powered platform to measure, manage and mitigate water risk. • Workera – Providing AI-driven workforce skills intelligence and upskilling pathways. • Workhelix – Helping companies identify AI transformation opportunities and measure return on investment.
Uruguay • Prometeo – Creating a single, borderless banking application programming interface to connect companies with financial institutions across the Americas.
About the Annual Meeting of the New Champions 2025 The 16th Annual Meeting of the New Champions will take place from 24 to 26 June 2025 in Tianjin, People’s Republic of China, under the theme “Entrepreneurship for a New Era.” The meeting will convene over 1,700 leaders from business, government, civil society, academia, international organizations, innovation and media to explore entrepreneurial solutions to global challenges.
About the Technology Pioneers Launched in 2000, the Technology Pioneers community marks its 25th anniversary in 2025 as a leading platform for early-stage companies from around the world that are shaping the future through breakthrough technologies and innovations. These companies are selected for their potential to have a significant impact on business and society and are invited to engage with public and private sector leaders through the World Economic Forum’s global platform.
The Technology Pioneers community is part of the Innovator Communities within the Forum’s Centre for the Fourth Industrial Revolution. The Innovator Communities convene the world’s leading global start-ups across different growth stages from early-stage Technology Pioneers to growth-stage Global Innovators and unicorn companies valued at more than $1 billion usd/ $ 1.373 billion cad.
Budget 2025 with Bill Robson: What Canadians Need to Know
November, 2025 – Canada does not have a credible fiscal plan. After Ottawa revealed the details of its “sea change” budget, the C.D. Howe Institute’s President and CEO Bill Robson explains why Mark Carney’s first budget in the age of Trump fails to get a passing grade.
Canada is facing significant budgetary challenges, with projected deficits and increased government spending raising concerns about fiscal sustainability and economic health.
Image and article via our friends at The Epoch Times The world is quietly entering a population crisis. Global fertility rates have plunged to their lowest level in 60 years, raising profound questions about how societies will sustain themselves in the decades ahead. In Canada, births have fallen to just 1.25 children per woman, the lowest in our history. Behind the numbers are shifting values, economic pressures, and growing uncertainty about the future. Let’s examine the global decline in birth rates and explores what’s driving it—and what it means for the economy, family, and national identity.
Fertility rates have plummeted worldwide over the past six decades, leading experts to warn of dire consequences as the downward trend continues. Continued low fertility rates will cause “a gradual implosion of the world’s economy as the population ages and dies,” Steven Mosher, president of the Population Research Institute, told The Epoch Times in an email. Mosher is an expert on population control, demography, and China. “This will not occur overnight, of course, but once it is well underway, it will be difficult, if not impossible, to reverse course,” he said. The fertility rate is the average number of children born to a woman in her lifetime; the birth rate is the number of live births per 1,000 people in a population over a given period. Macroeconomist Jesús Fernández-Villaverde called low fertility rates “the true economic challenge of our time” in a February report for the American Enterprise Institute. In 1960, the fertility rate was between four and five. By 2023, that number had halved to 2.2, approaching 2.1, the level at which a population replaces itself from one generation to the next.In July, the U.S. Census Bureau projected that the world’s population will reach 8.1 billion this year. Experts say that although the figure has grown from 3 billion in 1960, the number to watch is the pace of population growth. “The rate of growth peaked decades ago in the 1960s and has been declining since and is projected to continue declining,” the Census Bureau stated. Fernández-Villaverde warned that although the sagging rate of growth may not have immediate consequences, in less than 50 years, declining fertility will affect the world economy. Countries with low or negative birth rates will contend with a shrinking workforce and the ballooning costs associated with an aging population. Global Fertility Rates Only about 4 percent of the world’s population is in countries with high fertility rates—more than five children per woman—and all of those nations are in Africa, according to the Census Bureau. Even in those countries, fertility rates are generally lower than they once were. The Census Bureau reported that nearly three-quarters of the world’s population is in countries where fertility rates are at or below the replacement level. The fertility rate in India, the world’s most populous country, has steadily declined over the past six decades. In June, the U.N. Population Fund reported that India’s fertility rate stood at 1.9 children per woman, down from five or six children in 1960.In Canada, fertility rate fell to 1.25, well below the replacement level of approximately 2.1 children per woman needed to maintain a stable population. In 1990, China’s fertility rate was 2.51, despite its one-child policy. By 2023, it had dropped to less than one birth per woman, according to the U.N.’s population division .In the United States, fertility has undergone a persistent decline. It fell below the replacement level in 1972, and in 2023, it reached 1.62—a historic low.Asian and European countries have the lowest fertility rates in the world, and South Korea (0.72), Singapore (0.97), Ukraine (0.977), and China (0.999) all have rates below one.
In the second year of our regulatory scorecard paper, results continue to show the need for a more balanced approach to financial oversight, one that explicitly incorporates innovation and competition alongside traditional stability and consumer protection goals.
Newly issued and updated regulatory documents did not change previous results.
The imbalance reflects the mandates of Canadian regulators, which stand in contrast to those of their UK, Australian, and US peers, where innovation and competition are more explicitly recognized.
The study highlights deficiencies in the implementation and communication of cost-benefit analyses. Compliance costs are increasingly embedded across most of the financial sector workforce, with the share of labour costs and revenues devoted to compliance rising steadily, significantly exceeding international counterparts, and falling disproportionately on smaller firms.
If left unaddressed, these asymmetric and rising compliance costs risk diverting skilled labour and capital away from core business functions, undermining productivity, innovation, and the overall competitiveness of Canada’s financial sector.
Modernizing the mandates of Canadian regulators to explicitly recognize the tradeoffs between stability, investor protection, and economic dynamism is an economic imperative.
1. Introduction
Canada continues to face a well-documented struggle with weak productivity growth, poor business investment, and sluggish economic expansion.1 There is also a quantifiable link in Canada between growing regulatory burdens, including financial sector regulation and weaker growth.2 The challenge, therefore, is not whether to regulate, but how: regulators must find a balance between safeguarding financial stability and enabling economic dynamism. Achieving such a balance could be especially consequential in Canada, where both growth and competitiveness remain fragile.
Against this backdrop, a crucial question is whether Canadian financial regulators operate within a sound and structured framework that ensures the implementation of truly necessary rules and regulations. To provide an answer, this paper builds on the work of Bourque and Caracciolo (2024)3 which employed two complementary types of analysis – one theoretical, one empirical – to shed light on the strengths and the weaknesses of Canada’s regulatory landscape.
The theoretical analysis established the foundation for evaluating regulatory effectiveness by defining the core principles that should guide financial regulators in building a sound and efficient regulatory framework.4 It identified three essential steps that should underpin any regulation-making process: (1) thoroughly identifying the problem; (2) conducting a comprehensive cost-benefit analysis to weigh the implications of potential regulations; and (3) clearly articulating objectives to ensure predictability and consistency.
The empirical analysis involved a two-stage quantitative and qualitative textual analysis. The first stage consisted of an international comparison, where the performance of Canada’s primary federal financial regulator – the Office of the Superintendent of Financial Institutions (OSFI) – was benchmarked against two international counterparts: the United Kingdom’s Prudential Regulation Authority (PRA) and the Australian Prudential Regulation Authority (APRA). This comparative analysis helped contextualize OSFI’s regulatory approach in relation to best practices observed in other financially comparable jurisdictions.
The second stage dug deeper into the Canadian financial regulatory landscape, evaluating the regulations of the main federal and provincial bodies against the principles identified in the theoretical framework. To do this, Bourque and Caracciolo (2024) developed a comprehensive scorecard that assessed core regulatory documents to determine the extent to which Canadian regulators adhered to these principles.
The findings showed that although Canadian regulators have generally succeeded in crafting well-structured regulations, their approach often falls short of adhering – on aggregate – to the core principles outlined in the framework. This leads to a lack of predictability and a more reactive, rather than proactive, set of rules and regulations. In this environment, rules are introduced in response to emerging challenges rather than through proactive, forward-looking planning. Further, there is a notable lack of systematic and substantive use of cost-benefit analysis, both in the development of regulations and in communicating their expected impact.
The scorecard allowed for an investigation into the priorities of Canadian regulators. Most of the current regulations in Canada place financial stability and consumer protection as their primary goals. These are, of course, both crucial objectives; however, they are too often pursued without adequate consideration of their interplay with innovation and competition. As a result, regulatory frameworks may end up stifling growth, particularly among smaller firms that lack the resources to absorb compliance costs as easily as larger institutions.
Building on last year’s study, this paper has three principal objectives. First, it updates the regulatory scorecard. An annual update makes it possible to track how Canadian regulatory priorities evolve over time and assess whether any progress is being made in addressing the shortcomings identified earlier. Notably, this updated scorecard reveals that the fundamental orientation of Canadian financial regulation remains largely unchanged: stability and consumer protection continue to dominate (if anything, with a slight uptick), while considerations of dynamism, innovation, and competition remain on the back burner. To be sure, some rebalancing is emerging. Ad hoc initiatives – such as blanket orders, sandbox activities, and similar discretionary measures – have introduced some pockets of innovation and efforts to reduce administrative burden. Nevertheless, our main point persists: without a deeper shift in regulatory philosophy, such measures risk remaining isolated exceptions, rather than indicative of a broader shift.
To probe the core of Canadian regulators’ philosophy – and to test whether the observed regulatory imbalance is structural – the analysis is extended to include foundational documents that set out regulators’ objectives, mandates, and missions.5 Examining these texts allows for an assessment as to whether the current priorities are rooted in the very design and self-perception of regulatory institutions, rather than from recent or temporary policy choices. The results show a clear hierarchy of objectives in regulator mandates across the country, with stability and consumer protection firmly dominant. This stands in contrast to the mandates of regulators in the UK, Australia, and the US, where innovation and competition feature more prominently. Without a shift toward a more balanced regulatory philosophy, Canada risks falling further behind in competitiveness, innovation-driven growth, and overall economic resilience.
One consequence of this regulatory imbalance is the potential for disproportionate compliance costs – relative to benefits – being imposed on the financial sector. Hence, the third goal of the paper is to evaluate the cost side of cost-benefit analysis in regulatory decision-making. We do this by quantifying and identifying compliance costs imposed by financial regulations across different financial subsectors, with particular attention to varying firm sizes. By empirically assessing these costs, this study fills a critical gap in the literature, offering concrete evidence of how current regulatory frameworks affect businesses, especially smaller firms that may face a heavier burden. Our aim is to start a new, thorough, and reliable database that will create valuable insights for policymakers and regulators.
The first wave of results is concerning.
Although the benefits of regulation are difficult to measure, compliance duties are becoming increasingly embedded across most of the financial sector workforce. The share of labour and revenues devoted to compliance continues to rise – well above international counterparts – and the burden falls disproportionately on smaller firms. If left unaddressed, these asymmetric and rising compliance costs risk diverting skilled labour and capital away from core business functions, further undermining productivity, innovation, and the overall competitiveness of Canada’s financial sector.
2. The Updated Scorecard
2.1 Methodology
To update the regulatory scorecard, we employ the same textual and topic analysis framework as in the previous study (Bourque and Caracciolo 2024), applying it to newly issued and updated regulatory documents from the past year (June 2024 to June 2025) alongside previous documents. Our focus remains on key regulatory materials across the banking, insurance, pensions, and securities sectors, including Financial Services Regulatory Authority of Ontario (FSRA) Guidelines, Autorité des marchés financiers (AMF) Guidelines, Office of the Superintendent of Financial Institutions’ (OSFI) Guideline Impact Analysis (and related documents), and Canadian Securities Administrators’ (CSA) Companion Policies.6
Using natural language processing (NLP) techniques (see Bourque and Caracciolo [2024] for a more complete description), we extract and classify key terms, sentences, and logical arguments to assess how these documents address market failures (e.g., market abuse, asymmetric information, systemic and liquidity risk), policy objectives (e.g., stability, transparency, efficiency), and cost-benefit considerations.7 This allows us to evaluate the extent to which Canadian regulators align with the core principles of sound regulatory decision-making: problem identification, cost-benefit assessment, and clear articulation of objectives.
While the core methodology remains unchanged, this iteration refines our classification process.8 We will perform this update on an annual basis, allowing us to systematically track shifts in regulatory priorities over time. The full updated scorecard, which reflects these refinements and new findings, is presented in online Appendix C (Table 1).
2.2 Results
This updated regulatory scorecard reveals similar results as last year in Canadian financial regulation: the fundamental priorities of regulatory authorities have remained largely unchanged, with consumer protection, transparency, and stability dominating the regulatory agenda. Despite ongoing discussions about the need to stimulate economic growth in Canada, our analysis indicates that a more balanced approach to financial oversight, one that explicitly incorporates innovation and competition alongside these traditional goals, remains largely absent from newly issued and updated regulatory documents (evaluated alongside existing documents).
Most regulatory initiatives (approximately 92 percent versus 89 percent of last year) primarily target market abuse, stability, transparency, and, ultimately, improved consumer protection. On the other hand, a smaller fraction (around 14 percent, compared to 16 percent last year) explicitly aim to enhance efficiency, promote growth and innovation, and take into account the stability versus dynamism trade-off that is a critical part of any regulatory structure.
One notable exception among the newly analyzed documents is delivered by FSRA’s Guideline GR0014APP, which demonstrates a departure from the prevailing regulatory narrative. This document explicitly acknowledges the importance of fostering a more dynamic financial marketplace, introducing measures aimed at reducing barriers to entry and enhancing the competitive landscape.9 We also acknowledge that CSA’s National Instrument 81-101 Mutual Fund Prospectus Disclosure, which focuses on enhancing transparency and investor protection through standardized disclosure requirements, aims to simplify the disclosure procedure and, therefore, represents an important step forward in regulatory efficiency.
Beyond these individual measures, we note that FSRA and CSA have also set out broader ambitions. FSRA’s 2024–2027 Strategic Plan highlights burden reduction and regulatory efficiency, while CSA’s 2025–2028 Business Plan emphasizes internationally competitive markets and regulatory approaches that adapt to innovation and technological change. These commitments are commendable and encouraging, but they remain largely aspirational: they signal intent, but the challenge is whether they will translate into consistent features of day-to-day regulatory instruments. Our annual updated scorecard will be able to monitor this.
Breaking down our analysis to the single regulator level, FSRA stands out as the one that has gone furthest in bridging the gap between intentions and actions: around 17 percent of its analyzed documents now contain growth or innovation considerations (up from 13 percent last year). By contrast, CSA – which admittedly had the highest percentage last year – OSFI, and AMF remain closer to their prior levels, with innovation-oriented content in only 18 percent, 10 percent, and 10 percent of their documents, respectively. For now, the broader regulatory environment continues to disproportionately prioritize risk mitigation and consumer safeguards over fostering a more adaptive and competitive financial sector.
Moreover, and again consistent with last year, there is a dearth of explicit cost-benefit analysis or meaningful discussion of the broader economic costs imposed by the regulatory interventions across nearly all examined documents.10
3. Where Does This Imbalance Come From?
Our scorecard raises a fundamental question: is this imbalance an unintentional result, or does it reflect the regulators’ mandate and therefore a structural feature of Canada’s regulatory landscape? To answer this, we examined the mandates and missions of Canadian financial regulators (prudential and securities regulators alike). For the vast majority, dynamism, competition, and capital formation are typically only included following the mission statements – OSC being a notable exception. The primary focus of the mission statements remains on stability, investor protection, and market integrity, which are vital but fall short of capturing the full potential of a dynamic, innovative financial sector.
For example, OSFI’s mandate is to:
“ensure federally regulated financial institutions (FRFIs) and federally regulated pension plans (FRPPs) remain in sound financial condition;
ensure FRFIs protect themselves against threats to their integrity and security, including foreign interference;
act early when issues arise and require FRFIs and FRPPs to take necessary corrective measures without delay;
monitor and evaluate risks and promote sound risk management by FRFIs and FRPPs.”11
It is only after that that they say, “In exercising our mandate:
for FRFIs, we strive to protect the rights and interests of depositors, policyholders and financial institution creditors while having due regard for the need to allow FRFIs to compete effectively and take reasonable risks.”
To further substantiate this point, we look to see whether the secondary status of competition, cost, and innovation in Canadian regulators’ mandates is a uniquely Canadian phenomenon or part of a broader international pattern. Benchmarking against international best practices is particularly relevant in financial regulation, where peer jurisdictions face similar market dynamics and policy tradeoffs. By comparing Canada’s regulatory mandates to those of similar international counterparts, we can better assess whether the Canadian approach reflects a deliberate policy choice or a missed opportunity to align with evolving global standards.
As in the scorecard, we conducted a systematic textual analysis of the mandates and missions of major financial regulators in Canada, the UK,12 Australia,13 and the United States.14 Using natural language processing techniques, we extracted and quantified the most prominent themes and keywords in these foundational documents.15 The results are visually summarized in the accompanying wordclouds. The size of each word reflects its frequency and “keyness” – a measure of statistical importance and relevance within the analyzed texts. Unlike simple term frequency, this approach highlights the concepts and priorities regulators emphasize disproportionately relative to the overall corpus, providing a more nuanced quantitative assessment. The wordclouds thus offer an intuitive visual snapshot of the dominant regulatory themes.
What emerges from this analysis is a clear divergence in regulatory philosophy. The wordclouds for the UK and Australia show that terms such as “competition,” “growth,” and “cost” are extremely relevant in the language of their regulators’ mandates. This reflects an explicit and deliberate embedding of economic dynamism and efficiency into their regulatory objectives.
Indeed, the UK’s PRA and Australia’s APRA, while maintaining stability and consumer protection as core priorities, have made efforts to explicitly incorporate competition, innovation, and market adaptability into their mandates over the past decade (Figure 1). The PRA, for example, makes the case that long-term resilience requires a financial sector that is not only stable but also competitive, forward-looking, dynamic, and innovative. By integrating efficiency and market innovation, the PRA looks to ensure that the financial ecosystem can grow and evolve with emerging market demands.
Similarly, APRA’s mandate balances the primary objective of safety “with considerations of competition, efficiency, contestability (making barriers to entry high enough to protect consumers but not so high that they unnecessarily hinder competition) and competitive neutrality (ensuring that private and public sector businesses compete on a level playing field).”16
In contrast, the wordclouds for Canadian deposit-taking and insurance regulators reveal a notable absence of such language (see Figure 2 for OSFI, FSRA17, and AMF18). Their mandates and mission, while perhaps containing references to competition and growth, are dominated by terms like “stability,” “solvency,” “obligation,” and “consumer protection.”
This linguistic gap is not just cosmetic; it reflects a structural difference in regulatory philosophy. Without a formal mandate to consider competition or cost, many Canadian regulators have less incentive to systematically integrate these factors into their rulemaking.
A similar divergence is evident in securities regulation. The UK’s Financial Conduct Authority (FCA) and the US Securities and Exchange Commission (SEC) place competition, growth, dynamism, and capital formation at the centre of their regulatory mandates (Figure 3).19
These are not just theoretical differences. SEC’s statutory responsibility to facilitate capital formation led to a practical framework that drives policies to increase market access for a broader range of firms. The SEC has introduced initiatives such as Regulation A+ and crowdfunding exemptions, which aim to make it easier for small and emerging firms to raise capital while balancing investor protection. The FCA’s mandate similarly incorporates competition as a core principle, emphasizing measures to ensure that financial markets remain vibrant and responsive to technological progress, highlighting also how this, in turn, will increase investors’ welfare.
In contrast, although some of the largest securities commissions – such as the OSC, BCSC, and ASC – are notable exceptions, explicit competition or capital formation mandates are not necessarily the norm across our 13 provincial securities commissions, nor at the umbrella organization, the CSA (see Figure 4 for CSA’s wordcloud).20The Ontario government did take a step in this direction in 2021, when it expanded the OSC’s mandate to include fostering capital formation and competition.
While investor protection and market integrity remain fundamental and essential objectives, the absence of a consistently clear directive to foster market dynamism means that regulatory actions are more likely to be slanted towards a more cautious, conservative approach. There have certainly been some targeted efforts to support innovation and broaden access to capital, such as the CSA’s Financial Innovation Hub21 and their harmonized crowdfunding rules, but these remain isolated and ad hoc. Unlike the systematic, mandate-driven commitment seen in the UK and the United States, Canadian initiatives are not consistently rooted in a formal regulatory priority to promote capital formation.
This regulatory gap is particularly concerning given Canada’s persistent struggles with weak productivity growth, poor investment, sluggish economic expansion, and relatively low levels of innovation adoption.22 A financial regulatory environment that does not explicitly encourage competition, innovation, and capital formation may reinforce these trends by raising barriers to entry, increasing compliance costs for smaller firms, and discouraging capital market participation, particularly from high-potential startups and emerging sectors. The absence of a statutory capital formation mandate within securities regulation means that new firms seeking to grow or disrupt established industries may face challenges in accessing the funding they need, further contributing to a stagnant market environment.
Modernizing the mandates of Canadian regulators to explicitly recognize the tradeoffs between stability, investor protection, and economic dynamism is an economic imperative. Without a shift toward a more balanced regulatory philosophy, Canada risks falling further behind in capital market competitiveness, innovation-driven growth, and overall economic resilience. Financial stability does not have to come at the expense of progress, and as other international regulators are trying to do, we should aim to achieve the best-designed regulatory framework in order to foster both stability and market growth. A more forward-looking mandate, in which competition, capital formation, and innovation are treated as integral to the health of the financial system, would not only strengthen Canada’s economic position but also ensure that its regulatory framework remains adaptable to future challenges and opportunities.
4. Neglected by Design: Quantifying the Costs of Regulation
A practical consequence of the imbalance in regulatory priorities are gaps in how cost-benefit analyses are designed and implemented in Canadian financial regulation. A further goal of this paper is to help push this issue ahead by developing a method for more accurately quantifying regulatory costs. The aim is to create a new, annually updated and survey-based cost database that provides a new lens on the regulatory burden and equips regulators with a tool to better understand the real impact of their activity across firms of different sizes and sectors. We acknowledge upfront that we focus specifically on the cost side of the analysis, leaving the benefits assessment to future work.
4.1 The Importance of Quantifying Regulatory Costs and the Difficulties Implied by the Task
The costs of regulations – across all industries, including financial services – are often cited as one of the biggest factors contributing to reduced market entry, increasing industry concentration, and weak investment. This pattern is evident worldwide, including in the United States and Canada (Gutiérrez and Philippon 2019, 2017), as well as in many other developed countries (Aghion et al. 2021). The mechanism postulated by the literature above is that compliance costs as a result of government regulations disproportionately impact small firms, creating barriers to new entrants, inhibiting business growth, and therefore ultimately slowing down productivity. Additionally, when large incumbents face increased regulatory costs, they either incur them, which may affect other parts of their business, or pass some of these costs on to consumers, especially if, given higher barriers, they end up possessing significant market power. As a result, consumers will also be adversely affected, which has broader implications for the overall economy.
The central issue remains the unresolved question of how to define and quantify the total compliance cost properly, as well as how to assess whether these costs affect small and large firms differently. Measuring compliance costs at the firm level is, in fact, a highly complex challenge from both qualitative and quantitative perspectives.
First, from a qualitative perspective, there is no unanimous agreement on which costs to include and how to model their impact on different firms. While some argue that the biggest part of compliance costs can be significantly decreased through economies of scale and lobbying, and therefore are much smaller for larger firms (Davis 2017; Alesina et al. 2018; Gutiérrez and Philippon 2019; Akcigit and Ates 2020; Aghion et al. 2021), others suggest that small businesses are, in fact, the ones in a better position, as they receive plenty of exemptions (Brock and Evans 1985; Aghion et al. 2021).23
Second, from a quantitative perspective, measuring firm-specific regulatory burdens presents numerous obstacles. Quantifying firm-level compliance costs is complex due to limited granular data. Existing studies often focus on broad relationships or industry-level shocks (Gutiérrez and Philippon 2019), lacking detailed evaluations of individual business burdens. These obstacles include variations in regulatory requirements across financial subsectors, overlapping regulations from different government levels, tiered compliance rules, varying inspection stringency, and differing technological and efficiency constraints across firm sizes (Agarwal et al. 2014; Stiglitz 2009; Kang and Silveira 2021; Goff et al. 1996). As Goff et al. (1996) noted, “the measurement problems are so extensive that directly observing the total regulatory burden is practically impossible.”
4.2 Modelling and Measuring Compliance Cost and Its Impact on Labour Productivity: Traditional Methods and Our Approach
Traditional approaches to quantifying the regulatory burden typically fall into two broad categories: counting the number of regulations in force or measuring the size of compliance departments within firms.24 The first approach, despite its widespread use, is simplistic and can be misleading. It assumes that each new regulation automatically adds the same weight to firms’ compliance burdens, failing, therefore, to account for differences in complexity, enforcement, and actual economic impact. Most importantly, it also disregards the fact that not all regulatory documents impose additional costs. Some provide clarifications, interpretation, simplify compliance procedures, or consolidate existing rules, thereby reducing uncertainty and making it easier for businesses to adhere to legal requirements. A regulatory framework with an extensive set of well-organized, clearly written guidelines can be far easier to navigate than a system with fewer but ambiguous or conflicting regulations. Yet, a raw count of regulations makes no such distinctions, treating all rules as equally burdensome and limiting insights into the real costs faced by businesses.
The second common approach – measuring the size of compliance departments – is somewhat more informative but still incomplete. This method operates on the assumption that regulatory costs can be estimated by looking at the number of employees explicitly assigned to compliance roles.25 While this metric does offer a tangible measure of firms’ direct expenditures on compliance, it fails to capture the reality that regulatory obligations extend far beyond dedicated compliance teams. In practice, firms cannot limit compliance tasks to a single department; employees across multiple functions – including finance, operations, and even customer service – must allocate significant portions of their work to meeting particular regulatory requirements. These responsibilities often divert employees from their core business functions, increasing operational complexity and reducing efficiency in ways that are difficult to measure using traditional methods.
The failure to account for these indirect costs leads to a fundamental misrepresentation of how regulatory compliance affects firms, particularly with respect to labour productivity. Standard measures of productivity typically calculate output per worker, assuming that all employee time is dedicated to value-generating activities. However, when employees across departments must dedicate significant portions of their time to compliance, their effective contribution to production decreases even if they are not officially counted as part of the compliance workforce. This distortion is particularly relevant in highly regulated industries, such as the financial sector, where firms must continuously adapt to evolving rules, engage in periodic audits, and maintain detailed reporting practices. These obligations consume work hours that could otherwise be devoted to innovation, strategic growth, or client service. By failing to account for these hidden labour costs, traditional approaches systematically underestimate the true economic impact of regulatory compliance.
Evidence in support of this argument comes from occupational data sources such as the US O*NET database, which provides firm-level insights into job responsibilities at the single-employee level across industries. These data reveal that compliance-related tasks affect, to different extents, most of the workers, and are not confined to designated regulatory personnel.26
A more accurate framework for assessing regulatory costs must therefore go beyond these limited proxies and capture the full extent of compliance-related labour reallocation. This is precisely what we try to accomplish with our project. Through detailed firm-level surveys, we collect data not only on compliance department size but also on how regulatory responsibilities are distributed across the entire workforce. By distinguishing between employees who are fully dedicated to compliance and those who must allocate a portion of their time to regulatory tasks, we can develop a more precise estimate of how compliance demands affect firms’ overall labour productivity and financial performance. Our approach, which we call the Compliance Labour Cost Index, allows us to measure variation in regulatory costs across firms of different sizes and financial subsectors, helping to assess whether burdens are proportionate or not.27
Furthermore, our survey methodology captures the evolution of compliance intensity over time. This paper presents the first wave of our survey, with our long-term goal being to conduct it every year, thereby creating a dynamic, up-to-date resource for understanding regulatory costs. By maintaining a consistent, structured approach to data collection, we will be able to track changes in compliance burdens over time, offering insights into whether new regulations are increasing costs, whether firms are finding more efficient ways to comply, and how regulatory expenses vary across different business models. This database will provide a clearer picture of regulatory costs at the firm level and also equip policymakers with the empirical evidence necessary to design smarter, more effective regulations – ones that balance economic growth with necessary oversight.
The results presented here are based on an unbalanced panel29 of survey responses covering three fiscal years: 2019, 2023, and 2024.30 This structure allows us to capture both pre- and post-pandemic conditions while filtering out the most acute COVID-19-related distortions in 2020, 2021, and 2022. The panel includes firms of varying sizes across the different subsectors of the Canadian financial sector, enabling both an aggregate view and size-based comparisons. The key findings from this survey can be grouped into four main observations, each highlighting a distinct aspect of the compliance burden.
Fact 1: Compliance is Everyone’s Job!
Compliance work is now deeply embedded across the financial sector workforce. In 2024, on average, 73 percent of employees had at least some compliance-related duties, and close to 8 percent spent the majority of their time (75–100 percent) on such tasks. As postulated in the previous sections, regulatory obligations are not confined to specialist compliance teams but are interwoven into the daily operations of most departments, diverting time and focus away from activities that directly generate value for clients or shareholders. The pervasiveness of compliance roles means that regulation is no longer something handled at the margins of the business, but rather a constant presence shaping workflows across the organization.
Fact 2: Compliance Is Eating Payroll – A Growing Regulatory Burden Is Reshaping Workforce Allocation
The share of total labour costs devoted to compliance-related activities (time and salaries spent meeting regulatory requirements rather than delivering core products or services) has been rising steadily. Our Compliance Labour Cost Index stood at approximately 16 percent in 2019, rose to around 19 percent in 2023, and reached 22 percent in 2024. To put it differently, around one dollar in every five spent on payroll is now directed to tasks that exist solely to ensure regulatory adherence. To put these figures in context, Trebbi et al. (2023), using US establishment-level O*NET data, estimate that regulatory compliance accounts for 2.3 percent to 2.7 percent of total labour costs across the US financial sector. This divergence highlights the crucial need for a more systematic cost-benefit approach in Canadian regulatory design. We simply cannot afford such a big gap.31
Fact 3: External Compliance Costs Are Also Surging, and Are Eating into Revenues
While internal labour costs capture the human effort behind compliance, they tell only part of the story. A significant (and growing) portion of the regulatory burden is channelled through external spending: advisory fees, legal fees, compliance technologies, governance structures, and membership dues. These costs are less visible but no less impactful, directly affecting firms’ bottom lines and reducing their strategic flexibility. To gauge both their scale and their evolution over time, we measure external compliance costs as a share of total revenues. We can observe how this ratio has risen steadily over the three years analyzed, climbing from about 1.2 percent in 2019 to 1.6 percent in 2024. The increase reinforces how compliance imposes a mounting financial strain beyond internal labour, diverting resources that could otherwise be invested in innovation, growth, and other productive initiatives.
Fact 4: Size Matters (a Lot!) – The Compliance Burden Hits Small Firms Hardest
A striking asymmetry emerges between small firms (under 100 employees) and large firms (over 100 employees).32 While the growth rate of compliance involvement and costs appears independent of firm size, their magnitude is not. In both 2023 and 2024, an average of 35 percent of workers in small firms had high or medium compliance involvement, compared with just 13 percent in larger ones.
As a natural consequence, smaller institutions shoulder significantly higher compliance costs: in 2024, the labour cost index reached 20 percent for small firms, compared with 12 percent for larger ones.
This imbalance is particularly worrying when we consider that small firms and startups are often the main engines of innovation, and as they grow, of productivity growth as well. Yet, these seem to be precisely the firms disproportionately drained by regulatory demands, risking a throttling effect on the dynamism and competitiveness of the entire financial sector.
In short, these facts require attention. Reassessing compliance costs must be an urgent priority on the regulators’ agenda, as it is essential to ensure the health and resilience of our financial sector.
5. Policy Discussion and Conclusion
The updated regulatory scorecard confirms that the core patterns identified in prior analysis persist. Canadian financial regulation continues to focus overwhelmingly on stability and consumer protection, while innovation, competition, and cost-efficiency remain secondary. This regulatory orientation is not just a product of recent policy inertia; it is deeply rooted in the structural design of mandates and institutional priorities. Current mandates apply a lexicographic hierarchy that prioritizes financial stability and consumer safeguards above all else – often at the expense of reducing unnecessary regulatory burdens and fostering economic dynamism and growth.
This imbalance is set to become an even greater challenge amid profound global shifts. Political instability in the United States, ongoing conflicts, and broader geopolitical tensions have created a more volatile and unpredictable environment. Stability will remain crucial, but Canada also has an opportunity to adopt regulatory frameworks that actively promote efficiency, innovation, and growth. With such elements in place, Canadian financial institutions can better thrive in a changing world while reinforcing the very stability regulators aim to safeguard.
The costs of the current imbalance are already evident. Evidence shows that compliance burdens are rising sharply, with significant implications for firms’ competitiveness. Our Compliance Labour Cost Index, which tracks regulatory labour across the sector, reveals that compliance demands grew from 16 percent of total internal labour in 2019 to 21 percent in 2024. The strain is particularly acute for smaller firms, where compliance costs reached 28 percent of payroll – double the share borne by larger institutions. External compliance expenses, including advisory, technology, and governance costs, have also grown, further restricting firms’ ability to invest in growth and innovation.
These findings show that stability-focused regulation, absent economic balance, can erode productivity, innovation, and long-term market vitality. Smaller firms are particularly vulnerable, even though they are central drivers of competition and innovation. Policy responses should therefore focus on two priorities.
First, regulatory mandates must be modernized to recognize the full set of policy objectives: stability, investor protection, efficiency, growth, and competition. Explicitly embedding economic goals alongside traditional safeguards would bring Canadian practice closer to international standards and create a more adaptive framework. Encouragingly, securities regulators in Ontario, BC, and Alberta, as well as Ontario’s provincial prudential regulator, FSRA, have already begun acknowledging this need in business plans that emphasize competitiveness and in guidelines aimed at reducing regulatory burden. Our scorecard will continue to track whether such commitments translate into practice.
Second, regulatory design should always require rigorous cost-benefit analyses that are made publicly available at the outset of rulemaking. Transparent, upfront cost-benefit analyses would establish clear benchmarks against which post-implementation reviews can be meaningfully conducted. Tools such as our Compliance Labour Cost Index can enrich this process of comparison. Institutionalizing public cost-benefit analyses would ensure that regulations are evaluated not only against their intended goals but also against their real-world economic costs, enabling more proportionate and adaptive policymaking.
In sum, safeguarding stability and protecting consumers remain essential. But stability itself increasingly depends on Canada’s ability to sustain competitive, innovative, and efficient financial markets.
The author extends gratitude to Pragya Anand, Angélique Bernabé, Ian Bragg, Jeff Guthrie, Sarah Hobbs, Jeremy Kronick, Peter MacKenzie, Grant Vingoe, Mark Zelmer, Tingting Zhang, and several anonymous referees for valuable comments and suggestions. The author retains responsibility for any errors and the views expressed.
Agarwal, Sumit, David Lucca, Amit Seru, and Francesco Trebbi. 2014. “Inconsistent Regulators: Evidence from Banking.” The Quarterly Journal of Economics 129(2): 889–938.
Aghion, Philippe, Antonin Bergeaud, Timo Boppart, Peter J. Klenow, and Huiyu Li. 2019. “Missing Growth from Creative Destruction.” American Economic Review 109(8): 2795–2822.
Akcigit, Ufuk, and Sina T. Ates. 2020. “Ten Facts on Declining Business Dynamism and Lessons from Endogenous Growth Theory.” American Economic Journal: Macroeconomics 13(1): 257–298.
Alesina, Alberto, Carlo A. Favero, and Francesco Giavazzi. 2018. “What Do We Know about the Effects of Austerity?” American Economic Association Papers and Proceedings 108: 524–530.
Brock, William A., and David S. Evans. 1985. The Economics of Small Businesses: Their Role and Regulation in the U.S. Economy. New York: Holmes & Meier.
Davis, Steven J. 2017. “Regulatory Complexity and Policy Uncertainty: Headwinds of Our Own Making.” Brookings Papers on Economic Activity (Fall): 301–375.
Goff, Brian L., et al. 1996. Regulation and Macroeconomic Performance. Vol. 21. New York: Springer Science & Business Media.
Gu, Wulong. 2025. “Regulatory Accumulation, Business Dynamism and Economic Growth in Canada.” Analytical Studies Branch Research Paper Series, no. 481. Statistics Canada. February 10. https://doi.org/10.25318/11f0019m2025002-eng.
Gutiérrez, Germán, and Thomas Philippon. 2017. “Declining Competition and Investment in the U.S.” NBER Working Paper No. 23583. https://doi.org/10.3386/w23583.
_______________. 2019. “The Failure of Free Entry.” NBER Working Paper No. 26001.
Kang, Karam, and Bernardo S. Silveira. 2021. “Understanding Disparities in Punishment: Regulator Preferences and Expertise.” Journal of Political Economy 129(10): 2947–2992.
Restuccia, Diego, and Richard Rogerson. 2008. “Policy Distortions and Aggregate Productivity with Heterogeneous Establishments.” Review of Economic Dynamics 11(4): 707–720.
Stiglitz, Joseph. 2009. “Regulation and Failure.” In New Perspectives on Regulation, edited by David Moss and John Cisternino, 11–23. Cambridge, MA: The Tobin Project.
Trebbi, Francesco, Miao Ben Zhang, and Michael Simkovic. 2023. “The Cost of Regulatory Compliance in the United States.” USC Marshall School of Business Research Paper. January 15. https://doi.org/10.2139/ssrn.4331146.
October, 2025 – Canada has world-class strength in AI research but continues to fall short in widespread adoption, according to a new report from the C.D. Howe Institute. On the heels of the federal government’s announcement of a new AI Strategy Task Force, the report highlights the urgent need to bridge the gap between research excellence and real-world adoption.
In “AI Is Not Rocket Science: Ideas for Achieving Liftoff in Canadian AI Adoption,” Kevin Leyton-Brown, Cinda Heeren, Joanna McGrenere, Raymond Ng, Margo Seltzer, Leonid Sigal, and Michiel van de Panne note that while Canada ranks second globally in top-tier AI researchers and first in the G7 for per capita publications, it is only 20th in AI adoption among OECD countries. “This matters for the economy as a whole, because such knowledge translation is a key vehicle for productivity growth,” the authors say. “It is terrible news, then, that Canada experienced almost no productivity growth in the last decade, compared with a rate 15 times higher in the United States.”
The authors argue that new approaches to knowledge translation are needed because AI is not “rocket science”: instead of focusing on a single industry sector, the discipline develops general-purpose technology that can be applied to almost anything. This makes it harder for Canadian firms to find the right expertise and for academics to sustain ties with industry. Existing approaches – funding academic research, directly subsidizing industry efforts through measures such as SR&ED and superclusters, and promoting partnerships through programs like Mitacs and NSERC Alliance – have not solved the problem.
Four ideas to help firms leverage Canadian academic strength to fuel their AI adoption include: a concierge service to match companies with experts, consulting tied to graduate student scholarships, “research trios” that link AI specialists with domain experts and industry, and a major expansion of AI training from basic literacy to dedicated degrees and continuing education. Drawing on their experiences at the University of British Columbia, the authors show how local initiatives are already bridging gaps between academia and industry – and argue these models should be scaled nationally.
“Canada’s unusual strength in AI research is an enormous asset, but it’s not going to translate into real-world productivity gains unless we find better ways to connect AI researchers and industrial players,” says Kevin Leyton-Brown, professor of computer science at the University of British Columbia and report co-author. “The challenge is not that AI is too complicated – it’s that it touches everything. That means new models of partnership, new incentives, and new approaches to education.”
AI Is Not Rocket Science- 4 Ideas in Detail
Idea 1: A Concierge Service for Matchmaking
We have seen that it is hard for industry partners to know who to contact when they want to learn more about AI. Conversely, it is at least as hard for AI experts to develop a broad enough understanding of the industry landscape to identify applications that would most benefit from their expertise. Given the potential gains to be had from increasing AI adoption across Canadian industry, nobody should be satisfied with the status quo.
We argue that this issue is best addressed by a “concierge service” that industry could contact when seeking AI expertise. While matchmaking would still be challenging for the service itself, it could meet this challenge by employing staff who are trained in eliciting the AI needs of industry partners, who understand enough about AI research to navigate the jargon, and who proactively keep track of the specific expertise of AI researchers across a given jurisdiction. This is specialized work that not everyone could perform! However, many qualified candidates do exist (e.g., PhDs in the mathematical sciences or engineering). Such staff could be funded in a variety of different ways: for example, by an AI institute; a virtual national institute focused on a given application area; a university-level centre like UBC’s Centre for Artificial Intelligence Decision-making and Action (CAIDA); a nonprofit like Mitacs; a provincial ministry for jobs and economic growth; or the new federal ministry of Artificial Intelligence and Digital Innovation.
Having set up an organization that facilitates matchmaking, it could make sense for the same office to provide additional services that speed AI adoption, but that are not core strengths of academics. Some examples include project management, programming, AI-specific skills training and recruitment, and so on. Overall, such an organization could be funded by some combination of direct government support, direct cost recovery, and an overhead model that reinvests revenue from successful projects into new initiatives.
Idea 2: Consultancy in Exchange for Student Scholarships
Many businesses that would benefit from adopting AI do not need custom research projects and do not want to wait a year or more to solve their problems. The lowest-hanging fruit for Canadian AI adoption is ensuring that industry is well informed about potentially useful, off-the-shelf AI technologies. We thus propose a mechanism under which AI experts would provide limited, free consulting to local industry. AI experts would opt in to being on a list of available consultants. A few hours of advice would be free to each company, which would then have the option of co-paying for a limited amount of additional consulting, after which it would pay full freight if both parties wanted to continue. The company would own any intellectual property arising from these conversations, which would thus focus on ideas in the public domain. If the company wanted to access university-owned IP, it could shift to a different arrangement, such as a research contract. This system would work best given a concierge service like the one we just described. The value offered per consulting hour clearly depends on the quality of the academic–industry match, and some kind of vetting system would be needed to ensure the eligibility of industry participants.
Why would an AI expert sign up to give advice to industry? All but the best-funded Canadian faculty working in AI report that obtaining enough funding to support their graduate students is a major stressor. Attempting to establish connections with industry is hard work, and such efforts pay off only if the industry partner signs on the dotted line and matching funds are approved. There is thus space to appeal to faculty with a model in which they “earn” student scholarships for a fixed amount of consulting work. For example, faculty could be offered a one- semester scholarship for every eight hours set aside for meetings with industry, meaning that one weekly “industry office hour” would indefinitely fund two graduate students. Consulting opportunities could also be offered directly to postdoctoral fellows or senior (e.g., post-candidacy) PhD students in exchange for fellowships. In such cases, trainees should be required to pass an interview, certifying that they have both the technical and soft skills necessary to succeed in the consulting role. The concierge service could help decide which industry partners could be routed to PhD students and which need the scarcer consulting slots staffed by faculty members.
The system would offer many benefits. From the industry perspective, it would make it straightforward to get just an hour or two of advice. This might often be enough to allow the company to start taking action towards AI adoption: there is a rich ecosystem of high-performance, reliable, and open-source AI tools; often, the hard part is knowing what tool to use in what way. Beyond the value of the advice itself, consulting meetings offer a strong basis for building relationships between academics and industry representatives, in which the academic plays the role of a useful problem solver rather than of a cold-calling salesperson. These relationships could thus help to incubate Mitacs/Alliance-style projects when research problems of mutual interest emerge (though also see our idea below about how restructuring such projects could help further).
For academics, the system would constitute a new avenue for student funding that would reward each hour spent with a predictable amount of student support. Furthermore, it would offer scaffolded opportunities to deepen connections with industry. The system would come with no reporting requirements beyond logging the time spent on consulting. The faculty member would be free to use earned scholarships to support any student (regardless, for example, of the overlap between the student’s research and the topics of interest to companies), increasing flexibility over the Mitacs/Alliance system, in which specific students work with industry partners. Students who self-funded via consulting would learn valuable skills and would expand their professional networks, improving prospects for post-graduation employment.
Finally, the system would also offer multiple benefits from the government’s perspective. It would generate unusually high levels of industrial impact per dollar spent (consider the number of contact hours between academia and industry achieved per dollar under the funding models mentioned in Section 3). All money would furthermore go towards student training. The system would automatically allocate money where it is most useful, directing student funding to faculty who are both eager to take on students and relevant to industry, all without the overhead of a peer-review process. And it would generate detailed impact reports as a side effect of its operations, since each hour of industry–academia contact would need to be logged to count towards student funding.
Idea 3: Grants for Research Trios
Our third proposal is an approach for expanding the Mitacs/Alliance model to make it work better for AI. Industry–academia partnerships leverage two key kinds of expertise from the academic side: methodological know-how for solving problems and knowledge about the application domain used for formulating such problems in the first place. In fields for which the set of industry partners is relatively small and relatively stable, it makes sense to ask the same academics to develop both kinds of expertise. In very general-purpose domains like AI, it holds back progress to ask AI experts to become domain experts, too. Instead, it makes sense to seek domain knowledge from other academics who already have it. We thus propose a mechanism that would fund “research trios” rather than bilateral research pairings. Each trio would contain an AI expert, an academic domain expert, and an industry partner. This approach capitalizes on the fact that there is a huge pool of academic talent outside core AI with deep disciplinary knowledge and a passion for applying AI. While such researchers are typically not in a position to deeply understand cutting-edge AI methodologies, they are ideally suited to serve as a bridge between researchers focused on AI methodologies and Canadian industrial players seeking to achieve real-world productivity gains. In our experience at UBC, the pool of non-AI domain experts with an interest in applying AI is considerably larger than the pool of AI experts. One advantage of this model is that projects can be initiated by the larger population of domain experts, who are also more likely to have appropriate connections to industry. Beyond this, involving domain experts increases the likelihood that a project will succeed and gives industry partners more reason to trust the process while a solution is being developed. The model meets a growing need for funding researchers outside computer science for projects that involve AI, rather than concentrating AI funding within a group of specialists. At the same time, it avoids the pitfall of encouraging bandwagon-jumping “applied AI” projects that lack adequate grounding in modern AI practices. Finally, it not only transfers AI knowledge to industry, but also does the same to both the domain expert and their students.
Idea 4: Greatly Expanded AI Training
As AI permeates the economy, Canada will face an increasing need for AI expertise. Today, that training comes mostly in the form of computer science degrees. Just as computer science split off from mathematics in the 1960s, AI is emerging today as a discipline distinct from computer science. In part, this shift is taking the form of recognizing that not every AI graduate needs to learn topics that computer science rightly considers part of its core, such as software engineering, operating systems, computer architecture, user interface design, computer graphics, and so on. Conversely, the shift sees new topics as core to the discipline. Most fundamental is machine learning. Dedicated training in AI will require a deeper focus on the mathematical foundations of probability and statistics, building to advanced topics such as deep learning, reinforcement learning, machine learning theory, and so on. Various AI modalities also deserve separate study, such as computer vision, natural language processing, multiagent systems, robotics, and reasoning. Training in ethics, optional in most computer science programs, will become essential.
Beyond dedicated training in the core discipline, we anticipate huge demand for broad-audience AI literacy training; for AI minors to complement other disciplinary specializations; for continuing education and “micro-credential” programs; and for executive education in AI. There is also a growing need for “AI Adoption Facilitators”: bridge-builders who can help established workers in medium-to-large organizations understand how data-driven tools could offer value in solving the problems they face. Training for this role would emphasize business principles and domain expertise, but would also require firmer foundations in machine learning and data science than are currently typical in those disciplines.
September 2025 – Canada’s immigration policy continues to move in the wrong direction and requires a fundamental course correction, according to a new Communiqué from the C.D. Howe Institute’s Immigration Targets Council.
In “Immigration Policy Still in Need of a Course Correction,” the Council – composed of leading academics and policy experts – stresses that who is selected matters more than meeting numeric targets. They determined that immigration should be guided by human capital and long-term prosperity, not short-term labour market fixes or non-economic objectives. Notably, members also emphasized the importance of transparent, predictable policy that ensures economic immigrants have strong skills, earnings potential, and integration prospects.
Second Meeting of the C.D. Howe Institute Immigration Targets Council
The C.D. Howe Institute Immigration Targets Council held its second meeting on August 26, 2025, bringing together leading academics and policy experts to provide recommendations on Canada’s immigration-level targets and system design.1
Members agreed that Canada’s immigration policy has moved in the wrong direction and needs a fundamental course correction. Members stressed that the labour market skills and earnings potential of immigrants – both temporary and permanent – matter more than meeting numeric targets. Immigration policy should raise average human capital, rather than focusing narrowly on filling short-term labour market gaps, which prevents wage increases and capital investment to enhance productivity, or meeting non-economic objectives such as increasing Francophone immigration outside Quebec. Policy should also be transparent, predictable, and oriented toward long-term prosperity, ensuring that economic immigrants have strong skills, earnings potential, and integration prospects.
Building on these principles, the Council recommended annual permanent resident admissions of 365,000 in 2026, 360,000 in 2027, and 350,000 in 2028, reflecting the Council’s median votes. For 2026, this recommendation is modestly below the government’s current target of 380,000. Some members favoured a gradual reduction over three years to return to historical norms, while others supported higher levels to ease transitions from the non-permanent resident (NPR) population.
The group also raised serious concerns about the rapid growth and complexity of the NPR (Non permanent residency) population, as well as persistent challenges in the asylum system.
Members emphasized the importance of clear guardrails for the NPR population, recommending that the government maintain a ceiling of 5 percent of Canada’s population for NPRs in 2026, with a review in early 2027. They noted that the optimal NPR share requires balancing inflows, outflows, and clear pathways for temporary residents employed in high-skill occupations to transition to permanent residency, using objective criteria such as earnings. Improving efficiency in the asylum system was viewed as critical to protect genuine claimants and reduce pressures on the broader immigration system, since many currently see asylum as a pathway to permanent residency.
The Council further agreed that immigration programs require substantial reforms.
Regarding temporary immigration, members expressed concern that the international student system has become a pathway for low-wage labour rather than a means of attracting top global talent. They recommended higher admission standards, stronger language and academic requirements, limits on off-campus work, and stronger federal oversight to ensure only high-quality institutions and programs are eligible. Similarly, the Temporary Foreign Worker Program should be scaled back and not be used as a substitute for raising wages or improving working conditions, since relying on temporary workers can reduce employers’ incentives to offer better pay or workplace standards. Reducing reliance on low-skilled temporary workers – except in sectors such as agriculture, where transitions take time – was viewed by the group as essential to encourage productivity growth and higher wages for Canadian workers.
For permanent immigration, members were critical of the proliferation of boutique pathways in the economic class, such as category-based selection – targeted draws from the Express Entry pool based on specific attributes like occupation or language – and provincial nominee programs that prioritize lower-skilled workers, which allow provinces and territories to nominate candidates to meet regional labour market needs. They highlighted the need to simplify and strengthen the selection mechanism and agreed that Canada should move toward a single, transparent system centred on Express Entry and the Comprehensive Ranking System (CRS), a points-based tool used to assess, score, and rank candidates in the pool. They supported a human-capital-based model for economic principal applicants, which evaluates individuals on their education, work experience, and language ability, with a revised CRS that places greater weight on predictors of long-term success. New criteria should include the field of study for all applicants and verified earnings in Canada for those with prior Canadian experience. All economic principal applicants, they stressed, should be required to meet the CRS threshold. Members also agreed that these reforms – across temporary and permanent immigration programs, together with improving the integrity of the asylum system – are essential to reducing the size of the non-permanent resident population.
In addition, members highlighted the importance of fast-track pathways and policies to attract top-tier global talent. They called for stronger federal–provincial coordination and targeted initiatives to recruit individuals with extraordinary achievements in fields with lasting impact, such as science, medicine, and artificial intelligence. For high-profile research leaders, this should include pathways that allow them to bring their teams. Attracting such talent, they noted, requires not only immigration pathways but also the infrastructure and support that world-class research demands.
In conclusion, the Council emphasized the urgent need to restore a principled and sustainable immigration policy. By focusing on raising human capital, maintaining guardrails on the non-permanent resident population, addressing weaknesses in the asylum system, and reforming the economic immigration system, Canada can ensure that immigration contributes to long-term prosperity and sustains public confidence.
Members of the C.D. Howe Institute Immigration Targets Council:
Members participate in their personal capacities, and the views collectively expressed do not represent those of any individual, institution, or client.
Convener:
• Parisa Mahboubi, C.D. Howe Institute
Members:
• Don Drummond, Queen’s University
• Pierre Fortin, Université du Québec à Montréal
• David Green, University of British Columbia
• Daniel Hiebert, University of British Columbia
• Michael Haan, Western University
• Jason Kenney, Bennett Jones LLP
• Mikal Skuterud, University of Waterloo
• Christopher Worswick, Carleton University
• Donald Wright, C.D. Howe Institute and Global Public Affairs
August, 2025 – Canada is not building homes quickly enough to meet rising needs, and red tape combined with low productivity is intensifying pressure on the sector. A new report from the C.D. Howe Institute explores how innovative construction technologies could help accelerate delivery and improve efficiency – if supported by the right policy conditions. The Silo predicted this dilemma over a decade ago and highlighted some of these issues and solutions in this “Tiny House” post.
In the report titled “Building Smarter, Faster: Technology and Policy Solutions for Canada’s Housing Crisis,” Tasnim Fariha outlines how innovative construction technologies – such as modular and panelized systems and mass timber – can enhance labour productivity in residential construction. While these approaches are not a silver bullet, they may offer valuable tools for increasing housing supply and managing construction workforce constraints.
Building Smarter, Faster: Technology and Policy Solutions for Canada’s Housing Crisis
Canada’s housing shortage is worsening. The Canada Mortgage and Housing Corporation (CMHC) estimates that to restore 2019 affordability levels in the market, housing starts need to be doubled. CMHC is projecting a need for 430,000–480,000 housing starts annually. But the country is falling far short. Labour shortages, weak productivity in residential construction, and slow permitting processes are making it harder to meet needs.
Innovative construction methods – including modular, panelized, mass timber, and 3D printing – offer potential to improve productivity and accelerate housing delivery, but adoption remains limited due to high upfront costs, fragmented regulations, and insufficient data on performance in the Canadian context.
The federal government’s $26 billion Build Canada Homes initiative signals a strong commitment to innovation, yet without tackling regulatory, financial, and logistical obstacles, these technologies won’t scale or deliver meaningful cost savings. To realize the productivity benefits, governments must streamline permitting, harmonize building code interpretation, reduce development charges, and support workforce training, among other steps.
Introduction
Canada’s housing sector is experiencing a multifaceted crisis characterized by escalating prices, acute affordability challenges, and a critical misalignment between housing supply and population growth. Demographic pressures – such as strong population growth – combined with economic factors like elevated interest rates, soaring housing costs and land prices are reshaping Canada’s housing market. Escalating housing costs have effectively priced out many potential buyers, compelling a larger proportion of the population to enter the rental market, thereby driving increased investment in rental and multi-family housing units (Statistics Canada 2024). However, those units have become much more expensive to build, too, which is reflected in higher rents and fewer starts than necessary to meet demand.
This modal shift reflects both market adaptations to economic constraints and broader structural changes in housing demand and affordability. On top of that, long-standing restrictive regulatory frameworks, including restrictive zoning regulations, substantial development charges, and land use constraints, contribute to housing supply limitations and price escalations (Dachis and Thivierge 2018). Addressing these structural obstacles is crucial for ameliorating persistent supply shortages, rising costs, and broader affordability challenges. The industry has been raising these issues for several years now. For example, in early 2024, the Canadian Home Builders’ Association (CHBA) released a comprehensive sector transition strategy identifying specific recommendations for systematic change in four areas: financial system, policy, labour, and productivity. In 2025, the Canada Mortgage and Housing Corporation (CMHC) emphasized that the pace of housing starts must double to gradually restore affordability to 2019 levels.
Many countries are leveraging prefabrication technologies – such as modular construction, mass timber, panelized systems, and on-site 3D printing – to accelerate homebuilding, increase productivity in the face of tight labour markets, and improve sustainability. In Canada, however, adoption remains limited amidst industry-specific challenges, complex regulations, and insufficient incentives to support these innovations.
Despite their promise, these technologies have not consistently delivered cost savings in the Canadian context. Modular, panelization, mass timber, and 3D concrete printing methods often face higher upfront costs, insurance premiums, or material expenses. To support the adoption of these innovative construction methods in Canada, more country-specific evidence is needed to guide policymakers, regulators, and developers. While international data highlight its benefits – such as speed, cost-effectiveness, and sustainability – Canadian decision-makers require more local insights. Academic-industry partnerships can help generate this evidence by analyzing best practices, labour dynamics, project outcomes, and measurable savings within the Canadian context (Dragicevic and Riaz 2024).
This paper aims to identify the main challenges facing the adoption of innovative home-building technologies in Canada. Drawing on a range of sources – including academic research, government and industry reports, and documents from builders’ associations – it offers an introductory examination of the issues at play. It does not present innovative construction methods as the sole solution to Canada’s housing crisis, but rather as a tool to improve labour productivity and accelerate residential development, particularly when supported by stable market conditions, coordinated government action, and a supportive regulatory environment. While recognizing the potential of these technologies, the paper highlights the need for more publicly available data and independent research to benchmark their performance against traditional building methods. The key recommendations from this paper – aimed at addressing the critical barriers of risk, complexity, and inconsistency – include:
Financial Incentives and Risk Mitigation: Low-cost financing and tax credits to de-risk investments by builders, and construction-financing insurance for off-site construction to boost lender confidence; standardized mortgage and home insurance rules to reduce uncertainty for buyers; and tax incentives for maintenance and repairs of homes built with innovative technologies to build trust among lenders and buyers.
Regulatory Streamlining and Efficiency: Expedited fund disbursement by CMHC to accelerate project timelines of purpose-built rentals and affordable housing; streamlined permitting processes and fast-track approvals for innovative projects; elimination of duplicative inspections for modular builds to reduce delays; reduction of development charges and related fees to improve overall housing affordability; and further research to assess how Canada’s multi-layered regulatory framework compares with international practices and whether it may be limiting competitiveness.
Standardization and Harmonization Across Jurisdictions: Standardizing interpretation of building codes across municipalities to ensure consistency and avoid costly, time-consuming redesigns; standardizing – and where necessary, harmonizing – transportation regulations on modular and prefabricated components across provinces to facilitate efficient, large-scale production and delivery.
Current Challenges in the Housing Market
Supply Shortage
Currently, Canada is not building enough homes to meet its needs. In fact, the housing shortfall isn’t closing – it’s widening. When CMHC first sounded the alarm in 2022, it estimated that Canada needed to build roughly 500,000 housing units per year through 2030 to bring affordability back to early-2000s levels. Last year, the country started building just 245,000 units – less than half the target. Now, CMHC’s latest projections scale down the target but still call for 430,000 to 480,000 housing starts annually over the next decade, merely to restore affordability to 2019 levels. In regions like Ontario, British Columbia, Nova Scotia, and Montreal, the shortfall is even more severe.
Urban centres are disproportionately impacted by limited housing supply. Housing costs are dramatically outpacing income growth, creating substantial barriers for middle-class families, first-time buyers, and young professionals seeking homeownership. Shortage of supply and higher housing costs suppress the formation of new, smaller households, pushing more people into shared or doubled-up living arrangements. Building more housing would allow Canadians to form the types of smaller households they increasingly prefer, such as living alone or only with a partner or children (Lauster and von Bergmann 2024). A striking indicator of this supply crisis is the unprecedented decline in dwellings per 1,000 people (see Figure 1), a reversal from Canada’s historical trend of increasing housing supply. This decline highlights the pressing need for strategies to realign the housing supply with population needs.
Productivity Challenges
Residential construction productivity has not recovered in the post-pandemic period, contrasting with the gradual recovery in the broader construction industry and the overall economy (Figure 2). Recent economic analyses show the industry is expanding by increasing its share of the overall workforce while its share of output is simultaneously declining (Caranci and Marple 2024).
One contributing factor may be the construction sector’s tendency to retain its existing workforce during downturns, avoiding mass layoffs to preserve skilled labour for future booms. Despite the sluggish output growth from this sector since 2022, it continues to expand in terms of employment. For example, between 2020 and 2023, employment grew by 15 percent across all industries and 21 percent in construction overall, while residential building construction saw a 26 percent increase (Statistics Canada 2025a). While this strategy may protect long-term capacity, it can also depress short-term productivity metrics during periods of reduced construction activity. If this dynamic persists, it could have long-term consequences for Canada’s housing infrastructure and broader economic growth.
Affordability Crisis
Despite the urgent need for housing, affordability remains a barrier that limits the purchasing power of many Canadians and prevents the market from meeting housing needs. Home prices have risen nearly 40 percent since 2016, contributing to a significant decline in homeownership across the country. While recent changes to down payment rules and extended amortization periods aim to support buyers, high interest rates continue to erode affordability and heighten mortgage insecurity for both new and existing homeowners. Development taxes – including development fees, lot levies, and amenity fees – have increased by 700 percent over the past two decades and can now account for up to 25 percent of a home’s sale price (CHBA 2024). Between 2011 and 2021, the share of Canadians living in owned homes decreased by 2.5 percent, with nearly all age groups experiencing a drop in homeownership rates.
This shift has led to an increased demand for rental housing, prompting developers to prioritize the construction of more budget-friendly living spaces. According to the CMHC, 72 percent of all housing starts in the first half of 2024 were apartments, with 47 percent of these designated for rental units. However, while increased rental construction is a positive trend, it remains insufficient to close the affordability gap. More housing units for homeownership are required, too. Rising home prices, population growth, and high mortgage rates have driven rental costs higher, further exacerbating affordability challenges and placing additional strain on low-income households. The growth of corporate rental ownership by Real Estate Investment Trusts (REITs), as well as secondary rentals by investors, has played a notable role, too. The average rent for a typical two-bedroom unit across Canada rose by 45 percent between 2018 and 2024, according to the CMHC Rental Market Survey.1 In 2022, Statistics Canada reported that 245,900 households were on the waitlist for social and affordable housing, underscoring the critical need for increased housing supply.2
Labour-Augmenting Home Building Technologies: A Promising Tool for Easing the Housing Crisis
Technological innovation in construction may offer a promising path to improving labour productivity (see Box 1 for a comparison of conventional and innovative homebuilding methods). These labour-augmenting technologies3 have the potential to significantly enhance efficiency and accelerate the pace of homebuilding. Labour-augmenting technologies allow workers to produce more – whether in quantity, quality, or both – within the same amount of work hours. They align with the concept of increasing the capacity of human capital without expanding the workforce. Such progress can arise from various sources, including advancements in machinery, software, work processes, or the education and skills of the workforce. Research suggests that labour-augmenting technological change stimulates gross domestic product (GDP) growth and increases long-run total employment. In open, developed economies, focusing on enhancing the efficiency and productivity of skilled workers yields the greatest benefits (Ross et al. 2024).
Conventional homebuilding methods rely heavily on strenuous physical labour and are vulnerable to weather-related disruptions and higher on-site safety risks. Although specific data on the residential construction sector are limited, the construction industry as a whole remains one of the most hazardous sectors, with on-site building particularly prone to accidents due to the complex and variable nature of the work environment. In contrast, modern homebuilding technologies – such as off-site prefabrication and digital design tools – can reduce project failure rates, shorten construction timelines, enhance defect detection, and significantly improve worker safety (Patel and Kaushal 2024). Working in a stable, climate-controlled factory setting – without the disruptions of a transient worksite – can lead to greater worker satisfaction and productivity (Hoínková 2021).
Modular construction has been around for several decades, involving off-site fabrication in safe, controlled settings and reducing workers’ exposure to harsh outdoor environments. Case studies from countries like Australia, the UK, and the US suggest that modular approaches can reduce construction timelines by 20 to 50 percent compared to traditional methods (Bertram et al. 2019). In panelization, prefabricated panels are assembled quickly on-site, eliminating sequential tasks and allowing different stages of construction to occur simultaneously. This significantly reduces project completion times while minimizing safety risks and physical labour demands. Compared to modular construction, panelization is often more flexible and efficient in terms of storage, transportation, and on-site logistics, making it a more scalable solution in certain contexts. Cross-Laminated Timbers (CLT) used in mass timber construction are easier to handle and assemble. Timber is a suitable material for prefabrication, and its insulating properties create safer working conditions in cold weather. Although somewhat more expensive than other materials, mass timber is valued for its ability to store carbon, contributing to more sustainable construction practices.
Another advantage of shifting to off-site construction is a reduced reliance on labour, especially as Canada’s construction industry faces the retirement of nearly 260,000 workers (22 percent of the workforce) by 2030, requiring over 309,000 new recruits (BuildForce Canada 2021). Research on the global construction sector shows that off-site construction offers a promising solution by enabling 30 to 60 percent of project work to be completed in controlled environments, leading to a potential 5 to 10 times productivity boost through better labour management (Barbosa et al. 2017). Controlled settings also improve worker attraction and support the application of Lean Construction principles. Engaging higher-skilled labour in tasks such as integrating electrical and mechanical systems or operating automated machinery can yield significant productivity gains. Meanwhile, lower-skilled workers can still be effectively engaged in other aspects of the prefabrication process. This approach helps ease the industry’s skilled labour shortage while improving supervision, safety, quality, material efficiency, and schedule adherence (Forestry Innovation Investment 2021).
The time savings and productivity gains cited above are largely drawn from global data across the broader construction sector and may not fully reflect the experience of residential construction in Canada, where adoption of these technologies has been slower and less standardized. The wide variation in estimated time savings often stems from differences in regulatory environments, labour availability, factory capacity, and the degree of integration with on-site workflows. Still, these figures illustrate the potential of innovative construction methods to enhance efficiency. More Canadian-specific research is needed to quantify the net productivity gains – both in time and cost – across different home-building technologies.
Demographic and regional shifts strengthen the case for modular and prefabricated housing. Urban growth, ageing populations, and smaller households are driving demand for compact, denser housing in central areas where land is limited and speed is essential. Modular construction supports this need through rapidly deployable fourplexes, mid-rises, and Accessory Dwelling Units (ADUs) on infill sites – smaller, self-contained homes located on the same lot as a primary residence. It has also proven effective for student housing, offering speed and flexibility. For example, Selkirk College’s residence in BC used a hybrid of modular and mass timber construction to reduce waste, lower costs, and accelerate delivery, earning high marks for energy efficiency while meeting urgent student housing needs.
Similarly, Trinity Western University’s Jacobson Hall in BC was built in just nine months, and the University of British Columbia’s (UBC) 18-storey Brock Commons Tallwood House saw a more than 10 percent reduction in build schedule, with the structure completed in under 70 days after prefabricated panels arrived on-site. In Northern and remote communities like Nunavut and Northern Ontario – where housing needs are urgent and labour shortages acute – off-site construction allows homes to be built in southern factories and rapidly assembled on-site, bypassing the logistical and workforce challenges of traditional construction.
Lastly, it is crucial to assess Canada’s position on the production possibility frontier (PPF), which represents the maximum number of homes that can be built using available resources, such as labour, materials, and technology, without overextending or underutilizing them. Canada’s litany of problems includes high construction costs, elevated mortgage rates, soaring house prices, adverse weather conditions, and regulatory barriers like zoning laws and building codes, along with a lengthy permitting process. So it is reasonable to infer that Canada is currently operating inside the PPF. This indicates productive inefficiency. The country is not fully leveraging its resources to produce the maximum number of homes possible (productive inefficiency may not be directly quantifiable in precise terms due to data limitations). However, in a more conducive environment where regulatory hurdles are reduced and permit approvals are quicker, labour-augmenting technological advancements could shift the frontier outward, increasing labour productivity. This shift could enable Canada to build more homes more quickly and efficiently, helping to address the ongoing housing shortage.
Where Does Canada Stand on Housing Innovation?
Many countries are leveraging modular construction and mass timber to accelerate homebuilding and improve sustainability. While Canada has begun to explore similar approaches to those used in the US and Australia, its adoption has been slower. The reason: structural barriers, regulatory complexities, and a lack of appropriate support. Scandinavian countries, like Sweden, have embraced off-site construction at scale, where 96 percent of homes are built off-site and 84 percent of detached homes use prefabricated elements (Modular Intelligence 2024). These countries benefit from economies of scale, smaller geographies and unified building codes, with higher volumes justifying the upfront investment in off-site manufacturing. Although a direct comparison of productivity or construction costs between Canada and Sweden is difficult due to differences in labour markets, regulations, and building types, off-site construction has proven more efficient than traditional methods within the Scandinavian context. This relative efficiency has driven greater industry uptake and enabled more advanced forms of prefabrication to emerge – supported by long-term investment, automation, and integration into mainstream housing delivery. Moreover, in Europe and Asia, prefabricated construction differs from that in North America in both the materials used and the size of modules or panels (Forestry Innovation Investment 2021). Understanding how these regions arrived at their current practices can offer valuable insights for industry leaders and policymakers.
Recognizing the urgent need for technological innovation to address the current housing crisis, the Canadian government announced a $600 million package in the 2024 budget. This includes a $50 million Homebuilding Technology and Innovation Fund to scale up and commercialize technologies like modular and prefabricated homes, $500 million to support rental housing using modular construction, and $11.6 million to develop a Housing Design Catalogue featuring standardized and efficient blueprints. The Housing Design Catalogue, released earlier this year, offers standardized low-rise designs focused on traditional construction to support gentle density and infill across Canada, with plans to include modular and prefabricated methods in future updates.
Greater potential for transformation lies in the recently announced initiative by the federal government, an agency called Build Canada Homes (BCH). It aims to catalyze the housing industry and create higher-paying jobs by offering $25 billion in debt financing and $1 billion in equity financing to support innovative Canadian prefabricated home builders. Its premise is that prefabricated and modular housing methods have the potential to reduce construction time by up to 50 percent, cut costs by 20 percent, and lower emissions by 22 percent compared to traditional building approaches. BCH also plans to issue bulk orders to manufacturers to stabilize demand, promote the use of Canadian materials like mass timber and softwood lumber, and expand apprenticeship opportunities to grow the skilled trades workforce.
It is too early to assess the impact of these initiatives. The distribution of funds involves lengthy bureaucratic processes, and the market requires time to adapt. Research and development, being inherently time-intensive, further slows immediate results. While these initiatives may hold significant promise for addressing Canada’s housing crisis – particularly in an environment with fewer structural and regulatory barriers – their effectiveness depends on first tackling the core obstacles that continue to hinder housing development and discourage investment in productivity-enhancing innovations.
Government support plays a critical role in driving a sector’s success and growth. As part of the HousingTO 2020-2030 Action Plan,4 the City of Toronto committed to creating 1,000 new modular homes. By 2021, 250 homes were approved, and since then, 216 modular homes have been completed, contributing to the city’s efforts to address housing shortages and provide affordable living spaces. A report from the Auditor General of the City of Toronto5 stated that due to incomplete data and lack of benchmarking, the effectiveness and comparability of modular construction versus traditional methods – regarding cost and speed – could not be assessed. It recommended improvements in project planning, cost monitoring, and data collection to allow for clearer evaluations in the future. Vancouver is also utilizing temporarily available space to build modular affordable housing with support from CMHC and the Vancouver Affordable Housing Agency (VAHA). Calgary and Edmonton are adopting similar initiatives.
In 2020, the National Building Code of Canada (NBC) increased the limit for mass timber construction from 6 storeys to 12 storeys, reflecting advancements in technology and growing confidence in the safety and sustainability of mass timber. Last year, British Columbia updated its provincial building codes to allow mass-timber structures up to 18 storeys. However, due to higher costs, adoption has so far been largely limited to public sector projects.
Canada’s housing market is gradually adapting and embracing innovative technologies at a faster pace. A growing number of companies are now offering innovative housing solutions in Canada, providing faster, sustainable, and innovative alternatives to traditional construction methods. The Kakatoots (Siksika Nation) or Star Lodge in Alberta,6 the Leamington project in Ontario,7 and the Merritt and UBC project in British Columbia8 are some of the ongoing 3D-printed home projects designed to combat the housing crisis in areas experiencing severe labour shortages.
Key Barriers to Housing Innovation
Despite these advancements, the adoption of innovative home-building technologies continues to face substantial challenges:
High overhead costs, risks of investment, and workforce constraints. Modern construction methods are heavily constrained by the high initial investment and overhead costs associated with high-tech tools and equipment, such as prefabrication machinery, 3D printers, and robotics. In addition to utilizing low-skilled labour for certain tasks, some high-skilled workers trained in operating sophisticated equipment are also required, necessitating formal education and specialized skills development programs. Such training is resource-intensive, limiting its feasibility to larger firms with the financial capacity to invest in workforce development. However, in Canada, some of these larger firms have exited the modular construction space because the anticipated efficiency gains have failed to materialize. Without a consistent flow of orders, even large firms may struggle to sustain operations.
Depressed and volatile housing market. Canada’s housing market is marked by unpredictable boom-bust cycles and a lack of long-term stability, which discourages sustained investment. Volatility in financial markets and frequent shifts in monetary and immigration policy further heighten risks for both builders and homebuyers. Factory-built housing relies on scale and repetition to be cost-effective – firms need a steady throughput to reduce the burden of high overhead costs. However, current market instability makes it difficult to maintain consistent production. On the other hand, high development charges, land levies, and amenity fees drive up housing prices across the entire industry, further dampening affordability and demand, and in turn, restricting the supply of new homes. These also make it more difficult for innovative builders to scale up and compete effectively.
Financing and insurance challenges. Modular or prefabricated homes come with unique challenges compared to traditional houses. Since up to 80 percent of a modular project is completed off-site in a factory, manufacturers typically require substantial upfront payments to secure materials and begin production. However, current lending practices – both among private banks and public programs – are often structured around on-site progress payments. Hence, they rarely accommodate this model, significantly restricting access to financing for modular projects (Dragicevic and Riaz 2024). Additionally, in terms of mortgage and home insurance, modular and prefabricated homes often face inconsistent treatment across provinces, lenders, and insurers. Mortgage providers may require additional documentation, impose stricter conditions, or offer less favourable terms compared to traditional homes. For example, while CMHC does insure mortgages for modular homes, it requires that the home be permanently affixed to a foundation and comply with all local building codes – criteria that may be interpreted or enforced differently across municipalities. Some private mortgage insurers and lenders may impose further conditions or decline to finance certain factory-built or movable units, especially if they are not CSA-certified or permanently sited. On the home insurance side, modular homes may be subject to higher premiums or limited coverage due to perceived risks, misclassification, or unfamiliarity with the building method, sometimes even resulting in denied claims or coverage gaps.9
Financial support alone is not sufficient while structural barriers remain in place. Under the Apartment Construction Loan Program (previously known as Rental Construction Financing Initiative), all financing is subject to approval by CMHC. While there have been some improvements, the process can still take considerable time and needs to be streamlined. There are examples of firms exiting the Canadian market and shifting operations to the US, citing delays in CMHC fund disbursement as one of the contributing factors behind their decision.10 The same is true for the Housing Accelerator Fund, which flowed to municipalities from the federal government. While some major cities have significantly exceeded their annualized housing supply targets in terms of permits issued, others have permitted fewer units than projected under their baseline expectations.11 These challenges undermine the primary advantage of prefabrication: the ability to build faster.
Municipal permit approval is slow for all types of housing. According to the Canadian Construction Association (CCA), it also takes nearly 250 days to obtain a building permit from the municipalities or the regional authorities in Canada – three times longer than in the US – placing Canada 34th out of 35 Organisation for Economic Cooperation and Development (OECD) countries in building permit timelines. In some cities, the delays are even worse. Toronto and Hamilton take approximately 25 and 31 months, respectively, to issue permits (CHBA 2025). Municipal process delays during construction can also eliminate all time advantages of off-site construction and drive up costs.
Inconsistency among municipalities in interpreting building codes. A major challenge for scaling up is that different municipalities, sometimes in the same province, interpret the building codes in different ways, requiring time-consuming and costly customized designs. The same can be true within one municipality, with variable interpretations between building officials. This dramatically impacts repeatability and replication that could make the process faster and more cost-effective for builders, and cheaper for homebuyers.
Transportation-related hurdles. Transportation is another challenge in off-site construction, particularly for modular systems, which face strict road permitting requirements that vary by jurisdiction. While flat packing is efficient for panels and CLT, modular transport is more complex, especially across provinces. For example, module widths allowed in the Prairies can reach 7.3 metres, while in BC, they are limited to 4.88 metres, creating constraints for project delivery (Forestry Innovation Investment 2021). Similar constraints apply to transportation entering Ontario. These differences further hinder the feasibility of large-scale, duplicated production.
Duplicative inspections create inefficiencies and difficulties, as two authorities are involved – CSA-certified bodies inspect factory-built components, while local Authorities Having Jurisdiction (AHJs) handle on-site work (Forestry Innovation Investment 2021). However, many AHJs lack familiarity with off-site construction and are often unclear about their jurisdiction and the acceptability of the off-site components that should not be subjected to duplicative inspections. This confusion can delay approvals, drive up costs, and create barriers for modular and panelized projects.
Regulatory inefficiencies push firms out of Canada. For example, in 2024, a large modular construction company closed its Kitchener, Ontario factory, cutting 150 jobs. Citing overregulation, financing delays, and rising costs, the company moved operations to the US, where it found a more business-friendly environment.
Policy Pathways and Conclusions
Cost competitiveness and investment risk remain the two most pressing barriers to scaling innovative home-building technologies. According to Keynes’ law, the market will naturally shift toward innovative home-building technologies when sufficient demand exists, and the supply side is prepared to meet it within a business-friendly environment. However, this is not currently the case in Canada, as both demand and supply are constrained by structural inefficiencies, financing gaps, and regulatory hurdles. The goal should not be to restrict these technologies to publicly subsidized, affordable rental projects, but to encourage their widespread use in the regular market. This would enable large-scale production to reduce per-unit costs through economies of scale, achieve more competitive pricing and improve affordability.
To mitigate the challenges and to encourage more innovative home-building projects, the following policy actions and further research should be considered:
The federal government – and other levels of government providing financial support – should work to minimize structural barriers, such as bureaucratic complexities and delays in fund disbursement, across all housing projects. This will accelerate delivery and reduce costs, complementing broader housing goals. While all housing supply efforts deserve timely support, streamlining financing processes for innovative home-building approaches – such as modular and prefabricated construction – will help unlock productivity gains and build capacity in this developing segment of the industry.
To encourage builders to invest in innovative construction, the federal government should provide low-cost financing and investment tax credits. This would help them address high upfront costs and de-risk substantial investments in tools, machinery, and workforce training. Additionally, adopting output-based repayment models – rather than time-based – can help firms remain viable during housing market downturns.
Federal funding can help accelerate the transition to factory-built homes through targeted programming. For instance, the CHBA is advocating for Contribution Agreement Funding to establish a Factory-Built Systems Hub.12 The Hub would offer education and training for builders and officials, help address regulatory barriers, foster innovation in factory-built construction, and provide a concierge service to assist with access to government transition funding.
To boost traditional financial institutions’ confidence in financing off-site construction, CMHC should introduce construction financing insurance tailored to modular and prefabricated housing. While this insurance may add some initial cost, it would help address lender uncertainty and reduce risk premiums –improving affordability for buyers and predictability for builders. A key barrier is that financial institutions currently lack sufficient data to confidently compare off-site construction with traditional methods. This would provide the assurance needed to support lending for a relatively unfamiliar building process. This extra layer of security can be gradually reduced as lenders become more comfortable with these projects.
The federal and provincial governments should standardize the rules and eligibility requirements for mortgages and home insurance for these types of homes to eliminate regulatory uncertainty for buyers. Income tax credits for the maintenance and repair of these homes could build trust among potential buyers, lenders, and insurance companies.
Standardizing – and where possible, harmonizing – transportation requirements across provinces is crucial for the factory-built industry. Consistent regulations would enable cost and time savings by allowing the replication of identical units without the need for costly customization or delays due to jurisdictional differences.
Overall, development charges and related fees should be reduced to improve housing affordability and stimulate construction activity. A more dynamic housing market will enable the industry to benefit from economies of scale.
Municipalities should adopt a standardized interpretation of building codes to maintain consistency. Without this, efforts to develop a housing design catalogue for the industry will have limited value. Indeed, with standardization, existing housing catalogues that builders already have could be deployed easily.
Eliminating duplicative inspections would greatly streamline the construction process and avoid unnecessary costs and delays. Additionally, municipal officials need more training and education to increase their familiarity with off-site building methods and where inspection responsibilities lie.
All municipalities and local authorities should publicly announce clear target timeframes for residential permit approvals, inspection processes, and all municipal approval processes. The goal: to accelerate housing construction and provide much more certainty for development timelines for industry. They should introduce a fast-track permit approval system for residential construction projects utilizing innovative technologies. Time savings and productivity improvements offered by innovative construction methods will not be realized if delays and lengthy administrative procedures persist.
Further research is needed to benchmark Canada’s regulatory environment against peer countries and assess whether overregulation may be discouraging investment or prompting firms to relocate to more business-friendly jurisdictions. This includes studying how countries like Sweden have successfully scaled housing innovations – such as modular construction, off-site manufacturing, and mass timber – and evaluating which aspects of their experience could inform Canadian policy. While a full exploration of these international comparisons is beyond the scope of this paper, it remains a critical area for future investigation.
While some policy recommendations apply broadly to improving overall housing supply, they are essential for creating the enabling conditions that allow modular and prefabricated projects to thrive. At the same time, targeted and preferential measures specifically supporting innovative home-building technologies are also necessary to overcome their unique challenges and accelerate their adoption. Although not a panacea to the ongoing housing crisis, wider adoption of these technologies has the potential to ease pressure in the short term by accelerating construction and to improve affordability in the long term through greater efficiency and scalability. For the Silo, Tasnim Fariha Senior Policy Analyst at the C.D. Howe Institute.
The author extends gratitude to Colin Busby, Nicholas Dahir, Parisa Mahboubi, Carolyn Whitzman and several anonymous referees for valuable comments and suggestions. The author retains responsibility for any errors and the views expressed.
Canadian Home Builders’ Association. 2024. Sector Transition Strategy. Ottawa: Canadian Home Builders’ Association. February 8. https://www.chba.ca/sectortransition/.
Hořínková, Dita. 2021. “Advantages and Disadvantages of Modular Construction, Including Environmental Impacts.” IOP Conference Series: Materials Science and Engineering 1203 (3): 032002. https://doi.org/10.1088/1757-899X/1203/3/032002.
Lauster, Nathanael, and Jens von Bergmann. 2025. “The New Rules: Housing Shortage as an Explanation for Family and Household Change across Large Metro Areas in Canada, 1981–2021.” The History of the Family. February: 1–30. https://doi.org/10.1080/1081602X.2024.2448986.
Patel, Jainil, and Vinayak Kaushal. 2024. “Comparative Review Study of Modular Construction with Traditional On-Site Construction.” Preprints. June. https://doi.org/10.20944/preprints202406.0301.v1.
Ross, Andrew G., Peter G. McGregor, and J. Kim Swales. 2024. “Labour Market Dynamics in the Era of Technological Advancements: The System-Wide Impacts of Labour Augmenting Technological Change.” Technology in Society 77: 102539. https://doi.org/10.1016/j.techsoc.2024.102539.
The Fiscal Update the Government Should Have Produced and the Budget Canada Needs
by William B.P. Robson, Don Drummond and Alexandre Laurin
Introduction: No Budget, No Plan
The federal government has said it will not release a budget until the fall. Delaying a budget until the fiscal year is more than half over is never good, but Canada’s current high spending trajectory makes this delay especially bad. The government is making costly commitments without showing us the key numbers: how much more tax it expects to collect; how far its new spending will exceed its revenues; and what the resulting higher deficits imply for interest costs and our debt burden.
To fill in at least some of the information the government should be providing, we present our own fiscal update: the outlook that provides a context for the next federal budget. We then discuss possible measures the next budget could contain to address runaway spending, perpetually high deficits and debt, and vulnerabilities Canada should avoid at a time of severe economic challenge.
A Deteriorating Fiscal Outlook
To calculate the federal government’s bottom line in the current fiscal year, 2025/26, and the three following years, we followed the steps summarized in Table 1 (on page 3):
We started with the Liberal Party’s costing document for its election platform (Liberal Party of Canada 2025). Based on a March 2025 economic scenario from the Parliamentary Budget Office (PBO), it did not reflect the impact of US tariffs or Canada’s countermeasures (PBO 2025).
We updated the economic assumptions based on the Bank of Canada’s April 2025 Monetary Policy Report, using the more optimistic of the two scenarios examined by the Bank, both regarding the severity of tariffs and resulting economic damage (Bank of Canada 2025).
We calculated a revised baseline fiscal projection by including policy initiatives that appear firm – either because of definitive statements, such as the cancellation of the proposed changes to capital gains taxation and the June 2025 plans to first accelerate defence spending to 2 percent of GDP and then gradually increase it to 5 percent by 2035, or because legislation is currently before Parliament, as is the case for cuts to the bottom personal income tax rate, the GST break for first-time homebuyers under Bill C-4,1 and the government’s announcement that it will not proceed with the digital services tax (DST).
We added the spending measures from the Liberal platform’s costing document that were not included in the previous step.
We added platform proposals for increasing revenue from higher fines and penalties and, more significantly, for reducing spending through a review of public sector operations to boost productivity. We show these as a memo item, since the lack of concern about the bottom line evident in the platform and subsequent announcements, and the lack of urgency evident in the government’s decision to delay the budget, makes it reasonable to doubt that these savings will materialize.
The resulting bottom line represents a marked deterioration, as Table 1 shows. As recently as the April 2024 budget, the government projected the deficit to decline to $20 billion by 2028/29.2 With this baseline, and even if the imagined fines and savings were realized in full, the deficit that year would be more than three times that level. Even in this optimistic scenario, the deficit would average $78 billion annually over the four years, and the net debt-to-GDP ratio would remain stable around the elevated level of 2025/26. Excluding the speculative savings, the cumulative deficit would be almost $350 billion over four years – or an annual average of $86 billion – and the net debt-to-GDP ratio would increase to 44 percent. Further, the baseline deficit without any of the non-implemented initiatives in the electoral platform is still elevated at $66 billion per year on average.
These projections include our estimates of the potential impact of the new defence spending commitments made at the recent NATO summit. At that summit in The Hague, Canada joined a pledge to raise defence and security-related spending to 5 percent of GDP by 2035 (3.5 percent for direct military needs and 1.5 percent for security-related investments).
No details on the year-to-year increases have been announced, but countries are expected to submit multi-year roadmaps by mid-2026. Prime Minister Mark Carney also indicated that some of the 1.5 percent for security-related investments – such as critical mineral infrastructure, ports, telecommunications, and cyber – could be counted from existing budget envelopes.
In Table 2, we present a hypothetical scenario where annual defence spending rises gradually from 2 percent of GDP to 5 percent of GDP over 10 years, with half of the spending allocated to depreciable capital assets. Under this scenario, we estimate the increase would add $2.3 billion to the deficit this fiscal year, rising to $11.8 billion in four years. Assuming half of the new spending on security-related investments comes from existing envelopes, the deficit would be $17.8 billion higher in four years. These amounts continue to grow over the 10-year period as the 5 percent target approaches and the stock of amortized capital outlays increases. By year 10, new defence commitments could add a staggering $68.4 billion to the deficit under this scenario.
Separating Operating and Capital Spending is Unhelpful
The large deficits projected in this update cannot be downplayed or disguised by dividing the budget into two new categories – operating and capital – and targeting a balanced operating budget only, as proposed in the election platform. No firm details have been released about what each category will include, but logically, the operating budget will consist of whatever does not fall under the new capital category.
The rationale for introducing a capital budget is unclear. Under Public Sector Accounting Standards, the federal government, like all Canadian governments, uses accrual accounting. So its capital costs are amortized over the useful life of the assets. As a result, the government’s Statement of Operations already shows costs related to capital investments: depreciation (about $7 billion per year) and interest on debt incurred when the outlays occur. As more capital assets are added – such as ports or defence equipment – amortization expenses will rise. But amortization reflects the current consumption of capital assets and should remain part of the bottom line. Excluding it would disconnect the federal budget presentation from the audited financial statements – a serious blow to transparency and accountability.
More troubling is the pledge to recharacterize as capital spending “new incentives that support the formation of private sector capital (e.g., patents, plants, and technology) or which meaningfully raise private sector productivity” (Liberal Party of Canada 2025). Governments like to call many categories of spending “investment.” Would the new classification mean the government would exclude subsidies for housing construction or incentives for first-time homebuyers from the bottom-line target? Would it reclassify other subsidies – for clean technology, artificial intelligence, or training programs, for example – as capital? What qualifies as capital under this framework appears open to subjective interpretation, undermining accountability. Without clear standards audited by independent sources, this approach is ripe for abuse.
And for what purpose? The government appears intent on showcasing how much it is doing for growth. But this does not require a new accounting convention. Their efforts could be highlighted through words and dedicated tables – not by altering the definition of the bottom line.
What Canada Needs in the Next Federal Budget
Notwithstanding rhetoric about transforming Canada’s economy in the face of US trade threats and prioritizing growth, federal fiscal policy and promises do not support the transformation of Canada’s trade relations or promote investment over consumption. Adding $300 billion in federal debt while doing nothing to raise investment and productivity will make Canada more vulnerable, not less. The new 5-percent defence commitment, even if its fiscal impact will be felt mostly in the later years, further highlights the need for difficult tax and spending trade-offs. Given the scale of the new defence commitment, on top of the fiscal challenges created by the old one, it is all the more important for the government to ensure proper accountability.
For that reason, the next federal budget – which should come as soon as possible – should have the following features:
Dropping more costly platform initiatives. Recent developments, including diminished US support for environmental action and related impacts on Canada, suggest that some potential spending items may cost less or be delayed. Still, it seems surreal to contemplate introducing another $28.3 billion in deficit-increasing platform measures this fiscal year, when the projected deficit would already be close to $60 billion. One of the more straightforward options for the government in the 2025 budget is to forgo implementing some of its platform commitments or fund them through existing envelopes. The list is extensive. For example, the platform proposes to allocate over $10 billion to various infrastructure transfer funds, including nation-building initiatives, trade corridors, digital infrastructure, rural transit, critical healthcare, and community development. In addition, more than 64 small-scale platform measures, each costing under $200 million, collectively amount to over $3.1 billion. These areas clearly present opportunities for reallocation or funding within existing envelopes.
Finding deeper savings from existing operating spending. The C.D. Howe Institute’s 2025 Shadow Budget contemplates $97 billion in non-defence direct program expense savings over the budget horizon (Robson, Drummond, and Laurin 2025). Such savings are possible, but not achievable without strong leadership from the very top.
Rely more on less damaging taxes. Canada’s personal income tax rates are already high – the top rate is over 50 percent in most provinces – and our corporate income taxes are uncompetitive, undermining the investment we need to become more productive and raise workers’ wages. Those rates should come down: if the federal government is determined to fund spending that requires higher revenues, the least damaging option is to raise the GST rate, as proposed in the Institute’s Shadow Budget.
Cut federal transfers to provinces and territories. The Institute’s latest Shadow Budget also proposed cuts to transfers that fund programs that are not in the federal government’s jurisdiction (Robson, Drummond, and Laurin 2025). Provinces and territories would not welcome such a move – indeed, many might raise their own consumption taxes in response – but deficit-financed federal transfers are less consistent with fiscal sustainability and accountability than tax-financed ones, and the Canadian federation will be healthier if provinces and territories become more fiscally self-sufficient.
The Need for Clarity and Serious Choices
It is widely accepted that Canada’s economy is at a critical crossroads. So are Canada’s public finances. Beyond the economic drag of high deficits and rising debt, it is unfair to pass these burdens onto the current young and future generations.
The fact that the 2025/26 Main Estimates are before Parliament does not mean that the government has made itself accountable to the legislature for its fiscal plans.3 The Estimates support the appropriation bills through which Parliament authorizes funding for program spending not already provided for in existing legislation. They exclude any forward-looking policy initiatives typically included in a budget. They omit revenues and only account for a subset of expenses. They are prepared on a different basis of accounting than regular budgets and financial statements, making direct comparisons difficult. And they cover only a single fiscal year, making it impossible to assess the medium-term outlook.
The federal government itself should release full economic and fiscal projections to enable a proper national debate. But in their absence, this informal update will have to suffice.
Canada is on a troubling path. We need Parliament and the public to discuss the best way forward – economically and fiscally. The next federal budget should launch us on that path.
The authors extend gratitude to Colin Busby, Jamie Golombek, John Lester, Daniel Schwanen, and several anonymous referees for valuable comments and suggestions. The authors retain responsibility for any errors and the views expressed.
This article courtesy of our friends at www.cdhowe.org The Fiscal Update the Government Should Have Produced and the Budget Canada Needs for The Silo by William B.P. Robson, Don Drummond and Alexandre Laurin.
Canada is great at AI development, but what should the country’s first Minister for Artificial Intelligence make his key priorities? University of Waterloo’s Anindya Sen and the C.D Howe Institute’s Rosalie Wyonch offer strong insight — and geek out a bit about the economics-oriented nature of machine learning algorithms.
May, 2025 – Canada cannot rely on immigration alone to address the challenges posed by its ageing population and relentless decline in fertility rates [ see Canada’s Soaring Housing and Living Costs Stop Baby Making CP], according to a new report from our friends at the C.D. Howe Institute. Without a broader population strategy, rising immigration could fuel rapid growth while straining housing, healthcare, and infrastructure – without fully resolving rising old-age dependency ratios or labour force pressures.
In this post, Daniel Hiebert confronts an important policy dilemma: although immigration increases overall population and helps address short-term labour gaps, the long-term trade-offs are significant. Without corresponding investment and planning, rising immigration risks compounding the very pressures it aims to alleviate.
“This is a particularly opportune moment to reflect on how immigration fits into Canada’s long-term demographic strategy, especially as both permanent and temporary immigration surged between 2015 and 2024, and are now being scaled back,” says Hiebert. “We need to think ahead about what kind of future we are building — and how we get there.”
Based on current patterns, it takes five new immigrants to add just one net new worker, once dependents and added consumer demand are factored in — a reality that undermines assumptions about immigration as a direct fix for labour shortages.
Hiebert argues that Canada must move beyond short-term immigration planning and adopt a long-range population strategy — one that combines immigration with other tools like delayed retirement, increased workforce participation, and stronger productivity growth. The alternative, he warns, is a “population trap”: a scenario where growth outpaces the country’s capacity to support it, undercutting prosperity in the process.
The report also calls on governments to coordinate immigration levels with long-term planning in housing, healthcare, education, and infrastructure.
“There’s no question that immigration is integral to Canada’s future,” says Hiebert. “But assuming it can carry the load alone ignores the structural pressures we’re facing — and the investments we need to make today to ensure future stability.”
Balancing Canada’s Population Growth and Ageing Through Immigration Policy
Canada faces twin demographic pressures: an ageing population and rapid population growth driven by immigration. The report argues that immigration levels must strike a careful balance – sufficient to offset some effects of low fertility and an ageing workforce, but not so high as to outpace infrastructure and economic capacity.
A sustainable population strategy requires coordinated planning across immigration, infrastructure, workforce participation, and capital investment. The report calls for long-term planning that aligns immigration policy with economic and social goals and emphasizes the need to manage absorptive capacity to avoid overburdening housing, healthcare, and public services.
Introduction
Declining fertility is a global trend and is especially pronounced in countries with high levels of economic development. These countries share the common challenge of ageing populations, with rising old-age dependency ratios (OADRs)1 and a shrinking portion of the population in prime working age. Several policy responses have been established to deal with this emerging reality, including pronatalist and other family-based social programs, efforts to enhance automation and productivity, incentivization of a larger proportion of the population to enter the formal labour force, delaying retirement benefits, and increasing the rate of immigration. The success of these approaches has varied, raising critical questions for policymakers: which strategies are the most efficient? What are their costs? And which policies offer the best balance between risk and reward?
This Commentary explores the potential role and limitations of immigration in alleviating Canada’s challenges of low fertility and ageing. This is a particularly opportune moment to consider such an issue given that both permanent and temporary immigration strongly increased between 2015 and 2024 and will be reduced for the 2025 to 2027 period.
Using custom demographic projections, this paper examines how various immigration scenarios – ranging from historical rates to the peak of 2024 – will affect Canada’s demographic outlook over the next 50 years. The analysis investigates the role immigration could play in mitigating the effects of an ageing population, while also acknowledging the associated trade-offs, including pressures on infrastructure and rapid population growth. The findings highlight that Canada’s immigration policy, while important, should be framed within a long-term population strategy that aligns immigration policy with broader economic and social goals – including capital investment, productivity, delayed retirement, and expanded social infrastructure – to ensure sustainable growth and enhanced prosperity for all Canadians.
Canada’s Demographic Challenge and Recent Immigration Policy Responses
Canada’s current demographic challenge is the product of two primary factors: low fertility and the ageing and retirement of the Baby Boom generation. Canada’s fertility rate first rapidly declined from the peak of the Baby Boom (1950s) to the early 1970s, when it first fell below the replacement level. Since then, it has continued with a slower, though persistent decline, interrupted by occasional slight recoveries. Most recent calculations reveal that Canada’s fertility rate is now at 1.26 – a level unprecedented in Canadian history and among the lowest globally. The consequences of low fertility are particularly pronounced today due to the ageing of the Baby Boom generation. In 2025, this cohort ranges in age from 59 to 79 years old, while the average age of retirement in Canada was 65.1 in 2023. Around two-thirds of boomers have already reached the age of 65, with the remaining third expected to follow in the coming years. The impact of this demographic shift is therefore ongoing and continues to affect the labour market and economy at large.
Throughout its history, Canada has turned to immigration to resolve demographic challenges (Hiebert 2016). From the late 1940s to the mid-1980s, Canada admitted an average of 150,000 permanent residents annually, though numbers fluctuated. By the end of that period, concerns over low fertility began to be articulated. This prompted the government to increase annual immigration levels to 250,000, a figure that was quite consistent over the following 30 years, with annual rates ranging from the low to high 200,000s. By the end of the 20th century, immigration accounted for over half of Canada’s population growth and labour force expansion.
The most recent shift in immigration policy began in late 2015 under the Liberal government, which pursued an expansionary strategy. Annual immigration targets and admission levels increased – save for the 2020 pandemic year – leading to a target of 500,000 for 2025. However, this target will no longer be realized following the revised plan announced at the end of 2024. Along with increased permanent immigration, the government had adopted a more facilitative approach to temporary migration, leading to rapid growth in the number of international students, temporary foreign workers, and other non-permanent residents. In 2023, the Canadian population expanded by 1.27 million, representing an annual growth rate of 3.2 percent, which is highly unusual among advanced economies. For example, the average population growth rate of the other G7 countries in 2023 was less than 0.5 percent (Scotiabank 2023).2
Given Canada’s low fertility, 98 percent of this growth stemmed from net immigration, both temporary and permanent (Statistics Canada 2024a). Today, Canada is approaching a point where all population growth and most of the impetus for population renewal (Dion et al. 2015) will come from immigration. However, the “big migration” trajectory of 2015 to 2024 has shifted. While public opinion historically supported ambitious immigration targets, this sentiment changed sharply in 2024. Concerns about housing shortages, infrastructure strain, and what has been termed a “population trap” – where population growth outpaces capital investment capacity – have fueled resistance to current immigration levels. These pressures clearly influenced the 2025 to 2027 plan, which curtails permanent immigration targets by approximately 20 percent and tightens restrictions on temporary migration programs.
Short- and Long-Term Immigration Policy
Before focusing on the relationship between immigration and demography, it is instructive to explore a fundamental tension in immigration policy: should the Government of Canada prioritize the “maximum social, cultural and economic benefits of immigration”3 for today or for the future? These goals may not always align: satisfying the needs of today may have long-term consequences – a trade-off familiar to anyone who has managed a budget.
It has been long underappreciated that Canada’s immigration policy is built around a combination of short- and long-term goals. Economic selection practices provide a helpful example. Since the introduction of the points system nearly 60 years ago, selection priorities have oscillated between addressing short-term labour market needs (e.g., incorporating and/or prioritizing job offers in selection criteria) and building the human capital of the future workforce, under the assumption that highly skilled individuals can adapt and drive productivity, and therefore prosperity. Striking the right balance between these priorities is challenging and requires careful planning.
The balance between short- and long-term immigration perspectives is reflected in the combination of the economic selection system and levels planning. The former – which includes permanent skilled immigration – involves trade-offs between filling immediate labour shortages and building future human capital.4 The latter determines the scale and composition of Canada’s permanent immigration system. In contrast, temporary migration programs are almost entirely shaped by short-term planning horizons – with the partial exception of the International Student Program, which operates in accordance with a medium-term planning horizon in five-year increments.5
These issues are pivotal to considerations of the relationship between immigration and demography. The impact of immigration extends beyond the number of admissions. If immigrants are selected to enhance the human capital of Canada’s workforce and integrate productively, they can potentially raise per capita GDP and mitigate the challenges of an ageing population (Erkisi 2023; Montcho et al. 2021). Conversely, if the system prioritizes lower-skilled individuals, fails to utilize the skills of highly educated immigrants, or admits newcomers at a scale that exceeds the economy’s capacity to absorb them, it risks lowering per capita GDP and compounding demographic challenges (Smith 2024).
Immigration, therefore, has both scale and compositional effects. Scale impacts include changes to population size, age structure, and regional distribution, which directly affect housing demand and social services. Compositional impacts include broader socioeconomic outcomes such as income inequality, productivity, and trade relationships. While this paper focuses on scale impacts, readers should bear these compositional effects in mind.
Another critical consideration is the relationship between admission levels and the expected economic outcome of admitted immigrants. In Canada’s Express Entry system, admission thresholds are adjusted based on the number of entries. Larger admission cohorts tend to lower the points threshold, potentially reducing the overall human capital of entrants (Mahboubi 2024).
Immigration and Canada’s Demographic Challenge
This paper argues that long-term considerations should play a larger role in immigration levels planning. Immigration decisions made today shape Canada’s demographic structure for decades, as immigrants become part of the population, contribute to fertility, enter the workforce, and eventually retire. These stages must be incorporated into demographic projections and policy planning, yet they are often overlooked due to the focus on immediate needs and political cycles.
To illustrate the long-term demographic impact of immigration, consider two extreme scenarios. In the first, Canada’s fertility rate declines to 1.0 (the 2023 rate in British Columbia) and net migration falls to zero, implying no population growth from migration. Under these conditions, Canada’s population would shrink from 40 million in 2023 to 12.3 million by 2100. In the second scenario, the extraordinary 2023 growth rate of 3.2 percent continues indefinitely, with rising migration levels. By 2100, Canada’s population would reach 452 million.
While neither of these scenarios is realistic, they illustrate the decisive influence that fertility and migration have in shaping the future scale of Canada’s population. Despite their seemingly preposterous nature, the key point remains: with fertility rates remaining low,6 the state is entirely responsible for determining the scale of the Canadian population. Decisions about temporary visas and permanent residence serve as the primary levers of control. Policymakers must recognize that the choices made today will have profound and lasting effects on Canada’s demographic and economic future.
Population Projections and Their Implications
Statistics Canada produced a recent population projection for various scenarios in January 2025, covering the period of 2024 to 2074.7 Across the scenarios, total fertility rates range from 1.13 to 1.66, permanent immigration rates vary from 0.70 to 1.2 percent per year, and net temporary migration figures are assumed to decline in the short term before stabilizing. The selected scenarios suggest that the projected population of Canada would range from 45.2 to 80.8 million in 2074 – a difference of over 35 million people, roughly equivalent to Canada’s current population. The scale of infrastructure and social investments needed to accommodate such growth would be enormous.
Beyond sheer numbers, government policy also affects the age structure of Canada’s future population. The OADR is expected to rise, and increased immigration is often proposed as a solution. However, the retirement age is, to an important extent, a social construct and this paper explores the efficiency of changing Canada’s retirement age compared with adjusting immigration levels to address the issue.
While migration can temporarily mitigate low fertility effects by maintaining a larger workforce, it cannot fully offset population ageing (Robson and Mahboubi 2018). Even doubling Canada’s population through immigration would only reduce the average age by five years, as immigrants’ average age is close to that of the receiving population (around 30 versus 40).8 Doyle et al. (2023) argue that increasing immigration could delay ageing impacts but would require continuously higher volumes, becoming unsustainable.9 Immigrants are typically concentrated in the labour force ages (25-40) but, in 30-35 years, this group will be approaching retirement, creating an economic challenge similar to the Baby Boom generation’s retirement. Unless increasing rates of immigration are in place continuously (an unrealistic scenario), at some point society must adjust to a smaller, older population.
Moreover, there appear to be additional costs to rapid population growth that are driven by high immigration. Doyle et al. (2023 and 2024) contend that when the labour force expands faster than investment in capital and infrastructure, the result is a dilution of capital per worker, reducing Canada’s productivity and living standards. This concern highlights not only the pace of immigration-driven growth but also Canada’s historically low levels of business and infrastructure investment, suggesting a need to boost investment alongside population growth.10
Research shows that while larger immigration targets increase real GDP through a larger labour supply, they could also reduce GDP per capita (El-Assal and Fields 2018).11 Indeed, in recent years of very high population growth through net international migration (2022-2023), Canada’s level of real GDP per capita has been stagnant.12
Furthermore, house price escalation associated with a surge in demand may negatively affect fertility decisions, particularly for families renting homes (Dettling and Kearney 2014; Fazio et al. 2024). In other words, compensating for low fertility through high rates of immigration may indirectly contribute to additional fertility decline.
Studies show that immigration alone has a limited impact on altering age composition (Robson and Mahboubi 2018). Even doubling immigration rates would only slightly improve the OADR (Beaujot 2001). All of the immigrants admitted by Canada between 1951 and 2001, for example, are believed to have reduced the median age of Canadians in 2001 by only 0.8 years.
The effect of younger immigrants, as seen in Australia’s approach, would improve outcomes,13 but Guillemette and Robson (2006) found that this impact would still be modest. An unintended consequence of focusing on younger immigrants is that it contrasts with Canada’s economic selection system, which rewards human capital development. Half of the 2022 Express Entry applicants were 30 or older (IRCC 2022), challenging the idea that immigration could rapidly reduce the average age of the population.14
A Custom Glimpse of the Future
To update our understanding of the role immigration could play in Canada’s demography, this section explores the results of a special population projection, using Statistics Canada’s microsimulation model called Demosim, to assess the impact of varying immigration rates on the Canadian population in the future. Two demographic outcomes are highlighted in this analysis: population size and the OADR.
While population size is a straightforward measure, the exclusive focus on the OADR – without also considering the youth dependency ratio (YDR) – may raise questions about the completeness of the analysis. After all, both young and older people place disproportionate demands on social services. One could also argue that increasing the rate of immigration (depending on the age profile of newcomers, other things being equal) could reduce the OADR while increasing the YDR. There are two major reasons for focusing on the OADR in this analysis. First, it is the most widely used indicator of the ageing population and has particularly profound impacts on the cost of healthcare, Canada’s most expensive social program.15 Second, while the YDR and OADR reflect dependency burdens, they have very different long-term implications: a high YDR represents a short-term fiscal cost but also an investment in the future workforce. In contrast, a rising OADR signals a more permanent shift in the age structure of the population, with fewer economic offsets. For these reasons, and to maintain analytical clarity and focus, the YDR has been omitted from this analysis.
Demographic variables used in the projection, except for the immigration rate, were either held constant (e.g., fertility rate at the 2023 level of 1.33 and the temporary resident population assumed to remain constant at around two million after 2021) or based on assumptions from recent Statistics Canada projections (e.g., emigration rate, life expectancy).16 Using the 2021 base population,17 projections were provided for 50 years. Six scenarios were created based on annual permanent immigration rates ranging from 0.3 percent to 1.8 percent. These correspond to immigration levels in 2025 between around 125,000 and 750,000, based on the 2024 Q4 population estimate of 41.5 million. From 2000 to 2015, the immigration rate averaged 0.6 percent per year (Scenario 2), rising to nearly 1.2 percent per year by 2024 (Scenario 4). The 2025-2027 immigration plan aligns with Scenario 3, at a rate of around 0.9 percent. In essence, the scenarios reflect both current and recent immigration rates, allowing for expansion or contraction, as shown in Table 1.
Population projections vary significantly across the scenarios (Figure 1). As Canada’s natural population growth is rapidly approaching zero and is expected to turn negative in the coming years – and with emigration remaining steady – an immigration rate of 0.3 percent of the population would result in virtually no net international migration. Under this scenario, the population would begin to decline slightly. At the same time, Canada’s OADR would more than double, rising from 29.5 retirees (65 and older) per 100 working-age individuals (18-64) to 48.2 in 2046 and 61.6 in 2071 (Figure 2).18 Such a demographic structure would be unprecedented and pose a significant challenge to economic prosperity. For context, Japan currently has the highest OADR globally, at approximately 48 per 100.19
The second scenario, reflecting Canada’s immigration levels from 2000 to 2015, would add 4.6 million to the population by 2046 and another two million by 2071. The OADR would rise to 44.5 by 2046 and 55.8 in 2071. The third scenario most closely aligns with the 2025 to 2027 immigration plan (though it excludes the projected reduction in temporary residents). If immigration remains at 0.9 percent of the population for the next 50 years, the national population would reach 55.6 million in 2071, and the OADR would be 50.8. The fourth scenario extends the higher 1.2 percent immigration rate from 2024, projecting a population of 67.2 million by 2071. Despite this growth, the OADR would still rise to 46.5 by 2071 – similar to Japan’s current level. Reducing the immigration target from 1.2 percent to 0.9 percent in the 2025-27 plan would result in 11.6 million fewer people by 2071, assuming a stable rate. The sixth scenario, though ambitious, is instructive. If IRCC raised the permanent immigration target to 1.8 percent annually and maintained it for 50 years, Canada’s population would increase to nearly 62 million by 2046 and exceed 91 million by 2071. Even with this growth, the OADR would still rise to 39.5 by 2071. A visual scan of the relevant figure suggests that it would take an immigration rate of around 2.7 percent per year to hold the dependency ratio constant. Moreover, it would be challenging to sustain Canada’s high-human-capital selection threshold in the Express Entry system under this scenario.
Note another important trend. Figure 1 shows that the population diverges across the six scenarios over time, demonstrating the growing efficiency of immigration rates in changing Canada’s population growth over time. In contrast, the OADRs across the scenarios in Figure 2 remain roughly parallel after 2046 and begin to converge a little in the later years, illustrating that immigration ultimately becomes less efficient at altering the age structure of the population over time. Why? A population with low fertility receiving a steady flow of younger immigrants will, in the short term, have a younger average age due to the immigrants’ youth. However, as the immigrant population ages, its average age eventually surpasses that of the receiving population, making the overall population older in the long term.20 Therefore, the effect of steady immigration on the age structure diminishes over time, and only a continuous increase in immigration would prevent this.
Further, it is also important to acknowledge that once there is a sustained period of high immigration (i.e., the case of Canada between 2015 and 2024), a dramatic reduction in the rate of immigration will result in a demographic “bulge” with a large cohort followed immediately by a smaller one – akin to the relationship between the Baby Boom and Generation X. This would ultimately set in motion the same demographic dynamic that Canada faces today, with the larger generation eventually retiring and the OADR increasing. The demographic lesson is clear: shocks in the age structure of a population – whether through dramatic increases or declines in fertility or through major changes in the rate of net migration – place stress on infrastructure and, if they are large, may challenge the long-term stability of the welfare state.
Before reflecting further on these findings, consider the impact of varied immigration rates on the cultural composition of the Canadian population (Vézina et al. 2024). In 2021, approximately 44 percent of the Canadian population had an immigrant background – either as non-permanent residents, immigrants, or individuals with at least one immigrant parent (see Table 2). Under the third scenario, which aligns with the 2025 to 2027 immigration plan, this proportion would nearly reverse by 2046 and change even more dramatically by 2071, with nearly two-thirds of all Canadians being persons with an immigrant background.21
Such a shift would redefine immigrant integration and public perceptions of multiculturalism. Whether this level of cultural change would be widely accepted remains uncertain. If the high 2024 immigration rate was sustained, nearly three-quarters of Canadians in 2071 would be either immigrants or children of immigrants.
Immigration and Other Policy Levers in Addressing Population Ageing
This section assesses how immigration compares to other policy tools in addressing the demographic challenges of an ageing population. Governments have several policy tools to either shape demography directly or mitigate societal consequences. The key concern in an ageing society is the impact of a shrinking labour force on the ability to sustain social services such as healthcare, education, and pensions. The principal direct policies are encouraging fertility and increasing immigration (Lee 2014). Governments can also address the fiscal impact of ageing by: boosting workforce participation among working-age adults; delaying retirement and enlarging the working-age population; raising tax rates; reducing expenditures – especially those related to the elderly population; and increasing the productivity of labour (Lee et al. 2014; Beaujot 2017). Some of these choices are more efficient than others. Pronatalist policies have been established in some 60 countries, yet none have been successful in restoring fertility to a replacement level (UNFPA 2019). Moreover, their effects tend to be short-lived.22
How efficient is immigration in mitigating population ageing and its effects? The data explored so far indicate that while increasing the rate of immigration is highly effective at generating population growth, it is less effective at significantly changing the age composition of the population. A recent analysis by British Columbia Ministry of Advanced Education and Skills Training provides additional depth on this issue.23 Their study presents a simple but informative labour force participation ratio: for every 10 permanent immigrants admitted to the province, six will find work relatively quickly, while the remaining four will be too young or old, pursuing education, or not immediately ready to join the labour market. This reflects the broader reality that approximately half of all economic-class immigrants are spouses and dependents and that only around 60 percent of immigrants are admitted through the economic class to begin with.
It would be tempting, but also simplistic, to see this as the direct impact of immigration on the labour force (i.e., 10 newcomers equate to six net new workers), but there is an important additional dimension that must be considered. Adding 10 people to the population generates consumer demand for goods and services including shelter, food, transportation, and many other things. Meeting this demand requires four additional workers. These four additional workers expand the scale of the economy but do not create net new workers (Fortin 2025).
When 10 newcomers are admitted, given that four will not immediately enter the labour force and another four workers will be required to satisfy extra consumer demand, only two net new workers are added. That is, to add one net new worker to the labour force requires five new permanent immigrants (and therefore approximately two additional dwellings). This is nicely summarized in a ratio: 10-6-4-2. There is no reason to expect that this ratio would be appreciably different in other provinces or Canada as a whole. Just as immigration is more efficient at increasing the size of the population than it is at changing the age structure, the same holds true for the relationship between immigration and net workers added to the labour force.
An example can help illustrate this point. Imagine an ageing society with a population of one million and 1,000 doctors. As more doctors retire than can be replaced through domestic training, the government looks to immigration to fill the gap. It estimates that 100,000 newcomers must be admitted, since only a small fraction of new immigrants will be doctors. This produces the desired effect, and the number of doctors remains stable. However, the population has grown to 1.1 million, and to preserve the same level of access to care, 1,100 doctors are now required. Simply stabilizing the labour force while adding population is an insufficient way to resolve emerging labour shortages because it ignores the additional demand created by population growth (Fortin 2025). This mirrors the earlier point: immigration adds workers, but it also adds consumers. As a result, the net gain to the labour force is much smaller than the headline number of newcomers might suggest.
It is beyond the scope of this paper to investigate the efficiency of all the other measures in mitigating the effects of ageing or increasing the size of the labour force. However, Figure 3 illustrates the demographic impact of one such lever – delaying the average retirement age to 70, compared to maintaining it at 65 – as an example to demonstrate how different policies vary in their ability to influence the OADR.
Figure 3 shows that, under this policy shift, maintaining immigration at the rate of the 2025 to 2027 plan (Scenario 3) would be sufficient to stabilize the OADR to 2046 – keeping it just below 30, similar to its level in 2021. None of the immigration scenarios alone achieve this outcome if the retirement age stays at 65. While the OADR increases over time in all scenarios, delaying retirement significantly slows both the pace and magnitude of this rise.24 However, the purpose of this example is not to propose a specific change. Instead, it highlights the relative effectiveness of this particular lever and emphasizes the need for a multifaceted strategy to address demographic challenges.
In summary, Canada’s demographic challenges stem from low fertility and the retirement of the Baby Boom generation. Immigration can delay and mitigate the effects of ageing but cannot fully counteract them without immediate and dramatic increases. As long as immigration remains within historical levels, ensuring a sufficient workforce will require a combination of immigration and complementary policies.25
Demography and Levels Planning
The policy dilemma implied by demographic realities is both straightforward and immensely complex: it is now impossible to maintain the age composition of the Canadian population while also maintaining its size without turning back the clock more than 50 years in terms of fertility. At the extremes, there are two stark policy choices: maintain the current size of the Canadian population but adjust expectations to accommodate a vastly higher OADR (approximately that of Scenario 1); or maintain the age structure of the Canadian population and plan for a vastly larger population (larger than any projected in the scenarios used in this study). The real policy choice will lie somewhere between these extremes and will require a combination of accommodations.
Table 3 summarizes more realistic options by showing the level of population increase and the different OADRs projected for 25 and 50 years forward. It compares the scenarios that most closely approximate Canada’s permanent immigration targets for the recent past – Scenario 2 (pre-2015 consensus), Scenario 4 (2024 rate), and Scenario 3 (2025 to 2027 plan). Had the Liberal government maintained the earlier rate of immigration after 2015 (that is, maintaining the 0.6 percent rate of immigration), Canada’s population would have grown by around 7.5 million by 2071, but with an OADR higher than any country today (55.8 senior citizens per 100 working-age people). By shifting to, and maintaining, a 1.2 percent annual immigration rate between 2015 and 2024, the population would grow much faster – by 29 million more people over half a century – while the OADR would be lower, at 46.5 per 100. Notice that the change in policy would lead to nearly four times the population growth compared to the reduction in the OADR, which improves by only 17 percent. Scaling back the rate of permanent immigration in 2025 to 2027 moderates both the population increase and the OADR improvement. Nevertheless, it would still yield a population growth of over 17 million in the next 50 years, with Canada’s OADR surpassing that of contemporary Japan.
Regardless of the choice being made, Canada will be both larger and older in the coming decades. This shift has significant implications and calls for strategic long-term planning. For example, the country will need to invest simultaneously in child benefits and new schools, as well as in elder care facilities. Housing demand will continue to mount unless significant changes occur in housing investment policies and outcomes. It also means investing in infrastructure to sustain key public services – such as increasing hospital capacity and expanding public transit. Without these adjustments, the quality of life for Canadians would decline. Crucially, this must occur while public finances are adjusted in light of a rising OADR (or the retirement age is raised).26 It also necessitates a continuing cultural diversification of the population through immigration and temporary migration. Ongoing and growing investments in social inclusion will be required.
The greatest challenge for government is to decide on the optimum balance between ageing and growth while securing public buy-in for immigration policies.27 All of this must occur against the backdrop of other pressing issues such as global climate change, geopolitical instability, technological change, and political polarization – not to mention the need to be mindful of the relationship between immigration, ethnocultural diversity, linguistic and religious groups, Indigenous Peoples, and other equity-seeking groups. Assiduous attention must be paid to Canada’s demographic challenge, despite these powerful intersecting concerns.
Consider financial investment, where growth is based on compounded rates of interest. One of the most common recommendations made by financial advisors is to harness the power of compounded growth by starting to invest early in one’s life. Even small amounts invested in one’s twenties can pay remarkable dividends forty years later. The same logic applies to population management; demographic choices today will have far-reaching consequences in subsequent decades. Adding four to five million to Canada’s population over the next decade cannot simply be undone at the end of that period. The same ageing pressures will remain, but with a larger population that may require even higher immigration levels. As long as fertility remains well below replacement, this issue will persist – regardless of Canada’s population size. There will always be the looming threat of population decline and its consequences.
Short and Long Policy Horizons
Population change is cumulative and difficult to reverse, making it imperative to consider the long-term implications of both temporary and permanent immigration together. This requires viewing them as components of the same system – particularly given the many pathways that allow temporary residents to transition to permanent status, and the increasing reliance on temporary residents within Canada’s permanent immigration system (Crossman et al. 2020). In recent years, temporary migration has increasingly become a kind of “down payment” to Canada’s permanent immigration system, a shift that has transformed Canada’s immigration system into a more fluid, two-step process, although this flow-through process may be interrupted given the latest levels plan (i.e., there is a large gap between the number of temporary residents in Canada and the “room” accorded to that population in the new plan). A comprehensive approach also demands that levels plans, which currently establish expectations for a three-year period, be developed with longer time horizons in mind.28 In other words, immigration levels should reflect Canada’s immediate priorities as well as its long-term goals, including the potential for future population renewal. The focus on present needs should not overshadow a forward-looking vision for the country, as current policies play a decisive role in shaping Canada’s future.29
A common point made in public discussion of Canadian immigration policy is that levels planning should pay more attention to absorptive capacity. This means aligning the number of both temporary and permanent residents with the growth of social services – notably education and healthcare – as well as housing and other infrastructure. The concept of absorptive capacity can be interpreted in passive or active terms. Under a passive approach, levels planning would be guided by the current state of social services and infrastructure including housing, which would determine the appropriate level of immigration (e.g., based on an acceptable range of physicians, housing completions, etc., per 1,000 persons). Conversely, an active approach would flip the direction of causality and establish the parameters of social spending and infrastructural investment based on population growth which, in an era of low fertility, is essentially a function of the scale of temporary and permanent immigration. In this latter situation, IRCC would play a more central role in national planning, as immigration targets would shape the long-term scale of government spending across a wide range of responsibilities. This process would be greatly facilitated by a conscious, long-term population strategy at the heart of levels planning. In such a framework, all sectors of society – government, private business, and non-profit social services – could make informed decisions to guide their investments with far more assurance of long-term patterns of demand. This would be a potent indirect benefit of a population-based approach to migration and immigration management.
There are important tradeoffs between these approaches. A passive approach may be more cautious and politically feasible in the short term, but risks underestimating long-term needs and perpetuating reactive policymaking. An active approach, by contrast, allows for proactive investment and planning – but only if there is full follow-through. If governments commit to population growth targets without ensuring that social and physical infrastructure keep pace, the result could be increased strain on housing, healthcare, and public trust.
While this paper supports an active approach, its core aim is to push for long-term thinking and to encourage an informed public conversation about the choices ahead.
Regardless of which approach is chosen, the issue of social license is key. As noted earlier, a majority of Canadians have recently come to believe that population growth generated by immigration has outstripped the development of social and physical infrastructure. In 2023, this growing perception led to a substantial shift in public support for the number of newcomers that were being admitted. The government must ensure that population growth, infrastructure capacity, and capital investment are aligned – and clearly communicated to the public. This means developing a population strategy alongside an economic strategy. These are not competing priorities, but complementary and mutually reinforcing goals.
Conclusion
Given its low fertility, Canada’s demographic and economic future would be bleak in the absence of immigration. Even under low immigration scenarios (0.3 and 0.6 percent of the population per year), Canada would enter uncharted territory with respect to its OADR. At the same time, immigration is more efficient at increasing the population size than it is at either adding net new workers to the economy or fundamentally altering the age structure of the population. Higher rates of immigration may address short-term labour shortages, provide important skills, and stimulate economic activity (a higher GDP), but their effect on prosperity (GDP per capita) depends on whether they are accompanied by robust productivity growth, capital investment, and innovation. Moreover, they present challenges to Canada’s infrastructure, particularly in housing supply and healthcare availability. Without such complementary investments, rapid population growth could lead to a population trap – where population growth outpaces investment capacity – ultimately lowering prosperity, and potentially worsening fertility rates.
Canada’s demographic future depends on policy decisions made today, which carry long-term consequences that require careful planning and adaptation. While immigration level planning includes multi-year targets and considers a range of factors, in practice it often focuses on managing short-term pressures rather than shaping a long-term population vision. With fertility rates at historic lows, Canada’s reliance on immigration for population growth is intensifying. While immigration is a relevant tool for mitigating population ageing, it cannot prevent Canada from ageing on its own. This impasse highlights the need for a comprehensive population strategy that aligns with a long-term economic strategy – recognizing that growth and economic planning are complementary, not competing, goals. The strategy must also balance population growth with the challenges of an ageing society and address social priorities, including ethnocultural diversity and inclusion, Canada’s linguistic landscape, and Indigenous reconciliation.
A sustainable path forward must integrate immigration with policies to boost workforce participation, promote productivity, incentivize capital investment, and consider measures such as delayed retirement, all while recognizing the potential social and economic trade-offs involved. Without a clear and proactive strategy, Canada risks mounting economic and social pressures. A well-managed, long-term population plan, grounded in both economic realities and social capacity, will be essential to maintaining prosperity and ensuring that growth benefits all Canadians. For The Silo, Daniel Hiebert -Emeritus Professor of Geography at the University of British Columbia.
References
Adcerà, Alicia, and Ana Ferrer. 2013. “The Fertility of Recent Immigrants to Canada.” IZA Discussion Paper Series 7289: 1-21. https://docs.iza.org/dp7289.pdf.
___________. 2017. “Canada: The case for stable population with moderately low fertility and modest immigration.” Canadian Studies in Population 44(3-4): 185-190.
Dettling, Lisa J., and Melissa Schettini Kearney. 2014. “House prices and birth rates: The impact of the real estate market on the decision to have a baby.” Journal of Public Economics 110(c): 82-100. https://ideas.repec.org/a/eee/pubeco/v110y2014icp82-100.html.
Dion, Patrice, Éric Caron-Malenfant, Chantal Grondin, and Dominic Grenier. 2015. “Long-Term Contribution of Immigration to Population Renewal in Canada: A Simulation.” Population and Development Review 41(1): 109-126. https://doi.org/10.1111/j.1728-4457.2015.00028.x.
Dungan, Peter, Tony Fang, Morley Gunderson, and Steve Murphy. 2023. “Macroeconomic Impacts of Immigration in the Canadian Atlantic Region: An Empirical Analysis Using the Focus Model.” IZA Institute of Labor Economics 16527: 1-25. https://docs.iza.org/dp16527.pdf
Fazio, Dimas, Tarun Ramadorai, Janis Skrastins, and Bernardus Ferdinandus Nazar Van Doornik. 2024. “Housing and Fertility.” SSRN Electronic Journal. https://dx.doi.org/10.2139/ssrn.5046571.
Fortin, Pierre. 2025. The Immigration Paradox: How an Influx of Newcomers Has Led to Labour Shortages. Commentary 677. Toronto: C.D. Howe Institute. February.
Laplante, Benoît. 2018. “The Wellbeing of Families in Canada’s Future.” Canadian Studies in Population 45(1-2): 24-32. https://doi.org/10.25336/csp29376.
Lee, Ronald D. 2014. “Macroeconomic Consequences of Population Aging in the United States: Overview of a National Academy Report.” American Economic Review 104(5): 234-239. https://www.aeaweb.org/articles?id=10.1257/aer.104.5.234.
Lee, Ronald, et al. 2014. “Is low fertility really a problem? Population aging, dependency, and consumption.” Science 346(6206): 229-234. https://doi.org/10.1126/science.1250542.
Montcho, Gilbert, Julien Navaux, Marcel Mérette, and Yves Carrière. 2021. “Comparing Public Transfers between Immigrants and Natives: A National Transfer Accounts Approach.” SSRN Electronic Journal. https://ssrn.com/abstract=3968396.
Romaniuk, Antole. 2017. “Stationary population, immigration, social cohesion, and national identity: What are the links and the policy implications? With special attention to Canada, a demographer’s point of view.” Canadian Studies in Population 44(3-4): 165-178. https://journals.library.ualberta.ca/csp/index.php/csp/article/view/29290.
Smith, Philip. 2024. “Accounting for the decline in Canada’s Real GDP Per Capita since Mid-2022.” International Productivity Monitor 46: 83-100. https://www.csls.ca/ipm/46/IPM_46_Smith.pdf.
Zhang, Haozhen, Jianwei Zhong, and Cédric de Chardon. 2020. “Immigrants’ net direct fiscal contribution: How does it change over their lifetime?” Canadian Journal of Economics/Revue canadienne d’économique 53(4): 1642-1662. https://doi.org/10.1111/caje.12477.
The Butchart Gardens, Canada, is the seventh most beautiful spring flower spot in the world, according to a new study.
#7 worldwide- Butchart Gardens, Victoria, British Columbia.
With springtime (seemingly- it is Canada after all) here, there are beautiful gardens all around the world filled with flowers getting ready to bloom. But which of these spots deserve a place on your travel bucket list?
Looking at flower locations across the globe, our friends and experts at Japan Rail Pass analyzed a variety of factors – including Google reviews and ratings, Instagram hashtags, and the vibrancy of the flowers in spring – to give an overall score and determine which flower spots you absolutely should not miss this spring.
The most beautiful spring flower spots around the world
According to the research, the most beautiful flower spot in the world is the Keukenhof Tulip Gardens of Lisse, Netherlands, which has exhibited spring flowers to the public since 1950.
The tulips in spring achieve an almost perfect vibrancy score of 9.96/10, proving just how bright and colourful these stunning gardens are.
Shinjuku Gyoen, Tokyo, Japan – 9.3/10
Credit – Sutterstock_Benny Marty
Next in the rankings, is the beautiful Shinjuku Gyoen in Tokyo, Japan. From the wide variety of cherry blossoms in the national garden, it is the Somei (Yoshino cherry) that bloom in spring.
The beautiful Japanese garden has over 856,000 Instagram hashtags, more than any other spot in the top 10, with people all over the world travelling to view the cherry blossoms.
Royal Botanic Gardens, Kew, London, UK – 9.2/10
Credit – Sutterstock_Charles Bowman
The third most beautiful spring flower spot according to the study is in London, England: The Royal Botanic Gardens, Kew.
With almost as many Instagram hashtags as Shinjuku Gyoen (764,996) and 44,465 reviews, it is clear that the flowers found here,cherry blossom, bluebells, and magnolias to name a few, are beloved by many.
Nabana no Sato, Mie, Japan – 9.0/10
Credit – Sutterstock_martinho Smart
In fourth place is the Nabana no Sato flower park, located in the Nagashima resort in Mie, Japan.
The spot is known for its illuminations throughout the park in winter through to spring, as well as the blooming cherry blossoms and tulips which scored a 9.34/10 for vibrancy in the study.
Dubai Miracle Garden, UAE – 8.9/10
Credit – Sutterstock_Sergii Figurnyi
The fifth most beautiful spring flower spot in the study was found to be the Dubai Miracle Garden in the United Arab Emirates, which occupies over 72,000 square metres, making it the largest natural flower garden in the world.
With over 75,000 reviews since its opening in 2013, and a vibrancy score of 8.78/10, it is clear that this impressive garden deserves its place in the top five rankings.
Methodology:
1. Japan Rail Pass wanted to find out which are the best flower spots around the world to see in Spring.
2. To do this they collected data on 25 popular flower locations around the world including the following variables:
Google ratings and reviews.
Instagram hashtags (using all relevant hashtags including where applicable local language versions)
The Metropolitan Museum of Art to Receive Major Gift of Relief Prints by renowned Inuit printmakers from René Balcer and Carolyn Hsu-Balcer.
(New York, March, 2025)—The Metropolitan Museum of Art announced today the landmark gift of the René Balcer and Carolyn Hsu-Balcer Inuit Print Collection, which features over 500 relief prints by renowned Inuit printmakers from multiple regions across Nunavut and Nunavik, the semiautonomous Arctic homeland of Canada’s Inuit population. This important collection, gifted to The Met by René Balcer and Carolyn Hsu-Balcer, is among the strongest examples of Inuit graphic art in the United States. With works ranging from the mid-1940s to the present day, it includes major works by some of the most influential Indigenous women artists in history and will significantly enhance The Met’s collections of Inuit objects. The Balcer Collection represents diverse Inuit printmaking methods, including sealskin and paper stencils; monoprints; and carved stone, or stone-cuts, on paper, and features imagery of birds, animals, Inuit peoples, transformative figures, dreams, cosmologies, and hunting scenes.
Kenojuak Ashevak’s drawings and prints feature fantastical creatures and bold colors and forms. This captivating image of an arctic owl was among the first prints produced by the West Baffin Eskimo Cooperative. It quickly became a Canadian icon, and in 1970 the print was chosen for the country’s commemorative stamp.
“We are deeply grateful to René Balcer and Carolyn Hsu-Balcer for this extraordinary gift, which is a leading collection of Inuit masterworks in a U.S. museum,” said Max Hollein, The Met’s Marina Kellen French Director and Chief Executive Officer. “Mr. and Mrs. Balcer’s dedication to the support of Inuit artists is evident in this magnificent and comprehensive collection that celebrates the remarkable artistry of Native and Indigenous individuals and communities, and we are thrilled to be able to share these prints with visitors in our American Wing galleries.”
René Balcer began collecting Inuit art in Montreal, Canada, in the late 1970s. The René Balcer and Carolyn Hsu-Balcer Inuit Print Collection highlights the famous artists’ collective and printmaking studio at Baffin Island’s Cape Dorset, the source of Inuit printmaking that was established in the 1950s. The original artists working at Cape Dorset collectively identified as the West Baffin Eskimo Co-operative, and in 1960 they released their first official catalogued collection of 41 prints to great critical acclaim. The René Balcer and Carolyn Hsu-Balcer Inuit Print Collection includes some of the most celebrated Inuit artists associated with the collective, such as Jessie Oonark (1906–1985) and Kenojuak Ashevak (1927–2013), whose print The Enchanted Owl (1960) was featured on a commemorative Canadian postal stamp in 1970 and was on view in The Met exhibition A Decade on Paper: Recent Acquisitions, 2014–2024(August 26, 2024–February 23, 2025). Looking ahead, select works in the Balcer Collection will be included as part of ongoing annual rotations in the Art of Native America installation in the Museum’s American Wing.
“This is an aesthetically and culturally significant gift, and it has been an absolute pleasure to work with René Balcer and Carolyn Hsu-Balcer in our mutual goal to more strongly represent Inuit artists in The Met collection,” said Patricia Marroquin Norby (P’ urhépecha), Associate Curator of Native American Art in the American Wing. “The arrival of this beautifully curated collection aligns with our departmental vision to prioritize previously underrepresented artists and the presence, voices, and experiences of peoples and communities who have contributed greatly to our cultural and national identities. We look forward to collaborating with Inuit communities and individual artists to highlight these works in our galleries and programming.”
René Balcer and Carolyn Hsu-Balcer said, “One of the greatest challenges the Inuit face vis-à-vis the southern world is invisibility. At best, the Inuit and their brethren in the Circumpolar region are an abstraction to the rest of the world, glimpsed mostly through the distorted lens of pop history. At worst, the reaction the Inuit get when meeting non-Indigenous people is, ‘Oh, I thought you all died off years ago.’ It is our modest hope that this collection will demonstrate that the Inuit and their culture are very much alive and very much engaged in the modern world (to wit, see the following image of Annie Pootoogook’s Watching Jerry Springer from 2003). My wife, Carolyn, and I are very grateful to The Met for accepting the collection and committing its vast resources and reach to showcase to the world the creative brilliance, wisdom, and humor of Inuit artists.”
About René Balcer and Carolyn Hsu-Balcer
René Balcer is an Emmy-winning writer, producer, and creator of critically acclaimed TV series and documentaries. René’s engagement with the Canadian North began as a teenager working in lumber mills, hydro projects, and construction on airstrips in remote communities, often alongside First Nations and Inuit coworkers.
Among other artistic endeavors across North America and Asia, René and Carolyn recently organized and participated in a multiyear artist’s residency with Chinese artist Wu Jian’an and Inuit artists at the Uqqurmiut Centre for Arts and Crafts in Pangnirtung, Nunavut, and with renowned artists Shuvinai Ashoona, Ningiukulu Teevee, and Qavavau Manumie at Kinngait Studios (Cape Dorset). René’s poignant photographs of the Arctic have been featured in gallery exhibitions in New York and appear in his recently published portfolio, Seeing As (ACC Art Books UK). For the Silo, Meryl Cates/ The Metropolitan Museum of Art.
(above) Sample pages from Rene’s “Seeing As” Artbook
About The Met
The Metropolitan Museum of Art was founded in 1870 by a group of American citizens—businessmen and financiers as well as leading artists and thinkers of the day—who wanted to create a museum to bring art and art education to the American people. Today, The Met displays tens of thousands of objects covering 5,000 years of art from around the world for everyone to experience and enjoy. The Museum lives in two iconic sites in New York City—The Met Fifth Avenue and The Met Cloisters. Millions of people also take part in The Met experience online. Since its founding, The Met has always aspired to be more than a treasury of rare and beautiful objects. Every day, art comes alive in the Museum’s galleries and through its exhibitions and events, revealing both new ideas and unexpected connections across time and across cultures.
Feature Image: Kenojuak Ashevak. “Untitled (red woman/birds/wings/feet),”Drawing, pencil and ink 10x14in, 25.4×35.6 cm. Waddington, 9/18/20. René Balcer and Carolyn Hsu-Balcer Collection, Gift of René Balcer and Carolyn Hsu-Balcer, 2024 Kenojuak Ashevak. “Untitled (red woman/birds/wings/feet),”Drawing, pencil and ink 10x14in, 25.4×35.6 cm. Waddington, 9/18/20. René Balcer and Carolyn Hsu-Balcer Collection, Gift of René Balcer and Carolyn Hsu-Balcer, 2024
In 2024, Canada’s labour market showed modest growth, with job creation continuing but lagging rapid population growth. This led to an increase in the unemployment rate, reflecting a mismatch between labour force expansion and job creation rather than a decline in sector-specific labour shortages.
Ongoing challenges persist, such as declining labour productivity, sector-specific labour shortages, underemployment, demographic shifts and disparities, and regional imbalances.
Our international comparisons show that Canada typically ranks at or below the Organisation for Economic Co-operation and Development (OECD) average in terms of labour force participation and employment rates for certain population segments. This is largely due to weaker performance in specific regions, such as the Atlantic provinces, and pension policies that incentivize early retirement.
This labour market review emphasizes the need for tailored policies to improve labour market outcomes for seniors and immigrants. Recommendations include gradually increasing the retirement age, offering high-quality training support, and easing labour mobility barriers.
Introduction
The labour market is where economic changes most directly affect working-age Canadians, influencing their job opportunities and income. The supply of labour also determines the availability of Canadians’ skills and knowledge to employers who combine them with capital to produce goods and services that drive our national income and its distribution among income classes. Therefore, the labour market is one of the most important components of Canada’s – or any – economy.
In 2024, Canada’s labour market saw moderate growth, with employment rising to 20.7 million jobs. However, the employment rate declined to 61.3 percent, down from 62.2 percent in 2023, and remains below the pre-pandemic level of 62.3 percent in 2019. While over 1.7 million employed persons have been added since 2019, employment growth has lagged behind population growth, partly due to an aging population, despite high levels of immigration.1 The unemployment rate also increased, reflecting a gap between job creation and labour force expansion, partly due to limited absorptive capacity to keep pace with population growth.
Job vacancies have decreased since mid-2022, but over half a million positions remained unfilled during the third quarter of 2024 (12 percent higher than the pre-pandemic level). Of these vacancies, the majority were full-time (432,810 positions), with more than 31 percent remaining vacant for the long term – persisting for over 90 days. Despite high full-time vacancies, more than half a million workers were underemployed in 2024, seeking full-time work while employed part-time, indicating mismatches between the skills needed by employers and the skills offered by job seekers. Among sectors facing labour shortages, factors such as better relative wages and working conditions appear to be helping, particularly in industries like construction. Healthcare, on the other hand, may benefit from raising wages and reducing training costs to better attract and retain workers.
Further, Canada faces declining labour productivity, which can be attributed to factors such as stagnant capital investment and automation, high reliance on temporary foreign workers to fill low-paying positions, underemployment (including immigrants’ overqualification), a growing public sector with lower productivity, and shifts in industry composition.
This inaugural C.D. Howe Institute labour market review highlights major differences in the labour market across provinces and sectors and among socio-economic groups. It shows that labour force participation and employment of older workers and recent immigrants still have room for improvement.
Canada needs targeted workforce development policies to improve labour market participation and outcomes for diverse population groups and encourage a longer working life (Holland 2018 and 2019). Our recommendations are to:
Gradually raise the normal retirement age from 65 to 67 and delay pension access.
Support older workers with flexible work, part-time options, and self-employment, especially in the Atlantic provinces.
Invest in high-quality training programs for underrepresented groups, focusing on digital skills and job search strategies.
Streamline credential recognition and licensure for skilled immigrants and ease labour mobility in regulated occupations while maintaining the quality of professional services.
Enhance settlement strategies for immigrants, including workplace-focused language training.
Businesses should integrate automation and artificial intelligence (AI) to boost productivity while improving retention and encouraging later retirement by offering training2 and flexible scheduling (Mahboubi and Zhang 2023).Finally, better informing Canadians about learning and training opportunities and addressing financial and non-financial barriers would improve their training participation rates and empower them to acquire the skills needed in a changing labour market.
Overview of Canada’s Labour Market
Canada’s labour market has undergone major changes over time, influenced by factors such as the COVID-19 pandemic, globalization, technological progress, and demographic shifts. These forces have affected the functioning of the labour market, with demographic changes playing a particularly important role. This section reviews key indicators (i.e., labour-force participation, employment and unemployment) and highlights the major trends and disparities in provincial and national labour markets.
The labour force has grown steadily since 1976 but experienced a decline in 2020 due to the pandemic. The lockdowns and public health measures significantly reduced worker participation, especially among women, in the labour market. However, once the restrictions were lifted, workers returned, and the labour force fully recovered. By 2024, Canada had 22.1 million people in the labour force, an increase of about 1.9 million from 2019, mainly driven by the expansionary immigration policy that the country has followed until recently.3 Immigrants accounted for 56 percent of this increase in the labour force, while non-permanent residents made up 32 percent.4
Although the labour force has grown over time, the labour force participation rate (LFPR) has trended downward over the last two decades. This trend is largely driven by an aging population, as participation rates drop sharply after age 54 and continue to decline with age. While the LFPR among prime-aged workers (25-54) reached a record high in 2023, the overall rate remained below pre-pandemic levels and declined further in 2024, reaching 65.5 percent despite high levels of immigration.5 Three factors contributed to this decline compared to pre-pandemic levels: a lower participation rate among youth, a substantial increase in the older population (aged 55 and over) and a decline in the latter group’s participation rate. This decline in older workers’ participation is primarily due to aging, as the proportion of seniors aged 65 and over within the 55-and-over age group increased from 54.8 percent in 2019 to 60 percent in 2024.
The employment rate is more sensitive to economic conditions and fluctuates with cyclical changes in the unemployment rate. It is also influenced by factors such as government policies on education, training, and income support, as well as employers’ investments in skill development and their effectiveness in matching people to jobs. Despite some volatility during economic booms and recessions, the employment rate trended upward until 2008 but has declined since then, mirroring the impact of an aging population on the participation rate (Figure 1). The pandemic caused a sharp decline in the employment rate, followed by a modest recovery. In 2024, the rate, however, declined again by approximately one percentage point to 61.3 percent, as employment growth (1.9 percent) failed to keep pace with the population growth (3 percent).
Regional disparities in employment persist across Canada. Alberta consistently maintains the highest employment rate, while Newfoundland and Labrador lags. Despite significant improvements since 1976, the Atlantic provinces continue to face challenges with employment. For its part, Ontario’s employment rate – historically the second highest in the country – has been below the national average since 2008. Regional differences in economic development, sectoral specialization patterns, educational attainment, family policy, and demographic characteristics are factors behind these employment disparities. For example, Newfoundland and Labrador and New Brunswick had the highest old-age dependency ratios (OADs) in 2024 at 39 and 37 percent, respectively, while Alberta remains the youngest province with an OAD ratio of less than 23 percent.6
The unemployment rate, a key short-term indicator, tends to rise during economic downturns and fall back during recovery, affecting employment outcomes in the opposite direction (Figure 1). The onset of the pandemic in 2020 led to a temporary surge in the unemployment rate to 9.7 percent – a four-percentage point hike from the previous year. As the economy recovered, the unemployment rate plummeted to a record low of 5.3 percent in 2022. However, by 2024, it had risen to 6.3 percent, a figure that remains relatively low by historical standards but higher than the pre-pandemic rate in 2019.
While employment grew by 1.7 million people between 2019 and 2024, the labour force expanded even faster, increasing by 1.9 million people. This imbalance – where the labour force grew more quickly than employment – pushed the unemployment rate higher, reflecting a loosening labour market and making it more challenging for job seekers to secure employment.
Overall, the labour force and employment in Canada have been expanding due to a surge in immigration. Despite unemployment rates remaining higher than the pre-pandemic level, this primarily reflects the exceptional growth in the labour force rather than a lack of job creation. The labour market continues to adjust to the increase in labour supply through strong job creation.
Looking ahead, several uncertainties and factors could influence unemployment rates. For example, the imposition of trade tariffs by the United States poses a direct risk to export-related jobs. In 2024, 8.8 percent of workers – equivalent to 1.8 million people – were employed in industries dependent on US demand for Canadian exports.7 Sectors most vulnerable to these risks include oil and gas extraction, pipeline transportation, and primary metal manufacturing.
On the other hand, stricter immigration policies that limit the inflow of permanent and non-permanent residents may reduce the growth of the labour force, which could, in turn, place downward pressure on the unemployment rate. However, the ongoing arrival of refugees, which contributes to the growing population of non-permanent residents, could lead to higher unemployment rates, particularly if newcomers face significant challenges integrating into the labour market.
To mitigate the negative impacts of aging on the labour market and address labour needs, it is important to encourage greater participation of underrepresented groups and seniors, ensure new entrants and young workers are equipped with the relevant skills to meet the labour market needs and enhance the productivity of the existing workforce. However, declining labour productivity poses an additional challenge that requires urgent attention.
Trends in Labour Productivity
Labour productivity8 in Canada has generally trended upward until the pandemic, but with a general downward trend in its growth rate. In 2020, average productivity surged to $68.5 per hour worked (in 2017 dollars), mainly driven by compositional changes in employment towards more productive jobs, particularly in the business sector, since most job losses were among low-wage workers. However, this gain proved short-lived; by 2023, productivity fell to $63.6, returning to nearly the same level as in 2019 (Figure 2).
Declining productivity has contributed to a reduction in real GDP per capita, which is a key indicator of Canadians’ living standards. Although Canada’s GDP rose by 6.9 percent (in 2017 dollars) between Q4 2019 and Q4 2023, GDP per capita decreased by 0.2 percent over that period. Since 2020, Canada’s GDP per capita growth has averaged an annual decline of 1.3 percent, compared to a growth rate of 1 percent per year between 2010 and 2019 (Wang 2022). Labour productivity continued to decline in 2024 as real GDP growth fell short of the growth of hours worked. This stands in stark contrast to the robust growth of labour productivity seen in the US during the same period.
Several factors, including human capital stock, skills utilization, overqualification, the concentration of immigrants in low-skilled jobs, limited capital investment, and slow adoption of technology, have likely contributed to recent poor labour productivity trends (Wang 2022; Robson and Bafale 2023, 2024). Notably, the combined influx of immigrants and non-permanent residents has driven the majority of employment growth between 2019 and 2024, accounting for 89 percent of the total increase in employment. Although immigrants and non-permanent residents are more likely than Canadian-born workers to have a university education, many are overqualified and work in jobs that require only a high-school diploma (Mahboubi and Zhang 2024). According to the 2021 census, the overqualification rate among immigrants9 and non-permanent residents was 21 percent and 32.4 percent, respectively, while only 8.8 percent of Canadian-born individuals with a bachelor’s degree or higher were overqualified (Schimmele and Hou 2024). With rising immigration, Canada’s productivity will increasingly depend on how effectively it leverages and develops the skills of new immigrants (Rogers 2024).
The recent influx of newcomers can help mitigate the impact of an aging population as they tend to be younger, typically being at their prime working age (Maestas, Mullen and Powell 2023). However, the concentration of immigrants and non-permanent residents in lower-skilled, low-paying sectors and occupations reduces productivity and, consequently, their contribution to GDP per capita. According to Lu and Hou (2023), between 2010 and 2019, non-permanent residents (work permit holders) were increasingly concentrated in several low-paying industries: accommodation and food services, retail trade, and administrative and support, waste management and remediation services.10 Collectively, these industries accounted for 45 percent of all temporary foreign workers in 2019. With the surge of non-permanent residents, one would expect the situation to have worsened in 2023 since the cap for hiring low-wage temporary foreign workers in 2022 increased from 10 percent to 30 percent in seven sectors, including accommodation and food services and to 20 percent for other industries.11 Similarly, Picot and Mehdi (2024) found that immigrants contribute approximately equal amounts of lower-skilled and higher-skilled labour, with 35 percent of those who landed in 2018 or 2019 working in lower-skilled jobs by 2021.
Relying on temporary foreign workers and immigrants to fill lower-skilled, low-paying jobs means that labour becomes a cheaper option than capital, which naturally disincentivizes businesses from investing in productivity-enhancing technology.12 Increases in the supply of labour also discourage business investment in skills upgrading for the existing workforce (Acemoglu and Pischke 1999).
Increases in labour supply without corresponding higher capital investment will also depress productivity. According to Robson and Bafale (2023), a larger labour force resulting from high immigration will not lead to higher living standards if workers are not equipped with better tools to produce and compete. Young and Lalonde (2024) also found that two-thirds of productivity declines since 2021 stem from this population shock.
Technological advancements, particularly digitalization and AI, offer opportunities to boost productivity. Mischke et al. (2024) find that digitalization and other technological advances could add up to 1.5 percentage points to annual productivity growth in advanced economies. Nevertheless, Canada has been slow in capital investment, automation and AI adoption.
The expansion of the public sector also poses challenges. Compared to 2019, public-sector employment increased by 19.6 percent in 2024, while private sector employment only saw an 8.5 percent increase. Consequently, public-sector jobs in 2024 accounted for 21.5 percent of all employment in Canada, up from 19.6 percent in 2019. However, public-sector productivity has lagged the business sector since 2019. In 2023, it was $58.20 per hour worked, 1.5 percent lower than its 2019 level and 1.5 percent below that of the business sector. With a higher share of public employment in the economy, this lower productivity in the public sector reduces overall labour productivity.
Lastly, significant variations in productivity across industries within the business sector shape Canada’s overall performance (Appendix Figure A1). Some industries, such as educational services, experienced notable productivity gains of 25 percent between 2019 and 2023. In contrast, some low-productivity industries faced substantial declines, with that of holding companies decreasing by 60 percent and construction and transportation dropping by 10 percent.13 Labour productivity in industries with the largest employment gains remained unchanged (professional, scientific, and technical services) or declined (public administration) during the same period (Appendix Figure A2). In contrast, agriculture and accommodation and food services witnessed productivity increases, likely due to investments in machinery and automation accompanying employment declines.
Therefore, the industrial distribution of jobs, shifts in industry composition, and demographic changes within industries can greatly affect Canada’s overall productivity. Tackling Canada’s productivity challenges will require substantial capital investment, targeted initiatives in skills development, technological advancements, and industry-specific strategies to promote sustainable economic growth.
Employment by Skill Level
Skill-biased technological changes – innovations that primarily benefit highly skilled workers, such as those proficient in technology, complex problem-solving, and critical thinking – have increased the demand for high-skilled labour in today’s job market. Despite the limitations of that approach, education has generally been used as a proxy for skills. In response to labour market needs, there has been a significant surge in higher education attainment among Canadians over time. The proportion of the population aged 25 and over having a postsecondary certificate, diploma or university degree rose from 37 percent in 1990 to 69 percent in 2024. According to OECD (2024), Canada has the highest postsecondary education attainment rate among core working-age individuals (25-64).
Despite these educational advancements, Canada faces productivity challenges and lags in technological adoption, particularly relative to the United States. One explanation is that although higher levels of education should translate into greater skills – leading to enhanced productivity, employability and adaptability to labour market changes – other factors such as education quality, experience, on-the-job training, capital investment, technological advancement, skill utilization, and age can substantially influence individuals’ skills levels (Mahboubi 2017b and 2019; Robson and Bafale 2023).
Skills and education levels heavily influence labour-market outcomes. For example, labour force participation, including among seniors, increases with educational attainment and those with higher education tend to remain in the labour market longer. This can mitigate some of the negative effects of an aging labour force, as significantly more seniors today possess a formal education above high school compared to decades ago and can take advantage of the ongoing shift from physical work to knowledge-based work.
In parallel with increases in the supply of highly educated labour, there has been a shift in skills requirements among employers.14 Figure 3 shows employment in high-skill-level occupations has seen remarkable growth over the past three decades, increasing by 299 percent from 1987 to 2024. Notably, during the pandemic, employment in high-skill-level roles continued to grow, even as jobs in other skill categories declined. By 2024, high-skill-level occupations accounted for 23 percent of total employment. Despite this growth, medium- and low-skill-level occupations remain predominant, employing approximately 8.1 million and 5.8 million workers, respectively, compared to 4.8 million in high-skill roles. In the last two decades, immigrants and non-permanent residents have increasingly taken both high-skilled and low-skilled jobs. Between 2001 and 2021, they accounted for half of the employment growth in professional and technical skill occupations (Picot and Hou 2024). Over the same period, employment in lower-skilled occupations decreased by half a million. However, more immigrants and non-permanent residents increasingly occupied low-skilled positions, while Canadian-born workers significantly transitioned away from these roles (Picot and Hou 2024). By 2021, immigrants were more concentrated in professional and lower-skilled occupations compared to their Canadian-born counterparts.
In general, the Canadian labour market has performed well since the pandemic, with particularly strong employment growth for high-skill level occupations. As demand for high-skilled labour continues to grow, improving education quality, promoting on-the-job training, and better utilizing the skills of the workforce are essential for maintaining this balance, maximizing the benefits of educational advancements, enhancing productivity and meeting the evolving demands of the labour market.
Imbalances of Labour Supply and Demand
Studying the relationship between unemployment and job vacancies provides insight into labour supply and demand imbalances. It allows us to examine two problems that hinder business growth and slow the economy down: the lack of sufficient employment opportunities for job seekers and the absence of people with the right skills to fill existing jobs.
This relationship is often described by the Beveridge curve, which illustrates how job vacancy rates and unemployment typically move in opposite directions. However, as noted by Blanchard, Domash, and Summers (2022), shifts in this relationship can occur due to factors such as increased labour demand or structural changes in the economy, leading to both higher vacancy rates and higher unemployment simultaneously.
From 2021 to mid-2022, Canada experienced a tight labour market, with an increase in job vacancies alongside declining unemployment. In response, the federal government relaxed several immigration policies to help address these shortages. However, Fortin (2024, 2025) found that a surge in immigration, particularly driven by temporary immigrants, may aggravate job vacancy rates in the overall economy, as observed in Canada between 2019 and 2023. While immigration can initially alleviate skilled labour shortages, it can also intensify shortages in the broader economy due to increased demand from newcomers for goods and services.
In 2024, the labour market transitioned from a state of tightness to a slackening one. In the third quarter of 2024, job vacancies in Canada totalled more than 572,000,15 marking a 12 percent increase compared to the pre-pandemic level in Q4 2019. With 1.5 million unemployed people in the labour market, there were more than two job seekers for every vacant position during that quarter. However, the provincial situations varied (Figure 4). For example, while British Columbia experienced a relatively tighter labour market, with fewer than two unemployed persons for each vacant position, there were more than four unemployed persons available per vacant position in Newfoundland and Labrador. However, the long-term vacancy rate – the share of openings that remained vacant for 90 days or more in total vacancies – in that province was 36.9 percent, which was four percentage points higher than the British Columbia rate in the third quarter of 2024. This indicates both limited employment opportunities for those unemployed and a mismatch between existing skills and those demanded by employers.
Imbalances between labour supply and demand in Canada also exist at the industry level (Figure 5). For example, while the healthcare sector faces severe labour shortages, the information, culture and recreation industry has the highest unemployment-to-vacancy ratio, indicating an excess labour supply. One interesting observation is that while both the construction and manufacturing sectors had similar levels of excess labour supply, the vacancy rate in construction was significantly higher at 3.6 percent, compared to 2.2 percent in manufacturing. This suggests that employers in the construction sector face more challenges in finding workers with the right skills.
The unemployment-to-job vacancy ratios across industries excluded some 612,000 unclassified unemployed persons: those who had never worked before or were employed more than a year earlier. According to Statistics Canada, about 43 percent of job vacancies in the third quarter of 2024 were for entry-level positions, which is helpful for those unclassified unemployed persons as these roles typically do not require prior experience. However, the specific skills and education requirements of these entry-level positions remain unclear.
An analysis of educational requirements for vacancies in the same quarter shows that 48 percent of all job vacancies required post-secondary training or education. Positions requiring post-secondary education below a bachelor’s degree had an unemployment-to-job vacancy ratio of 2.6, while those requiring a bachelor’s degree or higher faced a higher ratio of 4.1. In contrast, vacancies requiring only a high-school diploma or less had a lower unemployment-to-job vacancy ratio of 1.8. However, employers find it more challenging to secure suitable candidates for positions requiring higher educational levels and specialized skills, particularly at wage levels that candidates are willing to accept.
Wages play an important role in reducing labour market imbalances, as they affect both the supply and demand for labour and encourage labour mobility and reallocation. Between Q4 2019 and Q3 2024, the average offered hourly wage saw the largest increases in industries such as arts and entertainment, agriculture, and information and cultural industries (over 30 percent). These sectors also experienced the most significant reductions in job vacancies, suggesting that offering higher wages can help alleviate labour shortages. To address shortages more broadly, there may also need to be a restructuring of relative wages and working conditions between occupations with labour shortages and those with surplus labour.
Offered wage, or stated salary, rates for vacant positions should largely depend on the growth of job vacancies and the difficulties in finding candidates to fill them. However, Figure 6 shows that industries experiencing a surge in vacancies post-pandemic did not respond consistently. In fact, the average hourly offered wage in these industries fell short of the national average, which was 27 percent between Q4 2019 and Q3 2024. For example, despite substantial growth in vacancies and a shortage of candidates in healthcare, the average offered wage growth in this industry only increased by 23 percent. This is largely due to government control over wages, making them less responsive to market forces. Policies like Ontario’s Bill 124, which capped annual wage increases at one percent for civil servants from 2019 to 2022, have contributed to this restraint. Additionally, multi-year labour contracts and provincial efforts to reduce deficits and debt post-COVID have further limited wage growth in the sector.
In Q3 2024, the average hourly offered wage in the utilities sector only increased by 2 percent compared to the pre-pandemic level, despite a 48 percent increase in job vacancies. Employers in this sector need to raise wages to attract and retain workers with the necessary skills. Otherwise, they will rely on their current workforce to work longer hours to maintain operations, which can lead to lower productivity per additional hour of work and retention challenges.
The average offered wage rate by occupation follows a similar trend (Appendix Figure A3). For example, despite a 59 percent increase in job vacancies, the wage rate for occupations in education, law and social, community and government services only rose by 16 percent, which is below the national average. This further highlights the need for employers to raise wages and improve working conditions to attract and retain workers.
Outcomes by Demographic Characteristics
While labour market indicators point to a strong post-pandemic recovery characterized by high employment, not all working-age Canadians have equally participated in and benefited from this resurgence, highlighting untapped potential across different population groups. Notably, recent demographic trends highlight that the older population and immigrants experience distinct labour market outcomes. Seniors (aged 65 and over) have substantially lower labour force participation rates compared to other demographics, raising concerns about both their economic security and potential contributions to the workforce. Additionally, immigrants frequently face employment barriers that limit their ability to fully integrate into the labour market and contribute to addressing the challenges posed by an aging population. Understanding the labour market outcomes for these groups is important for identifying the obstacles they face and formulating targeted policy recommendations to enhance their participation and success in the workforce.16
Age
There are significant variations in labour force participation across age groups. As expected, seniors exhibit the lowest participation rates, with their engagement in the labour market declining substantially after age 65 (Figure 7). Seniors’ participation rate is low across all provinces, albeit with varying degrees. For instance, Saskatchewan has the highest participation rate for seniors at 18.5 percent, while Newfoundland and Labrador records a notably lower rate of 11.5 percent. The four provinces in the Atlantic region, where the aging problem is more severe, have the lowest participation rate. A lack of employment opportunities for seniors in this region seems to be a major driver, with their unemployment rate significantly higher than both the national average and their counterparts aged 25 to 64 (except for Nova Scotia) (Figure 8).
While seniors participate far less than other Canadians in the labour market, Figure 9 shows significant shifts in their average retirement age over time and notable differences across employment types. Self-employed workers consistently retire later than other workers, with their average retirement age exceeding 68 in recent years, while public sector workers tend to retire earlier. These trends likely reflect variations in pension structures, job security, and financial incentives across employment types. Between 1976 and 1998, the average retirement age of all workers declined by four years to 60.9, likely influenced by the introduction of early retirement pension schemes in order to free up jobs for younger workers (OECD 2017). However, this shift had no obvious impact on younger workers’ employment. Many economists also warned that these measures were shortsighted, as the aging of the baby boomer generation would eventually create new challenges. Meanwhile, concerns about the financial sustainability of pension systems grew due to the increasing life expectancy and subsequent rising costs of providing retirement income (Banks et al. 2010; Herbertsson and Orszag 2003; Jousten et al. 2008; Kalwij et al. 2010; OECD 2017).
In response, the federal government in 2012 increased financial penalties for early retirement to encourage longer working lives.17 Consequently, the average retirement age of all workers began to rise and reached 65.3 in 2024, slightly surpassing its 1976 level. However, the persistent gap between the public sector and self-employed workers suggests that policy adjustments – such as pension reform or incentives for longer careers in the public sector – could be considered to encourage more uniform retirement patterns across employment types. The recent influx of immigrants may also help to alleviate the impact of the retirement wave, as immigrants are more likely to keep working and retire later. According to Fan (2024), the average retirement age among immigrant workers is around 66 over the last decade, two years older than that for Canadian-born workers.
Accordingly, the LFPR of seniors has increased substantially from a historical low of 6 percent in 2001 to 15 percent in 2024. Termination of mandatory retirement, lack of sufficient savings, higher educational attainments, and better health conditions among seniors have contributed to these LFPR increases.18 Hicks (2012) predicts that social and economic pressures will lead to further delay in retirement in the future. For example, of all seniors aged 65 to 74, including both Canadian-born and immigrants, one in ten were employed in 2022 (Morissette and Hou 2024). Nine percent reported working by necessity, while immigrant seniors were more likely to do so than their Canadian-born counterparts.
In the long run, labour productivity growth is the primary driver of Canada’s GDP per capita growth, though the participation rate of seniors can also have a significant impact. Wang (2022) found that during the pandemic, declines in employment and participation rates driven by young people and seniors were major contributors to the sharp drop in GDP per capita. He estimated that if work intensity, the employment rate, and the participation rate had maintained their pre-pandemic momentum from 2010 onward, Canada’s GDP per capita could have been 4 percent higher in 2021 than it was.
As babyboomers are gradually retiring, their lower LFPR will continue to influence the overall participation rate. Vézina et al. (2024) found that the overall participation rate is expected to continue declining in the short term, regardless of the number of immigrants selected. Across various scenarios, the overall participation rate appears to be more sensitive to changes in the participation of seniors than to increases in immigration.19 As a result, keeping older workers, particularly those aged 55 and over, in the labour market could significantly impact the future overall participation rate. As more older workers remain employed, improvements in employment assistance, labour market flexibility, and skills upgrading will be essential (Vézina et al. 2024).
International Comparisons of Pension and Retirement Policies
An international comparison reveals that differences in pension and retirement policies play a crucial role in explaining disparities in employment and retirement decisions across countries (Figure 10). Factors such as the flexibility to choose between continuing to work or claiming a pension, legal provisions regarding age-based termination of employment, and employers’ retention strategies – such as offering on-the-job training and flexible work schedules – greatly influence retirement timing.
One of the most significant factors contributing to the variation in employment decisions across OECD countries is the normal age at which individuals can claim full pension benefits. For instance, in 2022, over 32 percent of Iceland’s population aged 65 and over was employed, although the normal retirement age is 67, with the earliest pension access at age 65. In contrast, only about 14 percent of Canada’s population in the same age group remained employed despite having a higher life expectancy. This discrepancy can be explained by Canada’s normal retirement age of 65, with pension benefits available as early as age 60.
Cross-country analyses show that policy reforms reducing financial incentives for early retirement were key drivers behind the increase in old-age employment (Coile et al. 2024). To address challenges related to aging populations, many countries such as Australia, Denmark, the UK, Japan and Italy have raised, or plan to gradually increase, the retirement age to encourage longer working lives. Denmark and Sweden have even indexed their mandatory retirement ages to life expectancy. Canada should consider similar approaches by raising the normal retirement age and delaying the earliest access age.
Immigrants
International immigration has significantly contributed to Canada’s population and labour force growth. Between 2019 and 2024, immigrants and non-permanent residents accounted for 68 percent of the population growth and over 88 percent of the increase in the labour force. However, immigrants often encounter various obstacles such as language barriers, a lack of Canadian work experience and varying recognition for foreign education and experience (Mahboubi and Zhang 2024). These challenges can limit their employment opportunities and earnings. Furthermore, as Canada faces an aging population, the challenge of integrating immigrants into the workforce becomes even more critical. While aging workers often possess valuable experience, they may struggle with the physical demands of certain jobs or require retraining. Newcomers, on the other hand, may not be immediately equipped to fill these gaps in employment. The productivity levels of immigrants can also be affected by their integration into the labour market, as they may require additional training and support to navigate workplace expectations and cultural nuances.
In 2024, immigrants aged 25 to 54 had a lower employment rate (by 4.3 percentage points) compared to non-immigrants (Figure 11). This gap has narrowed since 2006 and continued to decline even through the pandemic despite the latter’s greater impact on immigrants.20 The remaining gap is mainly due to the lower employment rate of female immigrants.
Employment outcomes of immigrants, particularly among women, depend predominantly on the number of years spent in Canada. For women aged 25-54, the employment gap between female non-immigrants and more recent immigrants (who landed less than 5 years) was 15.5 percentage points. This gap narrowed to 10.6 percentage points for immigrants who landed between 6 and 10 years and further to 6.2 percentage points for those who have been in Canada for more than 10 years.
Over the last decade, the improvements in immigrant employment rates are likely attributed to several factors. These include an increased selection of economic immigrants from non-permanent residents with Canadian work experience, the implementation of the Express Entry21 system for immigration selection, and favourable economic conditions where the demand and supply of immigrant labour are broadly aligned (Hou 2024). In addition, the growth in managerial, professional, and technical occupations accelerated in the late 2010s (Frenette 2023), which would benefit recent immigrants with a university education. Recent immigrants in the prime age group of 25 to 54 have seen faster employment rate growth since the early 2010s, with a notable increase of 13.1 percentage points from 2010 to 2024, compared to a 3.5 percentage point increase among non-immigrants.
However, it’s important to note that some of these conditions may change in the short term. For example, the employment rate for recent immigrants stalled from 2022 to 2023, a period when labour shortages eased, and levels of both permanent and non-permanent immigration rose rapidly (Hou 2024). As such, the dynamics of labour supply and demand have changed, particularly with the increases in the labour supply of new immigrants and non-permanent residents coupled with a cooling labour market and rising unemployment. This could negatively affect the employment outcomes of foreign-born residents in Canada more than those of Canadian-born individuals, as immigrants are often disproportionately affected during economic downturns. In 2024, there was a large increase in the unemployment rate of recent permanent immigrants, rising from 8 percent in 2023 to 9.9 percent. This is more than double the unemployment rate of non-immigrants, indicating the difficulties recent immigrants face in securing employment.
The employment rate of immigrants residing in some provinces is lower than the national rate, such as Ontario and PEI (Figure 12). The relatively poor employment outcomes among immigrants in these provinces may stem from specific employment barriers unique to immigrants, as the unemployment rate of non-immigrants in these provinces remains below the national rate. However, immigrants in Newfoundland and Labrador have a higher employment rate than non-immigrants. In contrast, the employment gap between immigrants and non-immigrants is most pronounced in Quebec, a province with the highest employment rate for non-immigrants in Canada. This gap can, to some extent, be due to a large gap in the unemployment rates of these two population groups. The unemployment rate of immigrants in Quebec is twice that of non-immigrants (or a gap of 3.5 percentage points). Grenier and Nadeau (2011) show that the lack of knowledge of French largely explains why the employment rate gap between immigrants and non-immigrants is larger in Montreal than in Toronto. Greater emphasis on official language training could enhance their ability to fully participate in the local labour market.
Policy Discussion
While the Canadian labour market has shown resilience post-pandemic and continued to perform relatively well in 2024, significant disparities across regions, industries, and demographic groups highlight opportunities to improve participation and employment outcomes. Further, Canada’s declining productivity poses a challenge to the labour market’s ability to drive sustained economic growth and competitiveness.
Demographic shifts, particularly an aging population, continue to affect participation rates and contribute to some shortages. Notably, the expansion of the health industry and the associated labour shortages are closely tied to Canada’s aging population. However, in some industries, average offered wages have not risen enough to attract a larger labour supply, and employers have not sufficiently adopted alternative strategies, such as capital investment and automation, to address their workforce needs.
Addressing these challenges requires a holistic approach. Beyond automation and higher wages, investing in existing workers and removing barriers to labour-market participation by underrepresented groups – such as women, youth, Indigenous Peoples, and seniors – can significantly improve labour market outcomes.
Regional differences in economic conditions contribute to provincial variations in the participation of seniors, while differences in pension and retirement policies play an important role in driving discrepancies in retirement timing across countries. Gradually increasing the normal retirement age is a strategy adopted by some countries to encourage later retirement among seniors. In Canada, the federal government in Budget 2019 offered a way to make later retirement financially more attractive by increasing the Guaranteed Income Supplement (GIS) earnings exemption, allowing seniors to retain more of their increased income if they choose to work. However, provincial measures aimed at boosting older workers’ labour force participation have had mixed results. For instance, Lacroix and Michaud (2024) found that a tax credit in Quebec designed to boost employment among older workers had no significant impact on transitions in or out of the labour force, with only modest effects on earnings for those aged 60 to 64. The study concluded that this measure was not a cost-effective way to increase public revenue or employment rates for older workers.
While the Conservative government in 2012 announced a plan to gradually raise the eligibility age for Canada’s Old Age Security benefits from 65 to 67 starting in 2023, the newly elected Liberal government cancelled the plan in 2016. However, with an aging population and increasing longevity, Canada should reconsider gradual adjustments to the normal retirement age and the earliest access age to help sustain public pension systems and ease demographic pressures. This approach aligns with successful international models, though it requires careful implementation to account for differences in job types and income levels.
Seniors today are healthier and living longer, and delaying retirement can offer both personal and economic benefits and ease demographic transitions (Robson and Mahboubi 2018). Longer working lives allow individuals to accumulate greater retirement savings, reducing the risk of financial insecurity in old age. Working longer has also been linked to better cognitive function, mental well-being, and social engagement.
That said, raising the retirement age would affect workers differently depending on their occupations and financial situations. While high-income, knowledge-based workers may benefit from extended careers through flexible work arrangements or hybrid options, many low-income workers in physically demanding jobs – such as those in construction, manufacturing, or caregiving – may find it challenging to work longer. Policies promoting flexible work options, lifelong learning initiatives, and encouraging and monitoring training program uptake22 can help older workers stay in the workforce longer and maintain their skills (Mahboubi and Mokaya 2021).23 Targeted support, such as enhanced workplace accommodations, phased retirement options, and retraining programs for workers in physically demanding jobs, could ensure that a later retirement age does not disproportionately burden lower-income individuals.
In response to population aging and existing labour shortages, Canada has increasingly relied on higher levels of immigration. However, the overqualification of immigrants’ skills and credentials, particularly among those from non-Western countries, remains a persistent issue. The successful integration of newcomers into the workforce is important to mitigate the short-term impact of an aging population on the labour market and enhance productivity. For example, recognizing the credentials of foreign-trained professionals in fields like healthcare could increase their productivity and earnings, helping to address the chronic shortage of healthcare workers. However, many skilled immigrants hold qualifications in regulated fields overseen by provincial regulatory bodies, which creates considerable barriers to entering the labour market. While these regulations aim to uphold public safety, they differ among provinces. Over the past few years, several provincial governments have taken steps to reduce barriers for foreign-trained immigrants. For instance, British Columbia and Nova Scotia have expedited credential assessments for foreign-trained healthcare professionals, which helped expand their healthcare workforce. Other provinces should consider adopting similar initiatives.
Licensed workers, either immigrants or non-immigrants, in these occupations also face barriers if they wish to change their province of residence. Easing provincial labour mobility in regulated professions could help reduce regional labour shortages in these sectors. Ensuring immigrants’ skills and qualifications are recognized and accepted by employers is also important.
Canada also needs to adopt more effective settlement strategies, with a strong emphasis on improving language proficiency for immigrants who struggle with communication skills. Language training tailored to workplace culture can also bridge language gaps and help newcomers obtain licences to integrate into the labour market. A notable example is the Health English Language Pro (HELP) program, which was launched by ACCES Employment to support internationally educated physicians. The program pairs Canadian physician volunteers with internationally trained medical graduates to help them acquire the necessary medical English skills. Furthermore, in recent years, the expansion of language training facilities has not kept pace with the explosive increase in the number of permanent and temporary immigrants. Governments need to systematically evaluate settlement service agencies to assess the returns on investment and enhance the effectiveness of these services in the labour market.
In addition to reducing regional disparities and improving labour market fluidity – making it easier for workers to transition between jobs – Canada should also focus on increasing GDP per capita by encouraging greater capital investment (Robson, Kronick and Kim 2019; Gu 2024; Robson and Bafale 2023 and 2024) and promoting the adoption of new technologies (e.g., AI, robotics, and automation), with a focus on increasing productivity and complementing the skills of the existing workforce.
Canada’s labour productivity has declined recently – a worrisome trend. Enhancing labour productivity involves addressing skill shortages, overqualification and mismatches. Policies that encourage training and promote automation, as well as higher wages in high-demand sectors, are essential. The potential of AI should also be explored to support labour productivity and mitigate skills and labour shortages (Mahboubi and Zhang 2023). However, it is equally important to provide support for the displacement of low-skilled workers who may be impacted by automation. Governments and employers should focus on training programs that align with the evolving demands of the labour market, including reskilling and upskilling initiatives for those at risk of displacement.
Conclusion
Addressing the challenges of an aging population, a lower senior participation rate, the overqualification of immigrants’ skills, and declining labour productivity requires comprehensive and targeted policy interventions. Canada’s labour market will benefit from proactive measures that support both its existing workforce and newcomers while addressing the demographic pressures ahead.
To ensure sustainable economic growth and greater labour market participation, the following policy actions should be considered:
The federal government should gradually raise the normal retirement age to 67 and assess the benefits of delaying the earliest access age for pension benefits, in line with successful international models.
Provincial governments should adopt targeted policies to support older workers, such as promoting flexible work arrangements, part-time career opportunities, and self-employment options, particularly in regions like the Atlantic provinces, where senior participation is notably low.
All levels of government should invest in high-quality training programs that equip individuals with the skills needed for the evolving labour market, such as digital skills and job search strategies, with a focus on underrepresented groups like seniors, Indigenous Peoples, and youth.
Provinces and regulatory bodies should collaborate to streamline the licensing process for skilled immigrants, enabling foreign-trained professionals to meet local regulatory requirements more efficiently. They should also work together to ease labour mobility in regulated occupations, ensuring that qualifications are recognized across regions without compromising service quality.
The federal government should invest in enhancing settlement strategies for immigrants, including providing language training tailored to workplace culture. It is also important to evaluate the effectiveness of existing programs to ensure they adequately support newcomers’ integration into the workforce.
Employers, in collaboration with governments, should integrate automation and advanced technologies such as AI to boost productivity while ensuring that workers’ skills align with the evolving demands of the economy.
By implementing these policies, Canada can better navigate labour market imbalances, enhance its labour force participation, and position itself for sustainable economic growth in the face of demographic and technological change.
The authors extend gratitude to Pierre Fortin, Mikal Skuterud, Steven Tobin, William B.P. Robson, Rosalie Wyonch, and several anonymous referees for valuable comments and suggestions. The authors retain responsibility for any errors and the views expressed.
References
Acemoglu, Daron, and Pischke, Jörn-Steffen. 1999. “The structure of wages and investment in general training.” Journal of Political Economy 107(3): 539-572.
Banks, James, et al. 2010. “Releasing Jobs for the Young? Early Retirement and Youth Unemployment in the United Kingdom.” In Social Security Programs and Retirement around the World: The Relationship to Youth Employment. University of Chicago Press, pp. 319-344.
Busby, Colin, and Ramya Muthukumaran. 2016. Precarious Positions: Policy Options to Mitigate Risks in Non-standard Employment. Commentary. Toronto: C.D. Howe Institute. December.
Casey, Bernard. 1998. “Incentives and Disincentives to Early and Late Retirement.” Working Paper AWP3.3. Paris: OECD.
Coile, Courtney, David Wise, Axel Börsch-Supan, Jonathan Gruber, Kevin Milligan, Richard Woodbury, Michael Baker, James Banks, Luc Behaghel, Melika Ben Salem, Paul Bingley, Didier Blanchet, Richard Blundell, Michele Boldrín, Antoine Bozio, Agar Brugiavini, Tabea Bucher-Koenen, Raluca Elena Buia, Eve Caroli, Naohiro Yashiro. 2025. “Social Security and Retirement around the World: Lessons from a Long-term Collaboration.” Journal of Pension Economics and Finance 24: 8-30.
Coile, Courtney, Kevin S. Milligan, and David A. Wise. 2018. “Social Security Programs and Retirement Around the World: Working Longer – Introduction and Summary.” National Bureau of Economic Research. Working Paper 24584. May.
Fortin, Pierre, 2024. “Does immigration help alleviate economy-wide labour shortages?” CLEF Working Paper Series 70, Canadian Labour Economics Forum (CLEF), University of Waterloo.
Fortin, Pierre, 2025. The Immigration Paradox: How an Influx of Newcomers Has Led to Labour Shortages. Commentary 677. Toronto: C.D. Howe Institute. February.
Gagnon, Morgan, Sithandazile Kuzviwanza. 2023. “Mapping Employment Supports for Québec’s Racialized and Immigrant English-speaking Communities.” Provincial Employment Roundtable (PERT). July.
Grenier, Gilles, and Serge Nadeau. 2011. “Immigrant access to work in Montreal and Toronto.” Canadian Journal of Regional Science 34(1): 19-32.
Gu, Wulong. 2024. “Investment Slowdown in Canada After the Mid-2000s: The Role of Competition and Intangibles.” Statistics Canada. DOI: https://doi.org/10.25318/11f0019m2024001-eng
Guillemette, Yvan. 2006. “Misplaced Talent: The Rising Dispersion of Unemployment Rates in Canada.” E-Brief 33. Toronto: C.D. Howe Institute.
Haun, Chris. 2023. “A Detailed Analysis of Canada’s Post-2000 Productivity Performance and Pandemic-Era Productivity Slowdown.” Center for the Study of Living Standards. Available at https://www.csls.ca/reports/csls2023-11.pdf
Herbertsson, Tryggvi Thor, and Mike Orszag. 2003. “The Early Retirement Burden: Assessing the Costs of the Continued Prevalence of Early Retirement in OECD Countries.” IZA Discussion Paper, No. 816, July.
Holland, Brian. 2018. “Defining and Measuring Workforce Development in a Post-Bipartisan Era.” GLO Discussion Paper Series # 234, Global Labour Organization (GLO).
___________. 2019. “The Design and Uses of an Employability Index to Evaluate the Vertical Workforce Development Process.” New Horizons in Adult Education and Human Resource Development 31(2): 41-59.
Jousten, Alain, Mathieu Lefèbvre, Sergio Perelman,and Pierre Pestieau. 2010. “The Effects of Early Retirement on Youth Unemployment: The Case of Belgium.” In Social Security Programs and Retirement Around the World: The Relationship to Youth Employment. University of Chicago Press, pp. 47-76.
Kalwij, Adriaan, Arie Kapteyn and Klass de Vos. 2010. “Retirement of Older Workers and Employment of the Young.” De Economist 158 (4): 341-359.
Lacroix, Guy, and Pierre-Carl Michaud. 2024. “Tax Incentives and Older Workers: Evidence from Canada.” HEC Montreal. Working Paper. September.
Lefebvre, Pierre, and Philip Merrigan. 2008. “Child-Care Policy and the Labour Supply of Mothers with Young Children: A Natural Experiment from Canada.” Journal of Labour Economics 26 (3): 519-48.
Mahboubi, Parisa. 2017a. The Power of Words: Improving Immigrants’ Literacy Skills. Commentary 486. Toronto: C.D. Howe Institute. May.
___________. 2017b. “Talkin’ ‘Bout My Generation: More Educated, But Less Skilled Canadians.” E-Brief. Toronto: C.D. Howe Institute.
___________. 2024. Quality Over Quantity: How Canada’s Immigration System Can Catch Up With Its Competitors. Commentary 654. Toronto: C.D. Howe Institute. February.
Mahboubi, Parisa, and Amira Higazy. 2022. Lives Put on Hold: The Impact of the COVID-19 Pandemic on Canada’s Youth. Commentary 624. Toronto: C.D. Howe Institute. July
Mahboubi, Parisa, and Momanyi Mokaya. 2021. The Skills Imperative: Workforce Development Strategies Post-COVID. Commentary 609. Toronto: C.D. Howe Institute.
Mahboubi, Parisa, and Tingting Zhang. 2023. Empty Seats: Why Labour Shortages Plague Small and Medium-Sized Businesses and What to Do About It. Commentary 648. Toronto: C.D. Howe Institute. November.
___________. 2024. Harnessing Immigrant Talent: Reducing Overqualification and Strengthening the Immigration System. Commentary 672. Toronto: C.D. Howe Institute.
______. 2022. What has been the impact of the COVID-19 pandemic on immigrants? An update on recent evidence. OECD Publishing. Paris. https://doi.org/10.1787/65cfc31c-en
Picot, Garnett, and Tahsin Mehdi. 2024. “The Provision of Higher- and Lower-skilled Immigrant Labour to the Canadian Economy.” Statistics Canada. DOI: https://doi.org/10.25318/36280001202400900005-eng
Robson, William B.P. 2019. Thin Capitalization: Weak Business Investment Undermines Canadian Workers. Commentary 550. Toronto: C.D. Howe Institute. August.
Robson, William B.P., and Mawakina Bafale. 2024. Underequipped: How Weak Capital Investment Hurts Canadian Prosperity and What to Do about It. Commentary 666. Toronto: C.D. Howe Institute. September.
Robson, William B.P, and Mawakina Bafale. 2023. Working Harder for Less: More People but Less Capital Is No Recipe for Prosperity. Commentary 647. Toronto: C.D. Howe Institute. June.
Robson, William B.P., and Parisa Mahboubi. 2018. “Inflated Expectations: More Immigrants Can’t Solve Canada’s Aging Problem on Their Own.” E-Brief. Toronto: C.D. Howe Institute. November.
Robson, William B.P., Jeremy Kronick and Jacob Kim. 2018. Tooling Up: Canada Needs More Robust Capital Investment. Commentary 520. Toronto: C.D. Howe Institute. September.
Schimmele, Christoph, and Feng Hou. 2024. “Trends in Education–Occupation Mismatch among Recent Immigrants with a Bachelor’s Degree or Higher, 2001 to 2021.” Statistics Canada. May 22. DOI: https://doi.org/10.25318/36280001202400500002-eng
Skuterud, Mikal. 2023. “Canada’s Missing Workers: Temporary Residents Working in Canada.” E-Brief 345. Toronto: C.D. Howe Institute. September.
Skuterud, Mikal. 2025. “The Growing Data Gap on Canada’s Temporary Resident Workforce.” E-Brief 367. Toronto: C.D. Howe Institute. February.
The gambling industry in Canada has changed a lot over the years. While land-based casinos remain popular, online platforms have opened up new opportunities for players who prefer the convenience of playing from home. With better internet access, secure payment methods, and a wider variety of games, more Canadians are choosing online casinos over traditional ones.
Online casinos allow players to enjoy everything from classic slot machines to live dealer games, making them a preferred choice for those looking for excitement without visiting a physical casino. Many platforms are now licensed and regulated to ensure safe and fair play. Whether you are a beginner or an experienced player, the options available today cater to everyone.
One of the biggest attractions of online casinos is the variety of games they offer. Websites casinosincanada provide detailed reviews and recommendations on the best platforms available, making it easier for players to choose a trustworthy casino.
Understanding Online Casino Regulations in Canada
The legal status of online gambling in Canada is unique. While gambling is allowed, it is regulated at the provincial level. This means that each province has its own rules regarding online casinos. For example, Ontario has introduced a fully regulated market through iGaming Ontario, allowing licensed operators to provide legal online gambling services.
Other provinces, such as British Columbia and Quebec, operate their own online casino platforms. However, many Canadians still play on international sites that accept players from Canada. These offshore casinos operate under licenses from jurisdictions such as Malta, Gibraltar, and Curacao.
Since each province sets its own rules, it’s important for players to check whether an online casino is legally allowed to operate in their area. Choosing a licensed casino ensures a safer experience, as these platforms follow strict guidelines to protect players.
The Most Popular Online Casinos in Canada
With so many online casinos available, choosing the right one can be difficult. Here are some of the top-rated casinos that Canadian players trust:
1. JackpotCity Casino
Established in 1998, JackpotCity is known for its wide selection of games.
Offers over 700 games, including slots, table games, and live dealer games.
New players can claim up to $1,800 in welcome bonuses.
Holds a license from the Malta Gaming Authority, ensuring a secure experience.
2. Spin Casino
Provides a user-friendly platform with high-quality games.
Features over 700 slot machines and table games.
New users can receive a $1,000 match bonus plus free spins.
Licensed by the Malta Gaming Authority.
3. LeoVegas Casino
Specializes in mobile gaming, offering over 2,500 games.
Known for fast withdrawals, often processed within 24 hours.
Provides a welcome bonus of up to $1,000 plus 100 free spins.
Holds licenses from iGaming Ontario and the Malta Gaming Authority.
4. PartyCasino
Features a mix of classic and modern casino games.
Offers frequent promotions and a loyalty rewards program.
Licensed by the UK Gambling Commission and the Gibraltar Regulatory Authority.
5. Bet365 Casino
A well-known international platform with a strong reputation.
Provides over 2,000 games, including slots, blackjack, and roulette.
New players receive 100 free spins with no wagering requirements.
Regulated by the UK Gambling Commission and iGaming Ontario.
How to Choose the Right Online Casino
If you are new to online gambling, selecting a reliable casino is crucial. Here are a few things to look for:
1. Licensing and Security
Always choose a casino that is licensed by a trusted authority. This ensures fair gaming and secure transactions. Look for SSL encryption, which protects personal and financial data.
2. Game Selection
A good casino should offer a wide variety of games, including slots, table games, and live dealer options. Make sure the platform provides games from reputable software providers.
3. Bonuses and Promotions
Many casinos attract new players with welcome bonuses, free spins, and loyalty programs. Read the terms and conditions carefully to understand wagering requirements before claiming any offers.
4. Payment Methods
Choose a casino that supports convenient and secure payment options. Common methods include credit cards, e-wallets, and bank transfers. Fast withdrawal processing is a key factor to consider.
5. Customer Support
Reliable customer support is essential for a smooth gaming experience. Look for casinos that offer 24/7 assistance through live chat, email, or phone.
The Future of Online Gambling in Canada
The online gambling industry in Canada is evolving rapidly. Ontario’s success in regulating its online market may encourage other provinces to introduce similar frameworks. This could lead to safer and more transparent gaming environments across the country.
Technology is also changing the way people play. Virtual reality (VR) and augmented reality (AR) are expected to enhance the gaming experience, making online casinos more interactive. Additionally, cryptocurrency payments may become more common, providing faster and more secure transactions.
Final Thoughts
Online casinos offer a great way to enjoy casino games without visiting a physical location. With the right precautions, players can have a fun and safe experience. Checking for proper licensing, choosing reputable platforms, and setting limits on gameplay are important steps in responsible gambling.
As the industry grows, more Canadian players will have access to better platforms, improved security, and a wider range of gaming options. Whether you are playing for fun or real money, always gamble responsibly and choose casinos that prioritize player protection. For the Silo, Vinayak Gupta.
Newcomers increase consumption and spending, and are actually contributing to demand for labour in other sectors.
Study in Brief
This study investigates the effects of Canada’s expansive immigration policy, implemented between 2016 and 2024, on labour shortages. It explores how the influx of permanent and temporary immigrants has affected the balance between labour supply and demand, with attention to whether the policy has met one of its key objectives – alleviating shortages in labour markets.
It provides an analysis of labour market dynamics through the lens of the Beveridge curve, which tracks the joint path of unemployment and job vacancies over time. The study compares labour market tightness before, during, and after the pandemic and evaluates how rapidly rising immigration and the adoption of remote work have affected job vacancy rates in Canada.
The arrival of immigrant workers has expanded the supply of labour to employers, but has also generated additional income and spending, and hence greater demand for labour throughout the economy. The macroeconomic evidence from this study indicates that, on balance, the increase in demand generated by immigration has more than likely outpaced the additional supply, potentially making economy-wide labour shortages more widespread rather than alleviating them.
Introduction
Canada’s immigration levels began to accelerate in 2016, following a period of relative stability. From 2001 to 2015, the annual inflow of immigrants, including both permanent and temporary admissions, was reasonably stable at around 0.85 percent of the overall population. In the following years, despite a temporary contraction during the pandemic, this rate rose fourfold, reaching up to 3.2 percent of the population in 2023.
This post-2015 expansion was consistent with recommendations from the Advisory Council on Economic Growth, established by Minister of Finance Bill Morneau in 2016. The Council’s 2016 report suggested that the annual number of permanent economic immigrants should be increased from 300,000 in 2016 to 450,000 in 2021, and to nearly double this number later. Its stated objectives were to increase population growth, reduce the old age dependency ratio, generate a bigger GDP, and accelerate the rise in real GDP per capita by easing shortages of high-skilled workers and other means. Policymakers, encouraged by the perceived success of Canada’s immigration program, embraced the idea that higher immigration levels could deliver even greater economic and demographic benefits.1 The Council also urged the government to facilitate admissions of temporary workers and attract more international students. The government responded by increasing permanent immigration levels from 270,000 in 2015 to 480,000 in 2024, allowing uncapped increases in temporary immigration, and trying to address shortages of low- as well as high-skilled labour.
The C.D. Howe Institute’s research has shown that the benefits of immigration in mitigating population aging, and supporting the growth of GDP per capita, have been more limited than expected (Mahboubi and Robson 2018; Doyle, Skuterud and Worswick 2024). The present study is an attempt to assess whether the policy has succeeded in meeting the goal of easing the challenges employers face in finding suitable candidates for their job openings. The answer to this question has clearly been a big “yes” at the level of the individual employer. Many employers are benefiting from the contribution of their new immigrant workers, which is the basis for the unrelenting support for more immigration by representative national business organizations.
It is less clear whether immigration has helped alleviate labour shortages in the overall economy. Immigration not only expands the supply of labour, but also adds to the demand for labour. Putting more immigrants to work generates an expansionary multiplier effect on gross domestic product (GDP) and national income. As the additional income is spent on various consumption and investment goods by households, businesses and governments, the demand for labour increases. The net effect of immigration on the difference between supply and demand in the aggregate economy is, therefore, a priori uncertain. It could be negative or positive.
My goal in this study is to uncover what simple economic logic, and the statistical evidence from Canadian macrodata, reveal about the direction and quantitative importance of the net effect of rising immigration on the economy-wide balance between the demand for, and the supply of, labour. I find that the demand has likely matched or exceeded the supply and has therefore increased the overall job vacancy rate at any given level of unemployment.
Labour Shortages and Job Vacancies
What do “labour shortages” mean, and how have they evolved since Canada’s immigration rate began to increase eight years ago? Employers feel they are short of labour when the number of unfilled job openings significantly exceeds the number of available employees with the necessary skills and qualifications to meet their operational needs. Each month, Statistics Canada reports the extent of labour shortages in various sectors and regions from its Job Vacancy and Wage Survey. It is called the “job vacancy rate” and is an estimate of the number of job vacancies as a percentage of total labour demand, including all occupied and vacant salaried jobs.
Data on the job vacancy rate have been available since 2015 (Figure 1). After the oil-induced economic slowdown of 2014-2015, job vacancies increased from 2.3 percent of labour demand in mid-2016 to 3.3 percent in early 2020. No vacancy data were available from April to September 2020 due to a six-month pandemic-related pause in Statistics Canada’s survey. Moving through the spring 2020 recession, but with the unemployment rate still very high, job vacancies then increased swiftly, reaching a peak of 5.7 percent of all occupied and vacant jobs in the second quarter of 2022. But with the economic slowdown and slackened labour markets subsequently accompanying high interest rates, vacancies fell back to 3.0 percent of labour demand in the third quarter of 2024.
Immigration and Labour Supply and Demand
Since 2015, Canada’s job vacancy rate has fluctuated in response to three key macroeconomic factors: rising immigration, the pandemic, and fluctuations in aggregate economic activity.
Immigration has risen steadily in recent years, with both permanent and temporary entries increasing in each non-pandemic year (Figure 2). Permanent admissions rose from 272,000 in 2015 to 472,000 in 2023. This upward trend was guided by the multi-year immigration-level targets set each year since 2017 by the government in its Annual Report to Parliament on Immigration. For example, the target for permanent admissions in 2023 was set at 465,000 in the 2022 Report.
Temporary immigration includes holders of study or temporary work permits, asylum seekers, and their family members. They are collectively referred to as “non-permanent residents” by Statistics Canada. Prior to 2024, temporary immigration was excluded from the government’s annual targets. It was uncapped and followed demand from businesses and educational establishments. The net annual addition to temporary permits (new entries less exits to permanent residence and to abroad) rose from basically zero in 2015 to 190,000 in 2019, and 821,000 in 2023 (Figure 2).
Overall, total immigration – the sum of permanent and temporary immigration – increased fivefold from 263,000 in 2015, to 1,293,000 in 2023. Was this fivefold surge in immigration over eight years able to lower the job vacancy rate and reduce labour shortages in the aggregate Canadian economy? How could it not? Prima facie, the arrival of new immigrant workers increases the supply of labour, allowing recipient employers to ameliorate their personnel gap, at least in part. The addition of immigrant labour might suggest the “common sense” inference that labour scarcity has been effectively eased up throughout the economy.
However, it is erroneous to assume that simply because immigration solves the personnel shortage of individual employers, it will necessarily solve the problem of labour scarcity in the aggregate economy.
The error comes from focusing narrowly on increasing the supply of labour, while neglecting the simultaneous increase in the demand for labour that is generated by immigration. With more immigrants in the workforce, employers can produce more goods and services and generate more income for themselves, their employees, and their suppliers – a good thing. However, to assess the overall effect of immigration on labour scarcity, it is crucial to consider that this additional income will be spent on various consumer and investment goods. Immigrants allocate their new income, along with any savings brought from abroad, to essentials such as food, clothing, housing, transportation, personal care, and leisure. In turn, employers and their chains of suppliers invest more in construction, machinery and intellectual property. Furthermore, immigrants, employers and suppliers all contribute to taxes, which governments allocate to meet the increased demand for social services, including public housing, education, and healthcare. The growing demand for private and public goods and services will expand aggregate labour demand.
In other words, the hiring of immigrants initially adds to the supply of labour, but it also ends up adding to the demand for labour once the new income generated is spent throughout the economy and a multiplier effect is generated on GDP. On net, it is a priori uncertain whether the supply increases more than the demand, in which case labour would be made less scarce overall, or whether it is the demand that increases more than the supply, in which case labour would be made scarcer.
As a first attempt to clarify the picture, let us see how the excess of labour supply over labour demand evolved from 2016 to 2024 (Figure 3). I take labour supply to be the entire labour force (all workers who are employed or are looking for work), and labour demand to be the sum of employment and job vacancies (all jobs that are occupied or ready to be filled). Expressed as a percentage of the labour force, the difference between the two – excess supply – boils down to the difference between unemployment and job vacancies. Excess supply goes up or down depending on whether unemployment increases more or less than job vacancies.
Figure 3 shows that the excess supply of labour has fluctuated widely since 2016. In the pre-pandemic period 2016-2019, it declined from 5.4 percent to 2.9 percent of the labour force. Labour became scarcer. During the pandemic year 2020, it shot up to 6.1 percent of the labour force. But in the aftermath, labour demand outpaced supply again so that by mid-2022 excess supply had dropped to a low of 0.3 percent of the labour force. Since then, it has risen back to 4.1 percent.
The time path of the excess supply of labour cannot alone determine whether the rise in immigration since 2016 has increased labour supply more or less than labour demand. Excess supply results from the interplay of three simultaneous determinants: rising permanent immigration and accelerating temporary immigration, the disruptions caused by the pandemic and its potential after-effects, and fluctuations in aggregate activity. For example, the declining excess supply in the pre-pandemic period 2016-2019 was the combined outcome of rising immigration and aggregate economic expansion. But the impact of rising immigration cannot be separated out from that of aggregate economic expansion by just looking at the trend in excess supply. Correctly identifying the net effect of each of the two factors requires a more comprehensive economic and statistical analysis of the data.
The Shifting Beveridge Curve
To identify the net effect of immigration on labour shortages, I will use a well-established tool called the Beveridge curve. The Beveridge curve offers valuable insights by highlighting the observed inverse relation between vacancies and unemployment.
William Beveridge (Beveridge 1960) used the unemployment rate as a main marker of fluctuations in aggregate activity, a practice business cycle analysts still follow to this day (Romer and Romer 2019; Hazell et al. 2022). He observed that vacancies and unemployment typically move in opposite directions through business cycles. He attributed the negative relationship to the pressure exerted by aggregate activity on economic potential. When aggregate economic activity was moving up to its full potential (as in Canada in 2016-2019), there were fewer unemployed workers and more job vacancies. Conversely, when activity was moving away from potential (as in Canada in 2023-2024), there were more unemployed workers and fewer job vacancies. Since 1960, this inverse relation between the job vacancy rate and the unemployment rate – now called the Beveridge curve – has played a key role in macroeconomic analysis of labour markets. It has been abundantly studied by researchers and has been identified in job vacancy and unemployment data in many countries (e.g., Blanchard and Diamond 1989; Pissarides 2000; Archambault and Fortin 2001; Elsby, Michaels and Ratner 2018; Michaillat and Saez 2021).
It is instructive to examine the trajectory of the Canadian unemployment – job vacancy relation in two-dimensional space from 2015 to 2024 (Figure 4). First, following the 2015 economic slowdown, the economic expansion of 2016-2019 brought a decrease in the unemployment rate and an increase in the job vacancy rate along a path that was consistent with a negatively sloped Beveridge curve. The sudden outbreak of the pandemic in early 2020 shattered this trajectory. The unemployment – job vacancy pair was sent far outward toward the northeast corner of the chart. From then until the end of 2021, it followed a new Beveridge curve to the northwest. During the recovery following the pandemic recession in the spring quarter of 2020, the unemployment rate decreased and the job vacancy rate increased along a path that was about parallel to that of 2015-2019, but at a much higher level. For instance, whereas the unemployment rate was the same in the summer quarter of 2021 as in the winter quarter of 2016 (7.25 percent), the job vacancy rate was twice as large in the former (4.2 percent) as it was in the latter (1.9 percent). Finally, as the pandemic faded, the unemployment – job vacancy pair did a loop to the west. A new post-pandemic Beveridge curve emerged along a southeasterly trend that looked parallel to, but somewhat higher than, the old pre-pandemic path of 2015-2019.2
This visual check reveals that there have been three distinct periods in the inverse relationship between job vacancies and unemployment, known as the Beveridge curve: pre-pandemic, pandemic and post-pandemic. The start and end of the pandemic significantly affected the vertical position of the Beveridge curve in the unemployment – job vacancy space. Although the three branches are not perfectly aligned, they appear to be nearly parallel. According to the statistical results in Table 1 below, a one percent change in the unemployment rate corresponds to about a 1.5 percent change in the opposite direction in the vacancy rate – this is sometimes referred to as the Beveridge curve “elasticity.”
The shifts in the Canadian Beveridge curve during the pandemic are not an entirely unexpected development. Shifts have occurred from time to time in the past.3 As Figure 4 has shown, the Canadian Beveridge curve looked relatively stable before the pandemic in 2016-2019. Figure 5 is an idealized illustration of the position it occupied in the unemployment – job vacancy space in this period. However, starting in 2020, it shifted significantly. It first moved outward during the pandemic in 2020-2021 and then returned inward after the pandemic in 2022-2024.
As an initial assessment of the magnitude of these movements, I use the actual values of unemployment and job vacancies to calculate the implied monthly shifts in the Figure 5 Beveridge curve from January 2016 to October 2024. I then illustrate the implied vertical movements of the job vacancy rate corresponding to a given reference unemployment rate of 5.5 percent4 by averaging the results for each year from 2016 to 2024. The vertical height of the Beveridge curve calculated in this way increased from 2.8 percent in 2019 to nearly 6 percent in 2020-2021, and dropped back to 3.2 percent in 2024 (Figure 6).
The Beveridge curve’s elevation at around 3.2 or 3.3 percent in the post-pandemic period 2023-2024 is higher than its height of 2.8 or 2.9 percent in the pre-pandemic period 2018-2019. This can be attributed to shifts in the ratio of two background factors: the intensity of labour reallocation across occupations, industries and regions, and the efficiency of the matching process between job openings and job seekers (Blanchard, Domash and Summers 2022). At any given rate of unemployment, the job vacancy rate and the Beveridge curve will be higher in relation to the intensity of labour reallocation and the inefficiency of job matching.
The first factor, the intensity of labour reallocation, is captured by the monthly flow of hires as a percentage of the labour force. It is shown as an index with 2019 = 100 in Figure 7. It increased by some 10 percent during the pandemic of 2020-2021. Labour moved from transport industries and those requiring person-to-person contact toward electronic communications and home deliveries. There was a displacement from traditional businesses and occupations to those allowing work from home. However, in 2022-2024 labour reallocation calmed down and its intensity decreased by some 15 percent below its 2019 level. This pushed the Beveridge curve downward.
The second factor, the efficiency of job matching, reflects the capacity of labour markets to generate hires at the observed levels of unemployment and job vacancies. It is an index with 2019 = 100 in Figure 8. It experienced a sharp drop of nearly 20 percent during the pandemic (2020-2021). Factors contributing to this decline include the increasing physical distance between vacant positions and available candidates, as well as the widening gap between the demand for and supply of skills. Also, the rise in illnesses and the increased popularity of remote work during the pandemic likely may have contributed to a decline in job search intensity. As a result, employers found it more difficult to match job offers with suitable job seekers. Matching efficiency did not recover from 2022-2024. It remained some 20 percent below its pre-pandemic level of 2018-2019. This pushed the Beveridge curve upward.
Going from 2019 to 2024, movements in labour reallocation and matching efficiency had opposite effects on the height of the Beveridge curve. But the upward pressure on the curve from the 20 percent drop in matching efficiency was greater than the downward pressure from the 15 percent decline in labour reallocation. Therefore, as already pictured in Figures 4 and 6, the net outcome is that, going over the pandemic, the Beveridge curve wound up at a higher level in 2024 than in 2019, implying a higher job vacancy rate for any given unemployment rate.
So far, I have used the Beveridge relation between job vacancies and unemployment as a broad interpretive framework for macroeconomic developments in Canada over the 2015-2024 period. First, I have focused on the effect of fluctuations in aggregate economic activity (captured by changes in unemployment) on the job vacancy rate. Second, I have noted that the onset and ending of the pandemic have been big shifters of this unemployment – job vacancy trade off upward in 2020-2021 and downward in 2022-2024. Nevertheless, third, I have shown that, mainly due to a persistent 20 percent drop in job matching efficiency since 2019, the Canadian Beveridge curve was occupying a higher vertical position in 2023-2024 than before the pandemic.
In addition to the pandemic, Canada’s immigration policy, characterized by rising immigration levels, is another major development that has impacted labour markets in recent years. Like the pandemic, this policy may have affected the level of the unemployment rate along the Beveridge curve, as well as the vertical position of the curve, through its impacts on labour reallocation and matching efficiency. The following sections try to assess the existence and magnitude of these potential effects of immigration.
Economic Logic
The Beveridge framework can be used to explain how the expansion of immigration in Canada before and after the pandemic could have produced a lasting decrease or increase in labour shortages. Excluding the pandemic’s influence, rising immigration may affect aggregate labour shortages in two mechanical ways: by causing labour markets to slide up or down along the Beveridge curve, or by shifting the entire position of the Beveridge curve upward or downward, resulting in a larger or a smaller number of job vacancies for any given unemployment rate.
The first scenario involves a slide along the Beveridge curve. If rising immigration moves the economy up and to the northwest, unemployment decreases and vacancies increase; if the economy descends to the southeast, unemployment increases and vacancies decrease, as shown in Figure 5.
A permanent increase in unemployment along a given Beveridge curve is not what is generally hoped for by policymakers and the public. We want to achieve a permanent reduction in labour scarcity without being forced to suffer a permanent increase in unemployment. Nevertheless, it is important to understand how rising immigration could impact unemployment permanently, such that a higher or lower unemployment rate would be structurally needed to keep inflation low and stable over time.
A rough check on whether a higher immigration rate has raised or lowered the national unemployment rate consists of seeing if the excess of the national rate over the rate of the experienced group, formed by the Canadian-born plus the immigrants landed more than five years earlier, was higher or lower in 2023 than in 2015. Labour force data indicate that the excess of the national rate over the rate of this experienced group did increase in this period, but by just 0.1 percentage point, owing essentially to the rising labour force share of immigrants landed less than five years earlier. Seen in this light, rising immigration does not seem to have had a meaningful direct effect on structural unemployment. This result is consistent with research by Dion and Dodge (2023), who found no significant change in the national unemployment rate needed to keep inflation stable, known as the noninflationary rate of unemployment, that could be attributed to rising immigration.
It is a relief to see that rising immigration has not entailed a permanent reduction in the job vacancy rate by permanently pushing the national unemployment rate upward. There is evidence, though, that rising immigration has led to greater cyclical volatility of unemployment. First, the phenomenal expansion in the number of new residents since 2021 is known to have contributed to the strong demographic pressure on the demand for housing and, hence, to the significant increase in the cost of rented and owned accommodation. The Bank of Canada has acknowledged that the persistence of high shelter inflation consequently acts “as a material headwind against the return of inflation to the 2 percent target” (Bank of Canada 2024). In other words, through this channel, rising immigration is prolonging the current period of slower growth and higher unemployment. Second, the difference in cyclical sensitivity of the unemployment rate, between the above-defined experienced group and immigrants landed less than five years earlier, seems to have increased. In the economic slowdown during the spring quarter of 2024, the unemployment rate was 4.0 points higher than a year before for immigrants landed less than five years earlier, but only 0.7 point higher for the experienced group. The difference of 3.3 points between them was larger than in the 2009 and 2020 recessions. It could be due in part to the rising share of the low-skilled population of immigrant workers, which is more exposed to layoffs.
This study is primarily concerned with the permanent structural effects of rising immigration on unemployment, which look small, and not with the short-term economic and social costs associated with the greater cyclical volatility of unemployment around its steady state. Nevertheless, the possibility that these short-term costs are real should be kept in mind. Easing labour scarcity by tolerating more unemployment, whether of the short- or long-term variety, is an outcome our policies should try to avoid.
The other way rising immigration may have impacted aggregate labour shortages is by moving the vertical position of the entire Beveridge curve up or down in the unemployment-job vacancy space. Ultimately, we want to know whether rising immigration has increased the job vacancy rate and worsened labour shortages, or whether it has decreased the vacancy rate and alleviated the shortages, at every given level of unemployment.
The combined visual evidence presented by Figures 4 to 8 above implies that the Beveridge curve did shift upward somewhat from the pre-pandemic to the post-pandemic period, particularly due to a persistent 20 percent drop in job matching efficiency. Has rising immigration in Canada contributed to this evolution? Bowlus, Miyairi and Robinson (2016) conducted a longitudinal study of the job search behaviour of immigrants to Canada in 2002-2007. Results imply that heightened immigration may reduce matching efficiency in the short run, as new immigrants often face a lower rate of job offers than natives during their initial integration period. Based on US data, Barnichon and Figura (2015) focused on the two primary determinants of aggregate matching efficiency: worker heterogeneity and labour market segmentation. They pointed out that matching efficiency would decline if workers with a lower-than-average search efficiency became more represented among job seekers, or if the dispersion between tight labour submarkets and slack ones increased. These two conditions would seem to apply to the Canadian context with rising immigration. Lu and Hou (2023) have identified a major shift of immigration toward lower-skilled workers, and a significant relative tightening of labour markets such as construction, accommodation, food, business support services, education, healthcare, and social services. The statistical analysis below will provide a test of whether in recent years rising immigration has in fact shifted the Beveridge curve upward and intensified labour scarcity, or not.
Rising immigration is not the only macroeconomic development that may conceivably have affected aggregate labour shortages in the post-pandemic period. It is entirely conceivable that some of the changes triggered suddenly by the pandemic shock may have persisted into the post-pandemic era. Potentially, the most important of these is the widespread shift to work from home (Aksoy et al. 2023). The pandemic can be seen as a mass natural experiment that brought millions of workers in Canada, and other countries, to suddenly experience more work from home, to value its benefits, and to stick to it thereafter, often with a surprising upside in productivity.
The percentage of Canadian workers aged 15 to 69 who work most of their hours from home was 7 percent in early 2020. It sprang to 41 percent in the great confinement month of April 2020, and then declined as the pandemic evolved and faded out. But it was still holding up around 20 percent in the first half of 2024, which was three times as large as the 7 percent of early 2020.
The large increase in the percentage of Canadians working primarily from home has introduced an increase in worker heterogeneity compared to the pre-2020 period. With more workers satisfied with their work from home, fewer are incentivized to seek new jobs, particularly of the traditional variety. Following the Barnichon and Figura (2015) result, this could partly explain the reduction in job matching efficiency that has so far kept the Beveridge curve at a higher level than otherwise.
The economic logic developed in this section suggests that rising immigration and increased work from home may have contributed to the 20 percent loss of matching efficiency that has kept the post-pandemic height of the Canadian Beveridge curve at a level higher than before the pandemic. (However, fully confirming this hypothesis is beyond the scope of this study).
Statistical Analysis
This section summarizes an analysis of the factors influencing job vacancies in Canada, focusing on immigration and the rise of work-from-home arrangements. Introducing the rate of work from home as a factor is done to verify whether the shift to work from home that was initiated by the pandemic, but persisted in 2022-2024 (Schirle 2024), affected the position of the Beveridge curve.5
The analysis spans six Canadian regions – Atlantic Canada, Quebec, Ontario, the Prairies (Manitoba and Saskatchewan), Alberta, and British Columbia – across the periods from 2015 to 2019 (pre-pandemic) and 2022 to 2024 (post-pandemic).
Table 1 summarizes the key findings of the statistical results. Consistent with expectations, it shows that the Beveridge relationship between vacancies and unemployment is negative, with a precisely estimated elasticity of -1.42 in the two models. The results also show that immigration has been a significant contributor to the rise in job vacancies in Canada. Specifically, Model 1 estimates that a one percentage point increase in the immigration rate is associated with an 8.12 percent increase in the job vacancy rate after one year. It suggests that rising immigration has pushed the Beveridge curve upward, increasing the job vacancy rate at each unemployment rate over the period. However, when accounting for the rise in work-from-home arrangements in Model 2, the effect of immigration is smaller, at 3.21 percent,6 reflecting the additional impact of remote work.7 The positive effect of work-from-home arrangements is estimated at 0.85 percent.
These results suggest that both factors – immigration and remote work – have played a significant role in pushing the Beveridge curve upward, making it more difficult to match available workers with job openings.
While both factors contribute to the rise in job vacancies, their high correlation complicates the ability to isolate their individual effects. The correlation between immigration and remote work is particularly strong, which makes it challenging to assess their independent impacts.8 As a result, the evidence for immigration’s effect on job vacancies in Model 2 is less powerful than it would be if the data allowed sharper estimation.9 However, the findings from Model 2 indicate that the combined effects of both immigration and remote work have contributed to higher job vacancies, suggesting that increasing immigration alone is unlikely to solve labour shortages in the short term.
To be specific, statistical calculation of Model 2 indicates an 82 percent chance that rising immigration has left the job vacancy rate unchanged or raised it, and only an 18 percent chance that it has lowered it.10 In other words, increased immigration is more than four times as likely to have raised the aggregate demand for labour by as much as, or more than, the supply than to have increased it by less than the supply. In short, it is unlikely that rising immigration in Canada has helped the country solve its economy-wide problem of labour shortages by reducing the job vacancy rate at any given unemployment rate.
A natural question is whether the effect of immigration on job vacancies varies between permanent and temporary immigration. So far, an expanded version of Model 2, which distinguishes between these factors by analyzing the permanent and temporary immigration rates separately, has found no significant difference in their four-quarter total effects.11 Future analyses could benefit from disaggregating data by industry, as the impact of immigration and working from home may vary across sectors. For instance, remote work affects sectors like technology differently than it does retail or construction.
Discussion and Conclusion
This paper’s conclusion, drawn from statistical analysis of the macrodata runs, is contrary to the views of business organizations, which have campaigned relentlessly in favour of increases in permanent and temporary economic immigration in the past several years (e.g., Business Council of Canada 2022; Canadian Manufacturers & Exporters 2023; Canadian Federation of Independent Business 2021; Conseil du patronat du Québec 2022). Their position is understandable and grounded in a genuine concern to address labor shortages. By filling the vacancies, economic immigration enables firms to produce more and maintain or increase profitability.
The evidence presented here does not question the important role immigration can play for individual employers, whose need for additional employees is acute and urgent. However, in economics, everything depends on everything. The direction and importance of a phenomenon, confirmed at a microeconomic level with regard to a particular business, government organization, or sector, can be different or even reversed at the macroeconomic level, once all spillovers into the rest of the economy are accounted for. In his 1955 introductory textbook, the renowned American economist Paul Samuelson warned against the risk of the “fallacy of composition,” where it is assumed that what is true for individual parts is automatically true for the whole economy.
In the case of immigration, the fallacy of composition consists of believing that the advantages accruing to employers that hire immigrants can simply be added up and said to extend to the whole economy. What the present study has uncovered is that this belief is not corroborated by the macroeconomic evidence from the recent experience of Canadian regions. It is true that immigration eases up the dearth of personnel in firms that hire newcomers, which is clearly a good thing. But it is also true, conversely, that it worsens the shortage of labour in industries that must cater to the additional demand for goods and services generated by the addition to total GDP. The induced increase in the demand for labour in the aggregate economy can offset or even exceed the initial expansion of supply, so that it contributes to amplify economy-wide labour shortages on net. The insights I have extracted from Canadian regional data suggest that rising immigration has more likely redistributed or increased labour scarcity across the economy than reduced it overall. The political implication is that, if labour shortages persist or increase in the whole of the country despite fast-rising immigration, the insistent demand of business organizations for more immigration will not calm down; labour shortages will persist or intensify.
The vision of immigration as an economy-wide offset to labour scarcity is also reductionist. To take account solely of the hoped-for benefits accruing directly to employers of new immigrants overlooks the fact that immigration is a global and transformative phenomenon. The purpose of immigration is not only to serve the interests of a particular group. It is of concern to a whole society for reasons that are no doubt partly economic, but also demographic, cultural, social, and humanitarian. Society is morally obligated to welcome and integrate all immigrants in the most humane manner. This requires much time and money. Society must also make sure that the pace of immigration is not so fast that it leads ethnic groups to “hunker down” (as Putnam 2007 found) and provokes serious economic disequilibria in sectors that must absorb the induced increase in demand, such as construction, housing, health, education and social services. The overall pace and composition of immigration must balance individual interests against the challenges it brings to society.
Among these costs are the negative potential repercussions on productivity and wage growth stemming from the open-door immigration policy that Canada has followed until recently. Two key implications merit attention. First, investment in housing, business investment to equip newcomers with required physical and human capital, and government investment in public infrastructure to provide social services have not been able to keep pace with fast-rising immigration. Second, the open-door policy has made it easy for employers to rely on low-skilled foreign workers to meet high labour demand, which has been concentrated in low-wage industries (Lu and Hou 2023). While immigration alleviates immediate labour shortages, it may suppress wage increases that would otherwise occur as labour markets tighten and affect capital investments.
For example, in the 12 months leading to 2024Q3, overall wages increased by 4 percent, outpacing inflation at 2 percent, but sectoral differences were stark: wages grew by 3.2 percent in the business sector compared to 6.3 percent in the non-commercial sector. These dynamics suggest that wage growth patterns are influenced by a blend of short-term factors and structural shifts, including immigration trends.
Data also show that business sector labour productivity in Canada is on a slippery slope. From 2021Q3 to 2024Q3, output per hour went down cumulatively by 2.3 percent, whereas it would have gone up by 3.2 percent if it had increased at the same rate as in 1999-2019 (Statistics Canada, table 36-10-0206). While there are many factors behind this slowdown in productivity growth, the high immigration rate may have been a contributor.
In March 2024, the government suddenly announced a reversal of its immigration policy. Immigration Minister Marc Miller committed his department to cutting Canada’s non-permanent resident population from 6.5 percent of the overall population in early 2024 to 5 percent in early 2027. In November, details of the plan were set in the 2024 Annual Report to Parliament on Immigration (Government of Canada 2024, Annex 4). There would be 446,000 fewer entries of new non-permanent residents than exits in each of 2025 and 2026. Annual temporary immigration would be negative to this extent. The Annual Report also announced that the annual target for admissions to permanent immigration would be reduced from 485,000 in 2024 to 395,000 in 2025, 380,000 in 2026 and 365,000 in 2027.
If implemented as intended, scaling back the number of temporary and permanent immigrants will impact Canada’s aggregate labour supply significantly in 2025-2027. The working-age (15-64) population will stagnate instead of increasing by 800,000 or more, as it did in each of 2023 and 2024. An implication of the evidence reported above in Table 1 is that labour demand will likely decline alongside the reduction in labour supply because there will be 800,000 fewer consumers in the Canadian economy. While this policy reversal may not directly address the job vacancy rate, it could reduce vacancies by decreasing the overall demand for labour. As a result, while Canada’s aggregate GDP may contract, GDP per capita could increase, particularly if a smaller portion of national savings is directed toward demographic investments and the composition of immigration shifts toward fewer low-skilled immigrants.
The government’s policy reversal is a first step toward moderation. While it presents challenges, it also offers opportunities for improvement. When employers do not have the luxury of recruiting a rising stream of newcomers who are willing to accept low wages, it may push them to invest more in technology and work reorganization, and hence increase productivity. Furthermore, with a more moderate immigration level, the issue of the lack of absorptive capacity in the economy to provide enough skill-equivalent jobs to high-skilled immigrants will be less acute. Immigrants will see their skill utilization increase and their overqualification rate decrease. This shift could enhance Canada’s ability to attract global talent, aligning with the 2016 recommendation from the Advisory Council on Economic Growth that immigration should help address the shortage of high-skilled workers.
Appendix: Statistical Methodology and Data
This appendix provides a detailed description of the statistical analysis conducted to assess the factors influencing the job vacancy rate in Canada. The analysis spans 27 non-pandemic quarters, covering two periods: 2015Q2 to 2019Q4 (pre-pandemic) and 2022Q4 to 2024Q3 (post-pandemic). It includes data from six Canadian regions – Atlantic Canada, Quebec, Ontario, the Prairies (Manitoba and Saskatchewan), Alberta, and British Columbia. Each of these regions has a population of more than 2 million.
The dataset consists of 162 observations, representing the six regions across the 27 quarters. All labour market and population data are sourced from publicly available Statistics Canada tables. The job vacancy rate and unemployment rate are expressed as ratios of seasonally adjusted job vacancies and unemployment to the labour force. These variables are logarithmically transformed to account for the convexity of the Beveridge curve.
To estimate the relationship between job vacancies and its key determinants, two regression models are specified:
• Model 1 includes the unemployment rate, the immigration rate (measured as the total number of new permanent immigrants and net additional non-permanent residents relative to the population, annualized), and three unconstrained lagged values of the immigration rate.
• Model 2 builds upon Model 1 by including the rate of work from home as an additional explanatory variable. The work-from-home rate is the fraction of workers aged 15 to 69 who work most of their hours from home in their main jobs. This model tests whether the pandemic-induced shift to remote work, which persisted post-pandemic, has affected the Beveridge curve and the job vacancy rate.
Both models incorporate regional and seasonal fixed effects to account for regional disparities and seasonal fluctuations in the labour market.
The author is grateful to Mario Fortin, Gilles Grenier, Jeremy Kronick, Nicolas Marceau, Parisa Mahboubi, Pascal Michaillat, Mario Polèse, Statistics Canada data analysts, Mikal Skuterud, Daniel Schwanen, Christopher Worswick and several anonymous referees for valuable comments and suggestions. The author retains responsibility for any errors and the views expressed.
References
Advisory Council on Economic Growth. 2016. “The Path to Prosperity: Resetting Canada’s Growth Trajectory.” Report of the Advisory Council on Economic Growth to the Minister of Finance of Canada. October.
Ahn, Hie Joo, and Leland Crane. 2020. “Dynamic Beveridge curve accounting.” Finance and Economic Discussion Series 2020-27. Board of Governors of the Federal Reserve System, Washington. March.
Aksoy, Cevat Giray, Jose Maria Barrero, Nicholas Bloom, Steven Davis, Mathias Dolls and Pablo Zarate. 2023. “Working from home around the world.” Brookings Papers on Economic Activity, Fall 2022, 281-330.
Archambault, Richard, and Mario Fortin. 2001. “The Beveridge Curve and Unemployment Fluctuations in Canada.” Canadian Journal of Economics 34(1): 58-81.
Bank of Canada. 2024. Monetary Policy Report. Ottawa, January.
Barlevy, Gadi, Jason Faberman, Bart Hobijn and Ayşegül Şahin. 2024. “The Shifting Reasons for Beveridge Curve Shifts.” Journal of Economic Perspectives 38(2): 83-106.
Barnichon, Régis, and Andrew Figura. 2015. “Labor market Heterogeneity and the Aggregate Matching Function.” American Economic Journal: Macroeconomics 7(4): 222-249.
Beveridge, William. 1960. Full Employment in a Free Society. Second edition. London: Allen & Unwin.
Blanchard, Olivier, and Peter Diamond. 1989. “The Beveridge Curve.” Brookings Papers on Economic Activity (1)1-67.
Blanchard, Olivier, Alex Domash, and Lawrence Summers. 2022. “Bad news for the Fed from the Beveridge space.” Policy Brief. Peterson Institute for International Economics. July.
Bok, Brandyn, Nicolas Petrosky-Nadeau, Robert Valetta, and Mary Yilma. 2022. “Finding a soft landing along the Beveridge curve.” Economic Letter. Federal Reserve Bank of San Francisco. August.
Bowlus, Audra, Masashi Miyairi and Chris Robinson. 2016. “Immigrant job search assimilation in Canada.” Canadian Journal of Economics 49(1): 5-52.
Dion, Richard, and David Dodge. 2023. “Labour force growth and labour market gap in Canada: 2011 to 2032.” Working Paper. Ottawa: Bennett Jones, May.
Doyle, Matthew, Mikal Skuterud and Christopher Worswick. 2024. Optimizing Immigration for Economic Growth. Commentary No. 662. Toronto: C.D. Howe Institute.
Elsby, Michael, Ryan Michaels and David Ratner. 2015. “The Beveridge Curve: A Survey.” Journal of Economic Literature 53(3): 571-630.
Fortin, Pierre.2024. “Does immigration help alleviate economy-wide labour shortages?” Working Paper #70, Canadian Labour Economics Forum, University of Waterloo. May.
Government of Canada. 2024.2024 Annual Report to Parliament on Immigration. Immigration, Refugees and Citizenship Canada. October.
Hazell, Jonathon, Juan Herreño, Emi Nakamura, and Jón Steinsson. 2022. “The Slope of the Phillips Curve: Evidence from US states.” Quarterly Journal of Economics 137(3): 1299-1344.
Lam, Alexander. 2022. “Canada’s Beveridge curve and the outlook for the labour market.” Staff Analytical Note 2022-18, Bank of Canada, Ottawa. November.
Lu, Yuqian, and Feng Hou. 2023. “Foreign workers in Canada: distribution of paid employment by industry.” Economic and Social Reports. Catalogue No. 36-28-0001. Ottawa: Statistics Canada. December.
Mahboubi, Parisa, and William Robson. 2018. “Inflated Expectations: More Immigrants Can’t Solve Canada’s Aging Problem on Their Own.” E-Brief. Toronto: C.D. Howe Institute.
Michaillat, Pascal, and Emmanuel Saez. 2021. “Beveridgean unemployment gap.” Journal of Public Economics Plus 2. December.
Morissette, René, Vincent Hardy and Voltek Zolkiewski. 2023. “Working most hours from home: new estimates for January to April 2022.” Analytical Studies Branch Research Papers Series. Catalogue no. 11F0019M, No. 472. Ottawa: Statistics Canada. July.
Pissarides, Christopher. 2000. Equilibrium Unemployment Theory. Cambridge MA: MIT Press.
Putnam, Robert. 2007. “E Pluribus Unum: Diversity and community in the twenty-first century: The 2006 Johan Skytte Prize Lecture.” Scandinavian Political Studies 30(2): 137-174.
Romer, Christina, and David Romer. 2019. “NBER business cycle dating: Retrospect and prospect.” Paper prepared for the session “NBER and the Evolution of Economic Research, 1920–2020” at the ASSA Annual Meeting, San Diego, California, January 2020. Department of Economics, University of California, Berkeley.
Samuelson, Paul. 1955. Economics: An Introductory Analysis. New York: McGraw-Hill.
Schirle, Tammy. 2024. “Settling into a New Normal? Working from Home across Canada.” E-Brief. Toronto: C.D. Howe Institute.
Shimer, Robert. 2012. “Reassessing the Ins and Outs of Unemployment.” Review of Economic Dynamics 15(2): 127-148.
Our friends at MSN have really stirred the maple syrup pot up with this story- which one of the following companies is the most surprising for you? Leave us a note in the comments section at the bottom of the article.
Many beloved Canadian brands that fill shopping carts and homes across the country have something surprising in common—they’re actually owned by foreign investors and companies. Behind familiar logos and proud Canadian histories stand international corporations that have quietly acquired these businesses, often maintaining their strong local identity while decisions are made overseas.
This eye-opening list reveals 8 well-known Canadian companies that now operate under foreign ownership.
While these businesses still employ thousands of Canadians and remain important parts of communities nationwide, their profits and major corporate choices flow to boardrooms in places like the United States, Europe, and Asia. Each example shows how Canada’s business landscape has evolved in today’s global economy.
A Canadian fast-food icon, Tim Hortons has been owned by Restaurant Brands International since 2014, with its headquarters in Toronto but major control from Brazil-based 3G Capital. The beloved coffee chain started in Hamilton, Ontario in 1964 as a single donut shop. Today, it serves millions of customers daily across Canada and has expanded into 14 countries. The Brazilian investment firm maintains the Canadian feel of the brand while pushing for global growth.
Hudson’s Bay Company, founded in 1670, is now owned by American businessman Richard Baker’s NRDC Equity Partners. The historic retailer shifted from Canadian ownership in 2008 through a $1.1 billion deal. HBC continues to operate The Bay stores across Canada while managing an extensive real estate portfolio. The company maintains its Canadian identity despite being controlled from south of the border.
The Montreal-based entertainment company, famous for its artistic circus shows, was acquired by TPG Capital, a U.S. private equity firm, in 2015. Following financial difficulties during the pandemic, ownership changed again in 2020 to a group including Catalyst Capital Group. The company still creates its shows in Montreal. The creative spirit of Cirque remains distinctly Quebec-based despite foreign investment control.
The luxury winter coat maker, started in Toronto in 1957, sold a majority stake to U.S.-based Bain Capital in 2013. The company continues to manufacture its core products in Canada, maintaining its made-in-Canada promise. The brand has expanded globally under foreign ownership while keeping its Canadian headquarters. The international success of Canada Goose proves that Canadian craftsmanship can thrive under foreign ownership.
The Canadian hardware retailer Rona underwent major ownership changes in recent years. After operating independently for decades, the Quebec-based chain was acquired by U.S. home improvement leader Lowe’s in a $3.2 billion deal completed in 2016. However, Lowe’s ownership proved relatively short-lived. In 2023, the American retailer divested Rona, selling it to Sycamore Partners, a private equity firm headquartered in New York, for $2.4 billion. Despite these corporate transitions, Rona maintained its distinct brand identity in the Canadian home improvement marketplace.
Ontario-based CARA Operations (now Recipe Unlimited) purchased Quebec’s St-Hubert restaurants for $537 million in 2016. The restaurant chain, founded in Montreal in 1951, maintains its distinct Quebec identity. Multiple foreign investment firms hold significant stakes in Recipe Unlimited through the parent company MTY Food Group. The company continues operating across Quebec while major business decisions are made outside the province.
In 2019, Toronto-based Onex Corporation acquired Westjet for $5 billion, with significant backing from international investors and foreign private equity firms. The airline maintains its headquarters in Calgary and continues operating as a Canadian carrier. Major foreign institutional investors hold substantial positions through Onex Corporation. While preserving its Canadian operations, the company’s ownership structure includes significant international investment.
Suncor Energy owns Petro-Canada stations, with significant foreign institutional investors holding major stakes. The company merged with Suncor in 2009 in a $19 billion deal. Petro-Canada remains a prominent Canadian retail fuel brand. International investment firms hold substantial voting shares in the parent company.
Loblaw Companies Limited, a Canadian company, acquired Shoppers Drug Mart in 2014 for $12.4 billion. Despite its Canadian roots, the pharmacy chain has significant foreign institutional investment. Under this foreign ownership, Shoppers Drug Mart continues to expand its healthcare services across Canada.
Presenters at last year’s C.D. Howe Institute’s conference on Canada’s debt problem had some pointed advice for our federal and provincial governments:
Canada’s public debt should be reduced about 10 percentage points of Canada’s GDP to ensure fiscal policy can be used to cushion the effects of future economic crises. Since major crises happen frequently, prudence suggests that the target should be achieved before the decade is out.
Tax increases harm economic performance, so elimination of public spending that does not provide enough benefits to offset this damage should be the first step in reducing deficits and debt. This will require undertaking comprehensive value-for-money assessments to identify wasteful spending.
Post-conference analysis found that achieving this prudent debt target would require increasing the combined federal-provincial primary balance by 1.4 percent of GDP, or $43 billion, starting in 2025/26. This amount includes a buffer – ensuring an 80 percent probability of meeting the debt target – to account for inevitable economic downturns, other crises that raise deficits and debt, and the uncertainty posed by fluctuating interest rates on financing costs.
The conference was one of four on deficits and debt held in Canada over the past 40 years. A clear and consistent message from these conferences – which politicians have yet to fully absorb – is that debt has economic costs and, therefore, imposes a burden on future generations. In this Commentary, the authors report on, and offer their analysis of, the findings of the latest conference.
Introduction
Does Canada have a debt problem? The answer from a recent C.D. Howe Institute conference is a resounding “yes.” Canada’s public debt should be about 10 percentage points of GDP lower to ensure sustainability. Given that major crises, which put upward pressure on deficits and debt, happen frequently, this target should be achieved before the decade is out.
The May 2024 conference was one of four on deficits and debt held in Canada over the past 40 years. Each aimed to provide guidance to policymakers on managing deficits and debt. While a common thread was concern about the economic cost of public debt, each conference provided context-specific policy advice.
The first conference, “Deficits: How Big and How Bad?” (Conklin and Courchene 1983), occurred when debt levels were rising rapidly but still relatively low. The key policy issue then was whether fiscal consolidation or expansion to support the economy was appropriate.
In the 1994 conference, “Deficit Reduction – What Pain, What Gain?” (Robson and Scarth 1994), and the 2002 conference, “Is the Debt War Over?” (Ragan and Watson 2004), there were clear recommendations to reduce debt levels. In 1994, this was motivated by concerns over economic damage caused by debt approaching 100 percent of GDP and questions about fiscal sustainability. By 2002, although the debt ratio had fallen substantially, further debt reduction was still advocated to reduce the burden on future generations who will not benefit from the spending.
A combination of discretionary measures and sustained economic growth led to a substantial reduction in the combined federal-provincial debt ratio from 2002 until the global financial crisis of 2007-2009. The debt ratio stabilized at a relatively high level after the crisis until the pandemic. The massive increase in debt during the pandemic and subsequent government spending raised the overall federal-provincial net debt ratio to about 75 percent of GDP, nearing levels from the time of the “Debt War” conference. This surge, combined with concerns about further increases, refocused attention on debt sustainability. This concern was reflected in the May conference, “Does Canada Have a Debt Problem?”, which recommended a debt target based on the need for fiscal prudence.
The latest conference included sessions on the economic costs of debt, the sustainability of federal debt, guidance for policymakers on a prudent and fair debt target, and reforming the federal fiscal framework. However, given the one-day format, not all issues could be thoroughly addressed. This report not only summarizes the proceedings but also fills some gaps by providing additional analysis to complement the presenters’ advice.
Economic Costs of Public Debt
Interest expenses were central to the analysis by University of Calgary economist Trevor Tombe of the economic costs of public debt. Interest paid on the public debt is often considered a transfer among individuals with no real impact on the economy. However, higher interest payments for a given level of program spending necessitate higher taxes, which harm economic performance by affecting incentives to work, save and invest. If not financed by tax increases, higher interest payments will crowd out valued program spending.
When discussing the opportunity cost of interest payments – the benefits of lower tax rates or higher program spending – Tombe cited work by Dahlby and Ferede (2022). They estimate the economic cost of raising an extra dollar of tax revenue, referred to as the “marginal cost of public funds” (MCPF). The MCPF includes both the dollar taken from the private sector and the loss in output per dollar of tax revenue raised due to reduced incentives to work, save and invest. Higher taxes shrink the tax base not only because of reduced economic activity but also due to efforts to reduce taxable income without changing economic behaviour.
Dahlby and Ferede (2022) find a very high cost from raising taxes. For the corporate income tax, the federal MCPF in 2021 was approximately two.1The MCPF from raising the top federal personal income tax rate has been higher than its corporate tax counterpart since 2012, when the corporate tax rate was reduced to 15 percent. The gap increased in 2016 when the top federal marginal personal income tax rate increased to 33 percent, pushing the MCPF to about 2.9.
The federal government expects to pay $54.1 billion in public debt charges in the current fiscal year. The economic cost of these payments is substantial. If the opportunity cost of these payments is lower corporate income taxes, their economic cost would also be about $54 billion. If their opportunity cost is a lower top personal income tax rate, their economic cost would exceed $100 billion. If the contribution from corporate income and top personal income tax were equal, the economic cost would be about $75 billion.
Other costs of public debt arise from a reduction in the national savings rate, which is the sum of public and private sector savings rates. Government deficits represent public sector dissaving, so with a constant private savings rate, national savings will decline when governments run deficits. Tombe highlighted the impact of lower national savings on investment, presenting data showing a negative correlation between debt ratios and investment ratios across countries (Figure 1). He stated there is “probably” a causal relationship between higher debt ratios and lower investment ratios.
Although Tombe did not elaborate, there are reasons to be circumspect about asserting causality. One reason is that the private savings rate may rise in response to budget deficits if economic agents anticipate higher future taxes to service the debt. Households might increase savings in anticipation, partially offsetting the decline in national savings. There is evidence that expansionary fiscal policy is partially offset by increased household savings. Johnson (2004) concluded that household savings would increase by 30-50 percent of the increase in government debt. In a recent study of fiscal expansions in the Euro area from 1999 to 2019, Checherita-Westphal and Stechert (2021) found that 19 percent of a fiscal stimulus is offset by higher household savings in the short-term, rising to 41 percent in the long-term.
Another reason for being cautious about inferring causality is that in an open economy, a decline in national savings does not necessarily lead to lower domestic investment, as any shortfall can be offset by borrowing from abroad. However, interest payments on borrowed funds and the return on foreign-owned capital reduce national income. An additional cost arises because the resulting current account deterioration must be offset by higher net exports, which requires a reduction in real wages in the export sector.
To complement Tombe’s analysis, we present an estimate of the economic cost of reduced national savings. In a closed economy with constant household savings, a budget deficit leads to a dollar-for-dollar crowding out of investment. Using historical returns on capital and assuming that national savings decline by 60 percent of the deficit due to offsetting increases in household savings, the $1,372 billion in federal net debt in the current fiscal year would have an economic cost of about $90 billion.2 This calculation does not capture the impact of lower capital intensity on productivity, so it underestimates the true cost.
If foreign savings offset the decline in national savings and foreigners invest directly in Canada, they receive the return on this capital, so the gross economic cost remains the same. However, the return is subject to corporate income tax, so the net economic cost would be about 25 percent lower. If Canadian firms borrow abroad to finance domestic investment, the economic cost is the interest paid to foreigners. While gross interest payments to foreigners will be less than the return on capital unless there is a large country-risk premium, interest payments are taxed more lightly.3 Therefore, the net economic cost may not differ substantially.
An additional cost of accessing foreign savings arises because higher capital servicing charges put downward pressure on the current account balance, which must be offset by an increase in net exports. In a small economy, export and import prices are determined in world markets, so the increase in net exports requires a decline in real wages in the export sector. However, if a country’s exports have unique features, increased supply can lower export prices, adding to the economic cost of borrowing from abroad (Burgess 1996).
Calculating the economic cost of investment crowding out when foreign borrowing is possible as the net-of-tax return on capital paid to foreigners establishes a minimum cost because it excludes the reductions in real wages required to increase net exports. The minimum cost would, therefore, be 0.75 x $90 billion = $68 billion, where the $90 billion reflects the economic cost of lower investment, adjusted by a factor of 0.75 to represent corporate income taxes on the returns paid to foreign investors. The $75 billion cost associated with raising taxes to finance higher federal interest expenses does not change with the availability of foreign financing, so the overall cost of the federal debt is approximately $142 billion, or 4.7 percent of GDP in 2024/25.
A similar calculation can be performed for overall provincial debt. In 2021/22, provincial net debt amounted to $784.7 billion, with debt service charges of $30.6 billion. Using the same weighted average economic cost of taxation as for the federal government, the economic cost of provincial debt service charges was $42 billion. The cost of investment crowding out adds another $39 billion, bringing the total cost of debt at the provincial level to $81 billion, or 3.2 percent of GDP in 2021/22. Assuming provincial debt remains at the same percentage of GDP from 2021/22 to 2024/25, the overall cost of Canada’s debt is about 8 percent of GDP.
Benefits of Debt and Its Optimal Level
Tombe also discussed the benefits of public debt, noting its role in financing long-lived assets, stabilizing the economy and smoothing tax rates over time. Governments should borrow to finance investments that will benefit future generations and should finance current expenditures out of current taxes. Spending on education, health and knowledge creation raises special concerns because it benefits both current and future generations. However, since each generation must make these investments, financing them through current revenues typically aligns with the benefit principle.
Counter-cyclical fiscal policy enhances social well-being by mitigating costly deviations from full employment. Additionally, governments can reduce the harmful effects of distortionary taxes by keeping them stable. Since the efficiency cost of taxes is higher when rates are above average than when rates are below average,4 governments should set tax rates at levels sufficient to support expected spending over the cycle and allow deficits to rise and fall in response to unexpected expenditures.5
An issue absent from discussions at the conference was the role of public debt in addressing market imperfections, which can improve efficiency. One such imperfection is the lack of adequate insurance markets against individual-specific wage income losses. As a result, individuals “self-insure” by increasing savings, which is more costly than paying the premiums in a well-functioning insurance market. Public debt puts upward pressure on interest rates and provides a safe savings instrument, allowing households to reduce their savings closer to the efficient level.
Unlike the efficiency gains from using public debt to stabilize the economy and smooth tax rates, mitigating the impact of inadequate insurance markets may justify a permanent increase in public debt. With a well-functioning insurance market, the optimal public debt ratio would be negative – governments should be net savers rather than net debtors. This would allow governments to finance expenditures from interest received on assets rather than from distortionary taxes.6
Empirical issues raised by the inadequate insurance-market approach include whether correcting the market failure is sufficient to make the optimal debt ratio positive and whether the penalty for deviating from the optimal ratio is significant enough to affect the choice of a debt target. Early analyses of incomplete markets found a positive optimal debt ratio. For instance, Aiyagari and McGrattan (1998) calculated an optimal debt ratio of 66 percent of GDP for the US economy. However, Peterman and Sager (2018), using a model with many of the same features as Aiyagari and McGrattan but incorporating multiple generations with standard life cycles instead of a single generation with an infinite life span, found that net government saving is optimal in the US economy. The main reason for the different result is that individuals in a life-cycle model spend a substantial fraction of their working lives accumulating enough savings to make self-insurance possible, so the benefit from self-insurance is smaller than if infinite life spans are assumed.
These results are less relevant for Canada for two reasons. First, employment insurance and other income support measures are more generous in Canada, so self-insurance leading to excess saving is less of an issue. Second, the US analysis assumes deficits are financed entirely by domestic savings, which is a much less realistic assumption for Canada. Foreign borrowing reduces the optimal debt ratio because it lessens the upward pressure on interest rates, which diminishes the impact of public debt on “self-insurance” savings and raises the cost of debt. James and Karam (2001) modified the Aiyagari and McGrattan model to allow borrowing from abroad, which changes the optimal debt ratio from 66 percent to about -80 percent. This qualitative result – that access to foreign savings reduces the optimal debt ratio – has been confirmed by other researchers (Nakajima and Takahashi 2017; Okamoto 2024; and Cozzi 2022).
This review suggests that the inadequate-markets approach does not reverse the conclusion from standard models that the optimal debt ratio is negative, implying that welfare gains can be realized when debt levels are reduced. However, the studies reviewed indicate that the penalty for deviating from the optimal debt ratio is small. In three of the six optimal debt studies reviewed, it is possible to compare the estimated economic costs. In the Peterman/Sager and Nakajima/Takahashi studies, a one-percentage-point increase in the debt ratio reduces consumption by .003 percent. The corresponding figure in the Cozzi study is much higher, approximately .02 percent. These estimates are very low relative to the estimates presented earlier, which imply a loss of .05 percent per percentage-point increase in the debt ratio.
It seems likely that these models are substantially understating the cost of debt. The benefits would have to be understated by an even larger percentage to overturn the conclusion that governments should be creditors not debtors. Since the argument for incurring debt to improve market efficiency is weak, the debt ratio should be chosen by considering only its impact on generational fairness. However, since debt is one of several factors affecting generational transfers, debt policy may have to deviate from the benefit principle to achieve a desired balance of the well-being of current and future generations.
Sustainability Analysis
High debt also raises concerns about its prudence or sustainability: can the interest expense be financed without requiring tax increases or cuts in program spending in the future? In his presentation, Alex Laurin, the Institute’s Vice President and Director of Research, challenged the federal budget’s claim that federal public finances are sustainable (Canada 2024, 382). The federal government’s sustainability claim is based on long-term projections showing a continuously declining debt-to-GDP ratio, reaching nine percent by 2055/56. Moreover, this trend holds even with less optimistic assumptions about interest rates and economic growth.
Laurin argued that this projection is not a convincing demonstration of sustainability for three reasons:
1) Interest Rate Assumptions: In the base case, the effective interest rate on federal debt (r) remains below the growth rate of the economy (g) for 32 years, which puts continuous downward pressure on the debt ratio. This assumption is inconsistent with the historical record. Over the past 35 and 45 years ending in 2022/23, averages of r-g are positive, at 0.8 and 0.4 percentage points, respectively. Only when the averaging period is extended back to include the high-inflation period starting in the 1970s does the multi-year average turn negative.7
2) Program Spending Assumptions: While revenues are assumed to grow in line with GDP, program spending decreases by about one percentage point of GDP over the projection period, causing the primary surplus to rise and putting downward pressure on the debt ratio. A more realistic “no policy change” assumption would keep the share of program spending roughly constant, allowing an assessment of the sustainability of current spending levels.
3) Exclusion of Economic Downturns: The projection fails to explicitly include economic downturns. Over the last 60 years, Canada has experienced five recessions, each prompting discretionary temporary stimulus measures that permanently increased debt. The policy response averaged 1.09 percentage points of potential GDP for each percentage point deviation from potential GDP (Table 1).
Laurin presented an alternative debt projection, assuming that overall program spending grows in line with GDP from 2029/30 to 2055/56 and that r equals g on average over the projection period.8 With these changes, the decline in the federal debt ratio is less pronounced, reaching 29 percent in 2055/56 compared to 9 percent in the budget projection.
Economic downturns were included in the projection by simulating 1,000 random probabilistic scenarios – assuming the frequency and magnitude of recessions over the past 60 years are representative of the future. Laurin assessed debt sustainability by calculating the probability that the debt ratio remains at or falls below its initial value over the projection period.9 The simulations showed an even chance that the debt ratio will exceed its 2028/29 value late in the projection period. Under the International Monetary Fund’s classification (IMF 2022), Canada’s federal debt would be considered unsustainable.
Some conference participants suggested that Laurin’s analysis might not fully capture the risks associated with the federal fiscal position because it assesses a single r-g profile. They also emphasized the importance of including provincial and territorial governments in any sustainability analysis, as these levels are most affected by demographic aging.
For this report, Laurin modified his approach to include provincial and territorial governments’ net debt and to capture the risks of r-g deviating from its assumed zero average over the long term. He introduced variability in the interest-rate growth-rate gap based on historical data, allowing for a more comprehensive risk assessment (methods and assumptions are provided in Appendix).
The modified analysis showed that, without any simulated shocks, the combined federal and provincial/territorial net debt-to-GDP ratio initially declines and then stabilizes until 2041/42, when rising healthcare costs due to demographic aging – and the associated interest on provincial debt – cause it to rise steadily (Figure 2, black dashed line). Introducing interest rate and recession shocks significantly alters the outlook, indicating a 50 percent chance that the debt ratio will begin its long-term rise in 2035/36, eventually surpassing 100 percent of GDP (black dotted line). There is a 20 percent chance (the 80th percentile) that the debt ratio will not decrease substantially from its current level and start a steady increase in 2033/34 (grey dotted line). Conversely, there is only a 20 percent chance (the 20th percentile) that the ratio will stay below its near-term value for the entire projection period (gold dotted line).
A Prudent and Fair Target
Prudence
According to McGill economist Christopher Ragan, the main concern about Canada’s high public debt is that it will reduce our ability to borrow to address the next economic crisis. He analysed this issue using three zones for the debt ratio: red (top), yellow (middle) and green (bottom) (Figure 3). The red (top) zone, which represents unsustainable debt, starts roughly five percentage points below the 1995 federal-provincial debt ratio’s peak of 100 percent, when Canada entered a period of “forced austerity.” This entry point to the red (top) zone is higher than the 90 percent threshold for negative effects on growth developed by Reinhart and Rogoff (2010). However, the threshold would be lower if the interest rate on public debt (r) were higher than the rate of economic growth (g).
Ragan argued that the current combined federal-provincial debt-to-GDP ratio is in the yellow (middle) “cautionary” zone. The height of this zone is determined by the buffer required to avoid being pushed into the red (top) zone by an economic crisis. Entering the red (top) zone would mean sharply higher interest rates and lower growth.
To avoid this, Ragan set the buffer at 28 percentage points of GDP, about a quarter more than the increase in the debt ratio during the COVID-19 pandemic. Given the frequency of economic crises, he advocated returning to the green (bottom) zone by 2029/30, nine years after the end of the pandemic-induced recession. This requires reducing the federal-provincial debt ratio by about 10 percentage points.
Laurin followed up by determining the fiscal effort required to return to the green (bottom) zone with high probability. His calculations show that, starting in the next fiscal year (2025/26), the combined federal-provincial primary balance would need to increase permanently by 1.38 percent of GDP – or $42.9 billion in 2025/26.10 If implemented through spending reductions, provincial spending would have to decline by about 7 percent, or federal spending would have to fall by almost 9 percent. Note that such spending reductions would still not fully return the combined federal-provincial program spending/GDP ratio to its pre-pandemic 2018/19 value. The federal government could achieve the same effect by raising the GST to 8.5 percent. However, since most spending pressures from an aging population are on provincial governments, it would be sound policy for the federal government to transfer tax points to provincial governments (Kim and Dougherty 2020). Even with near-term fiscal adjustment, additional consolidation may be necessary in the future to prevent a rise in the debt/GDP ratio.
Ragan favoured achieving the debt target through expenditure restraint rather than raising taxes, which he thinks may have reached their limit. Restraining expenditures will be particularly challenging given medium-term pressures from an aging society, rising military and security needs, and potentially increased public investments for the transition to a green economy. Canada, therefore, needs an ongoing and thorough program review to identify low-priority spending.
Fairness
Financing current government spending with debt is generally considered fair if the debt-to-GDP ratio is constant or declining over time, implying that future generations can receive the same level of government services without facing higher tax rates. However, stable tax rates alone are insufficient to prevent intergenerational transfers. Taxes must increase to finance the interest on the debt or remain higher than they would be otherwise. If the tax increase applies to both current and future generations, tax rates would be stable but higher than they would be without the increased debt. The higher tax rates required to finance debt interest and the deficit-induced reduction in national-savings transfer part of the cost of government spending to future generations who do not benefit from the spending.
Assessing generational fairness requires understanding the extent of intergenerational transfers resulting from fiscal policy. The presentation by Parisa Mahboubi, a Senior Policy Analyst at the Institute, offered insights into this issue using generational accounts. These accounts show lifetime net taxes imposed by federal and provincial governments for each birth cohort from 1923 to 2023 and for a composite future generation consisting of all persons born after 2023. The lifetime tax burdens of the 2023 birth cohort and future generations are comparable because a complete life cycle is captured in both cases. Her analysis shows that future generations are expected to face a slightly higher lifetime net tax burden than the youngest living generation.
Preparing generational accounts requires information on lifetime taxes and transfers for each birth cohort alive today and for future generations. Projected values of taxes paid by current birth cohorts are developed based on age-specific profiles of different types of taxes,11 assuming unchanged tax policies. Spending on health, education, elderly benefits, child benefits, social assistance and GST credits vary by age, while other government expenditures are evenly distributed per capita. Per capita taxes, transfers and expenditures are assumed to grow at the same rate as productivity.
The lifetime net tax burdens for currently alive birth cohorts are calculated as the present value of projected tax payments less the present value of projected government transfers the cohort will receive. Lifetime net tax burdens of future generations are calculated using the “no free lunch” constraint: someone, sometime, must pay for all that the government spends (US Congressional Budget Office 1995). The lifetime net tax burden of future generations equals the amount of future spending not paid by currently alive generations.12
In the baseline scenario, productivity grows 0.94 percent annually, the average GDP per capita growth from 2002 to 2022. The discount rate is the average return on real return bonds over the same period, 1.3 percent.13 Statistics Canada’s medium-growth scenario14 is used for demographic projections, with population growing at an average annual rate of 0.85 percent over the 100-year projection, driven entirely by net immigration. The ratio of those over 65 to those aged 18-65 – the old-age dependency ratio – more than doubles over the projection period, rising from 30 percent to 72 percent (Figure 4).
The increase in the old-age dependency ratio drives upward trends in elderly benefits and health-related expenditures as a share of GDP. Other categories of age-specific spending remain roughly constant.
In the baseline scenario, the lifetime net tax burden of future generations (“unborn”) exceeds that of the cohort born in 2023 (“newborn”) by $23,000 per person (Figure 5). Factors influencing this result include:15
Fiscal Position in the Base Year: In 2023, federal and provincial tax revenues exceeded program spending by over one percent of GDP. A smaller primary surplus would have decreased the lifetime net tax burden of the newly born, increasing the burden on the unborn.
Population Growth: Faster population growth reduces the relative tax burden on future generations by slowing the rise in the old-age dependency ratio and reducing the per-capita burden of existing debt.
Healthcare Costs: If real healthcare costs increase faster than productivity growth, the recently born will pay a smaller share, leaving more for future generations.
The baseline assumptions represent the midpoint of a range of plausible values. While results are sensitive to changes in assumptions, the baseline is considered the most likely outcome. The generational accounts, therefore, suggest that fiscal policy is generationally fair.
However, other factors must be considered when assessing fairness:
Population Stability: If there were no net population growth, the tax burden on future generations would be much higher, even if the old-age dependency ratio did not change, because the cost of existing debt would be spread over a smaller population. This observation draws attention to the fact that future generations will be paying for services they did not receive, even with stable lifetime net taxes.
Income Growth: Future generations will likely be richer due to productivity growth, which could justify asking them to bear some costs of current consumption. However, parents may not wish to pass on costs to their children, even if incomes are rising over time. Population growth through immigration substantially reduces intergenerational linkages, which could encourage the current generation to increase the target size of intergenerational transfers.
New Spending Pressures: The generational accounts do not capture new pressures like rising military and security commitments or higher spending to achieve a net-zero emissions economy. In both cases, underspending in the past has pushed costs into the future. Pre-funding some of this spending by increasing taxes in the near term would even out contributions across generations.
Comparisons with Near Term Future Generations: Generational accounts compare a representative future generation with the most recent birth cohort. Comparing the tax burden of living generations with the burden on near-term future generations is also relevant.
While the generational accounts indicate that the federal-provincial fiscal stance is fair to future generations under current assumptions, it is beneficial to supplement this analysis with assessments over shorter time horizons. For example, virtually all living generations benefited from the debt-financed income stabilization and health measures implemented during the pandemic-induced recession. There is a strong fairness argument for paying down pandemic-related debt before the next generation starts working and paying taxes, which would occur over the 2035-to-2045 period (Lester 2021).
Federal and provincial Covid-related spending amounted to approximately $430 billion from 2020/21 to 2022/23.16 Federal and provincial debt was $2,092 million in 2022/23. Reducing the level of debt to $1,660 million no later than 2045/46 would be fair to generations born in 2019 and later. However, in Laurin’s prudent scenario, in which debt is sustainable with 80 percent probability, the level of debt rises continuously over the projection period. The gap between the prudent and fair level of debt is $1,200 million in 2035/36. Achieving a fair level of debt would require more fiscal consolidation than is needed to achieve sustainability.
Reforming Expenditure Management
Ragan’s debt target and the recommendation to achieve it through expenditure restraint raise two issues:
1) Building Consensus: How to build a consensus on the proposed debt target and increase the likelihood of achieving it.
2) Identifying Savings: How to identify programs that don’t provide enough value to justify raising taxes to finance them.
Economist and C.D. Howe Institute Fellow-in-Residence John Lester emphasized that achieving a political consensus on a more prudent fiscal approach requires vigorous and sustained advocacy. Part of this advocacy involves convincing governments to surrender some policy flexibility to increase the odds of achieving the target reduction in debt and reduce the risk of relapse after the next crisis.
Lester and Laurin (2023) propose a principles-based fiscal governance framework intended to reduce the bias toward deficit financing in both good times and bad. Governments should adopt guiding principles for fiscal policy, set operational rules for achieving target outcomes and transparently assess consistency with these principles.
At the conference, Lester expanded upon one element of the governance framework: a binding multi-year ceiling on non-cyclical spending. A key motivation for this proposal is the failure to adhere to spending tracks set out in budgets and fiscal updates. For example, in the federal government’s 2019 Economic and Fiscal Update, program spending was projected to decline as a share of GDP, reaching 13.8 percent by 2024/25. The spending ratio projected for 2024/25 increased in successive budgets so that in 2024-25 it will be almost 2 percentage points higher than projected in 2019.18
Binding multi-year expenditure ceilings apply in 11 OECD member countries (Moretti, Keller, and Majercak 2023).19 In the Netherlands and Switzerland, the ceilings are set out in legislation that constrains expenditure growth. Alberta has recently adopted a similar approach.20 However, in most countries, expenditure ceilings are set by the government to ensure consistency with its self-defined fiscal objectives, which may or may not include expenditure restraint. This is the general approach recommended for Canada, although the hope is that the self-defined objective will be to achieve the debt target through expenditure restraint.
The expenditure ceiling would be binding for five years, ideally developed in the first year of a new electoral mandate after a campaign outlining spending plans in detail. The ceiling would cover all categories of spending directly affected by policy decisions. It would be updated annually to account for forecasting errors in program determinants (e.g., inflation, population growth). There would be escape clauses for major economic recessions, natural disasters and war. The ceiling could include a reserve for new policy initiatives, but in the context of expenditure restraint new initiatives may need to be funded by eliminating or modifying existing programs.
Identifying the programs that should be scaled back or eliminated because they don’t provide enough benefits to justify raising taxes to finance them requires, according to Lester, an overhaul of the way the government manages its spending, particularly the performance management framework that is key to establishing value for money. Yves Giroux set the stage for this discussion by describing the federal government’s current expenditure management system.
The requirement to evaluate programs was formalized following the creation of the Office of the Comptroller General in 1978. Despite several modifications, program evaluations have not been successful in affecting strategic spending decisions. The Ministerial Task Force on Program Review (the Nielsen Task Force) from 1984 to 1986 described evaluations as “generally useless and inadequate for the work of program review” (quoted in Grady and Phidd 1993). More recently, McDavid et al. (2018, 302) conclude that evaluations do not “address questions that would be asked as cabinet decision-makers choose among programs and policies.”
Under the current evaluation policy, federal government departments have considerable flexibility in conducting evaluations. They may focus on design and delivery, program beneficiary responses or a comparison of program costs and benefits. A review of 48 evaluations prepared since 2020 in eight departments21 found that only four went beyond assessing operational efficiency and impacts on beneficiaries to examine whether the program represented value for taxpayer money. Three of these applied formal benefit-cost analysis, which is the standard for assessing regulatory proposals.22
Evaluating programs in terms of operational efficiency and beneficiary impacts helps improve programs, but if evaluations are to inform strategic spending decisions, value-for-money assessments must be mandatory. These assessments should be based on the benefit-cost framework applied to regulatory proposals.
Benefit-cost analysis of regulatory proposals – and by extension, spending programs – assesses the overall social benefits and costs of policy initiatives. The quantitative analysis attempts to determine if the economic pie is larger or smaller after government intervention. For example, economic development programs (business subsidies) are implemented with the expectation that they will increase overall real income. To assess this, benefit-cost analysis considers not only the additional investment and employment resulting from the subsidy but also the opportunity cost of workers and capital – the amount that would have been earned otherwise. The net increase in the economic pie is the incremental earnings of workers and capital less efficiency losses from raising taxes or issuing debt to finance the subsidy and resources used to administer and apply for it.
The nature of the assessment should vary by program type. Business subsidies, labour market development programs and climate change mitigation/adaptation measures have benefits and costs measurable in monetary terms. These programs could be ranked by their net social benefits, allowing comparisons within and across program categories. Programs where benefits are less than costs would be candidates for elimination or modification.
A more nuanced approach is needed when assessing social programs and other measures with a fairness goal for several reasons. Their economic impact is ambiguous, and a negative economic impact is not a sufficient reason to eliminate a program. In addition, support for an income redistribution program depends on who benefits from it. As a result, evaluations of social programs should be more descriptive than prescriptive. They should present information on the economic impacts of measures, their fiscal cost, including administration expenses, and a discussion of who benefits from the program and how they benefit. Evaluations should also assess how the program fits into other measures providing support to the target population. This information will allow elected officials and, since all evaluations would be made public, Canadians, generally, to form an evidence-based opinion on the value for money of social programs.
A thorough assessment of government programs through a value-for-money lens may not identify enough wasteful spending to achieve deficit and debt targets. If so, tax increases should be used to achieve the objectives.
Adopting and achieving the debt target will require a political commitment that currently does not exist. The task for policy analysts is to help build a consensus on a more prudent approach to fiscal policy and a revamped expenditure management system. According to Lester, this consensus should be ratified by legislation setting out general principles for sound fiscal policy, supplemented with non-legislated operational rules to guide annual policy and monitor progress. This approach would impose discipline on fiscal policy while allowing flexibility to address unexpected developments. Legislation would strengthen the consensus on fiscal prudence and help prevent backsliding by future politicians.
Conclusion
The evidence presented at the conference confirmed that Canada has a debt problem. Existing debt levels are not prudent, and they raise concerns about generational fairness. Prudence requires that Canada’s public debt be reduced by about 10 percentage points of GDP before the decade’s end. This would require increasing the combined federal-provincial primary balance by 1.4 percent of GDP, or $43 billion, starting in 2025/26.
Tax increases harm economic performance, so elimination of public spending that does not provide enough benefits to offset this damage should be the first step in reducing deficits and debt. Identifying wasteful spending will require comprehensive value-for-money assessments. Governments must not take the easy way out by implementing across-the-board spending cuts. Successful expenditure restraint will also require setting binding multi-year expenditure ceilings to prevent governments from spending revenue windfalls or from increasing spending to improve chances of electoral success.
Canada’s public debt is imposing a burden on future generations. A comparison of the lifetime tax burden on the recently born with distant future generations reveals only a small generational transfer in favour of the recently born. However, burden shifting is much larger from currently living generations to persons born shortly after the pandemic-induced recession. The $430 billion in pandemic-related debt should be paid down by the people that benefited from the income stabilization measures. Achieving this fairness objective would require more fiscal consolidation than needed to ensure sustainability of the debt. For the Silo, Alexandre Laurin/John Lester via C.D. Howe Institute.
Appendix: Assumptions and Methods for the Sustainability Analysis
References
Aiyagari, S. Rao, and Ellen R. McGrattan. 1998. “The Optimum Quantity of Debt.” Journal of Monetary Economics 42 (3): 447–69.
Ambler, Steve, and Craig Alexander. 2015. “One Percent? For Real? Insights from Modern Growth Theory about Future Investment Returns.” E-Brief. Toronto: C.D. Howe Institute. October.
Burgess, David F. 1996. “Fiscal Deficits and Intergenerational Welfare in Almost Small Open Economies.” Canadian Journal of Economics, 885–909.
Canada. 2024. “Budget 2024.” Department of Finance Canada. April.
Checherita-Westphal, Cristina D., and Marcel Stechert. 2021. “Household Saving and Fiscal Policy: Evidence for the Euro Area from a Thick Modelling Perspective.” Available at: https://papers.ssrn.com/sol3/papers.cfm?abstract_id=3992188.
Conklin, David, and Thomas Courchene. 1983. “Deficits: How Big and How Bad?” Special Research Report. Toronto: Ontario Economic Council.
Grady, Patrick, and Richard W. Phidd. 1993. “Budget Envelopes, Policy Making and Accountability.” Government and Competitiveness Project, School of Policy Studies, Queen’s University. http://global-economics.ca/budgetenvelopes.pdf.
International Monetary Fund (IMF). 2022. “Staff Guidance Note on the Sovereign Risk and Debt Sustainability Framework for Market Access Countries.” 2022–039. IMF Policy Papers.
James, Steven, and Philippe Karam. 2001. “The Role of Government Debt in a World of Incomplete Financial Markets.” Department of Finance, Economic and Fiscal Policy Branch.
Jenkins, Glenn, and Chun-Yan Kuo. 2007. “The Economic Opportunity Cost of Capital for Canada-an Empirical Update.” Queen’s Economics Department Working Paper. Available at: https://www.econstor.eu/handle/10419/189409.
Kim, Junghum, and Sean Dougherty (eds.) 2020. “Adaptability, accountability and sustainability: Intergovernmental fiscal arrangements in Canada,” in Ageing and Fiscal Challenges across Levels of Government, OECD Publishing, Paris.
Mahboubi, Parisa. 2019. Intergenerational Fairness: Will Our Kids Live Better than We Do? Commentary 529. Toronto: C.D. Howe Institute. January.
McDavid, Jim, Astrid Brousselle, Robert P. Shepherd, and David Zussman. 2018. “Linking Evaluation and Spending Reviews: Challenges and Prospects.” Canadian Journal of Program Evaluation 32 (3): 297–304. https://doi.org/10.3138/cjpe.43176.
Modigliani, Franco. 1983. “Government Deficits, Inflation and Future Generations.” In Deficits: How Big and How Bad, pp. 55–71.
Nakajima, Tomoyuki, and Shuhei Takahashi. 2017. “The Optimum Quantity of Debt for Japan.” Journal of the Japanese and International Economies 46:17–26.
Okamoto, Akira. 2024. “The Optimum Quantity of Debt for an Aging Japan: Welfare and Demographic Dynamics.” The Japanese Economic Review. May. Available at: https://doi.org/10.1007/s42973-024-00156-7.
Panizza, Ugo, Richard Varghese, and Yi Huang. 2019. “Public debt and private investment.” Centre for Economic Policy Research. VOXEU Column. December 4.
Reinhart, Carmen M., and Kenneth S. Rogoff. 2010. “Growth in a Time of Debt.” American Economic Review 100 (2): 573–78. https://doi.org/10.1257/aer.100.2.573.
Robson, William, and Parisa Mahboubi. 2024. Another Day Older and Deeper in Debt: The Fiscal Implications of Demographic Change for Ottawa and the Provinces. Commentary 665. Toronto: C.D. Howe Institute. August.
Robson, William, and William Scarth. 1994. Deficit Reduction – What Pain, What Gain? (Policy Study 23). Toronto: C.D. Howe Institute.
Canadian consumers and businesses pay more than $80 billion a year in property & casualty insurance premiums with an upward trend consistently in excess of our anemic GDP growth rate. The total cost is now more than 3 percent of GDP. … But how does Canada benchmark relative to its global peers?
• Canadians pay higher premiums for property and casualty insurance than citizens in many, if not most, other developed nations. This Commentary uses OECD data and private industry data to compare the national P&C insurance sector’s premiums as a percentage of Gross Domestic Product with its international peers and is an update of the findings of the author’s 2021 edition of this report.
• The Commentary focuses on liability, property and auto insurance to compare costs across nations. Then, it takes a deeper dive into the Canadian data to compare personal property and auto insurance among all provinces and territories.
• When it comes to costs for property insurance, the study finds Canada is in the top ranks, paying 1.23 percent of GDP in premiums, almost double the 0.66 percent average of other G7 peers and even higher than the 0.52 percent OECD average.For automobile insurance (which here includes both personal and commercial), Canadians appear to be paying, on average, the highest premiums in the world, relative to GDP.
• Within Canada, inter-provincial benchmarking for personal property insurance shows the higher average premiums paid in Canada – relative to the rest of the developed world – appear to be shared equally by most provinces. However, province-by-province comparisons of personal auto insurance show that there are substantial differences among provinces, with four jurisdictions producing higher-than-average results. Two of the four (Saskatchewan and Manitoba) are government-monopoly jurisdictions – in fact, these are the two highest in terms of costs. The two other outliers (Ontario and Alberta) are served by a competitive private sector, but Alberta has chosen until very recently to maintain a costly tort environment and Ontario mandates particularly generous accident benefits and has experienced a plague of auto theft.
• In the case of automobile insurance, just a handful of provinces need to think harder about how to improve car insurance premiums. But to reduce the cost of living for homeowners, the solutions required must be national in scope and include public/private partnerships to share the rapidly increasing risk-transfer price of natural catastrophe events.
Read the full article by Alister Campbell via this PDF.
Key Canadian trade laws do not refer to national security as a factor that allows Canada to counter threats from imports of goods or services. Given the tense geopolitical situation, I propose ways to close this “national security gap.”
The gap is particularly worrisome in two key import-governing legislation: (1) the Customs Tariff Act and (2) the Export and Import Permits Act.
I will show why the omission of the national security element in these and possibly other statutes needs to be remedied.
National Security & Chinese Exports
The Americans imposed surcharges on Chinese EVs, steel, aluminum, semiconductors and other products in May 2024 in response to heavily subsidized Chinese imports that were said to have breached international trade rules.
The EU started applying countervailing duties on Chinese EVs in July this year, using a more standard trade remedy process to counter the injurious impact of subsidized imports on the European automotive industry.
The danger posed by Chinese EVs, steel and aluminum imports, plus these actions by Canada’s major trading partners, led the Canadian government to apply comparable tariff surcharges. The strategic threat posed by China’s state-subsidized exports made for the right response by Canada.
While existing laws allowed the federal cabinet to take action in this case, it also brought home the fact that there is an absence of any reference to “national security” in some of Canada’s major trade law statutes.
Section 53 – Canada’s Rapid Response Mechanism
In the United States, Section 232 of the 1962 Trade Expansion Act, along with Section 301 of the 1974 Trade Act, authorize the president to increase tariffs on imports if the quantity or circumstances surrounding those imports are deemed to threaten national security.1
Section 232 was used by the Trump administration in 2018 to apply surcharges to a range of imports from numerous countries, including Canada. However, these tariffs were ultimately dropped in the face of threats by Canada to retaliate against American goods exported to Canada.
Unlike the US, Canada lacks the legislative means to impose import surcharges on the basis of national security. The closest we have is Section 53 of the Customs Tariff Act, which focuses on the enforcement of Canada’s rights under trade agreements and responses to practices that negatively affect Canadian trade. It was Section 53 that was used in the August decision on Chinese EVs, etc., referred to earlier.
Indeed, there are similarities between Section 301 of the US Trade Act of 1974 and Section 53 of the Customs Tariff Act.But while existing laws allowed the federal cabinet to act in this case, the case brought home the fact that there is an absence of any reference to “national security” in some of Canada’s major trade law statutes.
Governments have shied away from using Section 53 as a policy tool over the years. It was used only once before its present deployment, in response to the Trump administration’s surcharges on Canadian steel and aluminum in 2018 and 2020.2
The surcharges were ultimately withdrawn when the US tariffs were terminated.Section 53 comes under Division 4 of the Actentitled “Special Measures, Emergency Measures and Safeguards,” giving the government broad powers to apply unilateral tariff measures on the joint recommendation of the ministers of Finance and Global Affairs:
…for the purpose of enforcing Canada’s rights
under a trade agreement in relation to a country
or of responding to acts, policies or practices of
the government of a country that adversely affect,
or lead directly or indirectly to adverse effects on,
trade in goods or services of Canada…
There is no requirement for public consultations or input under this provision. Although the government held a round of stakeholder consultations before moving on Chinese imports in August, it was not legally obliged to do so. While the ministerial recommendations must be fact-based and supported by credible data, the law is effective in that nothing inhibits rapid action by the federal cabinet. In this respect, it is a superior tool to Section 232 of the American legislation.3
The critical shortcoming, on the other hand, is that while allowing the government to protect Canadian trade interests in a fairly rapid fashion, Section 53 does not allow action on imports found to be threatening national security, whether it be economic, military or other. There is clearly a need to repair this omission, not only here but in Canada’s other trade laws.
In my view, we need a national security component in Section 53 as the Canadian counterpart to Section 232 of the US Trade Expansion Act.
Import Controls and National Security
Together with tariff measures, Canada can control imports under the Export and Import Permits Act(EIPA) through the creation of import (and export) control lists designed to achieve particular strategic, security and economic objectives. These lists are established by orders-in-council,
requiring listed goods and technology to have a permit in order to be imported or exported. These permits are issued by the Trade Controls and Technical Barriers Bureau in Global Affairs Canada (GAC). Without a permit, imports of controlled items are illegal.
While Section 5(1) of EIPA provides for the creation of import control lists covering arms, ammunition and military items, it fails to provide for imports of goods or technology to be controlled for national security reasons. The Act could not have been used, for example, to deal with the effects on national security of imports of Chinese EVs, steel, aluminum or any other goods or technology. EIPA is thus deficient in this regard.
There is a related issue when it comes to export controls. Section 3(1) of EIPA authorizes the establishment of export control lists, among other reasons:
“(a)…to ensure that arms, ammunition,
implements or munitions of war, etc. … otherwise
having a strategic nature or value will not be made
available to any destination where their use might
be detrimental to the security of Canada.”
The reference to the “security of Canada” under paragraph (a) is the only such reference in the statute and is confined to the security aspects of imports of arms, ammunition, munitions of war, etc. While not as significant as the problems regarding import controls, it is nonetheless a serious omission.
The result is that as EIPA is currently drafted, the federal government lacks the legal authority to create import or export controls designed to protect or safeguard Canadian security. EIPA needs to be amended to add this authority on the part of the government.
Indeed, it may be desirable to re-consider much of the architecture of EIPA from the viewpoint of safeguarding Canada’s security interests on both the export and import side.
Controlling Imports Through Sanctions
Canada’s sanctions laws are found in the Justice for Victims of Corrupt Foreign Officials Act (JVCFOA), the United Nations Act, and, notably, the Special Economic Measures Act (SEMA). Each of these statutes allows the federal cabinet to issue sanctions through regulations
applicable to specific countries and/or jurisdictions and prohibiting transactions in specific items of goods or technology. None of these laws allow sanctions for matters related to Canadian security.
SEMA is Canada’s most widely used sanctions legislation. Section 4 is the only part of the Act that uses the term “security,” but only in instances when, among other matters:
(b) a grave breach of international peace and
security has occurred that has resulted in or is likely
to result in a serious international crisis.
Because of the restrictions on international peace and security, the government lacks the authority to issue sanctions dealing with national security interests.4
For example, Canada’s sanctions on Russia are directed at countering actions that “constitute a grave breach of international peace and security that has resulted or is likely to result in a serious international crisis,” with no reference to Canadian national security interests.
SEMA should be amended to allow prohibitions of any transaction or dealings of any kind where Canada’s national security is at risk.
Trade Remedies and National Security
In accordance with the GATT/WTO Agreement, antidumping and countervailing (AD/CV) duties can be applied to dumped or subsidized imports when a domestic industry is injured or threatened with injury from exactly the same imports as that industry produces. In Canada, these are provided for under the Special Import Measures Act (SIMA).
SIMA actions are driven by complaints filed by domestic producers who make exactly the same or directly competitive products as the imported items. It means, for example, that in the absence of a Canadian industry threatened with injury or actually injured by the same type of Chinese EVs, aluminum or steel imports as those producers make, AD/CV duty remedies would not be available. SIMA makes no reference to national security as a factor in the application of these duties.
In short, because the SIMA process is geared to provide protection to domestic producers and private sector industries, it is inappropriate as a vehicle for dealing with national economic security concerns that range well beyond those private interests.
The same is true in the case of safeguards, another kind of trade action allowed under the World Trade Organization (WTO) Agreement to counter floods of imports that are not dumped or subsidized but, because of their volume, cause or threaten serious injury to domestic producers of the same product.
In Canada, safeguard measures come under the Canadian International Trade Tribunal Act, where an inquiry takes place and, if recommended by the Tribunal, are applied under the Customs Tariff Act.
As in the case of dumped or subsidized imports, safeguard measures are designed to protect specific domestic industries and not to deal with overarching national security issues.
Again, because the objective of these remedial measures in international and Canadian trade law is to protect a domestic industry from financial harm due to imports and not to deal with broader questions of national security, the absence of reference to “security” in these various statutes does not seem to be a significant issue.
National Security under International Trade Law
Article XXI of the 1947 General Agreement on Tariffs & Trade (GATT) is the only provision in the entire WTO package that deals with national security. That article (entitled “Security Exceptions”) allows departures from normal trade rules to permit unilateral trade-restrictive measures that a contracting party “considers necessary for the protection of its essential security interests…taken in time of war or other emergency in international relations.”
The drafting of GATT Article XXI dates back to the post-World War II Bretton Woods era. What was considered an international emergency at that time was war, regional armed conflict or a global pandemic like the Asian flu of 1918-1920. The same broad view of international emergency conditions was applied when the Uruguay Round negotiations took place (1991-1994) leading to the conclusion of the WTO Agreement.
With recent cataclysmic changes in the world, whatever the WTO-administered multilateral system might prescribe, governments are moving to protect a range of national (and economic) security concerns by means of unilateral measures in ways that were not envisaged when the Bretton Woods architecture was devised in the late 1940s.
For decades, there was little recourse to Article XXI exceptions. However, their use emerged in the last number of years with the unilateral surcharges imposed by Trump.
The situation is different – and materially different – in the case of Chinese exports, not only EVs, steel or aluminum but also in technologically advanced or other critical items. These are goods that, by abundant evidence, are heavily subsidized, with massive overcapacity, exported to global markets as part of the Chinese government’s strategy to enhance its geopolitical position – facts uncovered in the EV situation through detailed investigations by the EU and the US.5
Thus, aggressive actions by China and possibly other countries in strategically sensitive areas take the issue beyond the WTO ruling in the US-Section 232 case and raise these to the level of an “emergency in international relations.”
In summary, the concept of an international emergency is much changed in today’s digitized, cyber-intensified world, including the aggressive and destabilizing policies of Chinese state capitalism and other bad actors. The application of GATT/WTO rules drafted in 1947 and updated in the 1990s must be adapted to deal with today’s realities if they are to provide governments with meaningful recourse.
Conclusions
In conclusion, Canada has a panoply of criminal, investment, intelligence gathering and other laws that address national security concerns. However, there is a notable absence of the term “national security” in Canada’s core trade law statutes.
This absence is of concern in the Customs Tariff Act and the Export and Import Permits Act, two important statutes that give the government authority to act to counter injurious imports threatening Canada’s national security.
Given the state of world affairs and the challenges Canada faces from aggressive players like China, Russia, Iran and others, the omissions in these statutes need to be remedied. This should be acted on immediately. There is also a lack of reference to national security in Canada’s sanctions legislation, notably the Special Economic Measures Act (SEMA), the main Canadian sanctions statute.
Amendments should be made to make security concerns a ground for imposing sanctions here as well. The findings of EU agencies on Chinese BEV after a detailed investigation support the view that Chinese state capitalism and its centrally planned industrial capacity are geared toward dominating world markets in critical goods, part of that country’s geopolitical strategy. These and other similar governmental actions can be said to meet the “emergency in international relations” threshold under the WTO Agreement.
Given the state of affairs at the WTO, including the paralysis of its dispute settlement system, amendments to or reinterpretation of the GATT rules are difficult, if not impossible. The result is that governments will be resorting to unilateral application of the Article XXI exclusion in their own national security measures. While the situation may evolve at the WTO, and without diminishing Canada’s support for the multilateral rules-based system, the federal government should bring forth measures to add reference to national security interests in the above statutes. For the Silo, Lawrence L. Herman/ C.D. Howe Institute.
International Economic Policy Council Members
Co-Chairs: Marta Morgan, Pierre S. Pettigrew Members: Ari Van Assche Stephen Beatty Stuart Bergman Dan Ciuriak Catherine Cobden John Curtis Robert Dimitrieff Rick Ekstein Carolina Gallo Victor Gomez Peter Hall Lawrence Herman Caroline Hughes Jim Keon Jean-Marc Leclerc Meredith Lilly Michael McAdoo Marcella Munro Jeanette Patell Representative, Amazon Canada Joanne Pitkin Rob Stewart Aaron Sydor Daniel Trefle
1 The Trade Expansion Act of 1962 (Pub. L. 87–794, 76 Stat. 872, enacted October 11, 1962, codified at 19 U.S.C. ch. 7); The Trade Act of 1974 (Pub. L. 93–618, 88 Stat. 1978, enacted January 3, 1975, codified at 19 U.S.C. ch. 12).
2 The government announced it was applying these “to encourage a prompt end to the U.S. tariffs, which negatively affect Canadian workers and businesses and threaten to undermine the integrity of the global trading system.” See: “United States Surtax Order (Steel and Aluminum),” Government of Canada, June 28, 2018, https://gazette.gc.ca/rp-pr/p2/2018/2018-07-11/html/sordors152-eng.html.
3 Section 232 of the Trade Expansion Act allows the president to impose import restrictions – but these must be based on an investigation and affirmative determination by the Department of Commerce that certain imports threaten to impair US national security.
4 The array of Canada’s sanctions can be found on the GAC website at: https://www.international.gc.ca/world-monde/international_relations-relations_internationales/sanctions/current-actuelles.aspx?lang=eng.
5 The EU measures followed a countervailing duty approach, as opposed to direct action in the case of Canada and the US. In its extremely detailed investigation, EU agencies found, on the basis of massive evidence, that: “ . . . the BEV [battery electric vehicle] industry is thus regarded as a key/strategic industry, whose development is actively pursued by the GOC as a policy objective. The BEV sector is shown to be of paramount importance for the GOC and receives political support for its accelerated development. Including from vital inputs to the end product. On the basis of the policy documents referred to in this section, the Commission concluded that the GOC intervenes in the BEV industry to implement the related policies and interferes with the free play of market forces in the BEV sector, notably by promoting and supporting the sector through various means and key steps in their production and sale.”See: “Commission Implementing Regulation (EU) 2024/1866,” European Union, July 3, 2024, at para. 253, https://eur-lex.europa.eu/eli/reg_impl/2024/1866/oj
The Pakistani national who allegedly plotted to travel to New York to murder Jews was seeking refugee status in Canada, according to an immigration consultant.
Muhammad Shahzeb Khan, who came to Canada in June 2023 on a student visa, was arrested on Sept. 4 by the RCMP for allegedly intending to carry out a mass shooting targeting Jews in New York City. He was charged by U.S. authorities with attempting to provide material support and resources to a designated foreign terrorist organization, the Islamic State of Iraq and al-Sham (ISIS), and the United States is seeking to have him extradited.
Fazal Qadeer, an immigration consultant who had worked with Khan, said Khan was applying for refugee status on the basis of sexual orientation, saying he is gay, CBC reported on Oct. 7.
It is not known what Khan’s refugee claim status was when he was arrested, but Qadeer said Khan had recently had a lengthy interview with Immigration, Refugee and Citizenship Canada (IRCC).
Immigration Minister Marc Miller said in September that Khan entered Canada on a student visa.
According to a U.S. criminal complaint that was unsealed in September 2024, Khan repeatedly expressed his support for ISIS and his intention to carry out a terrorist attack around November 2023.
That month, he began interacting online with an undercover FBI agent, and explained his plan to attack Jewish religious centres in the United States around the time of the one-year anniversary of Hamas’s Oct. 7 terrorist attack against Israel.
In a statement, IRCC said it would not comment on individual cases, but that all asylum claimants receive an “independent and fair assessment on the individual merits of their claim,” which included whether they fear persecution based on race, religion, political opinion, nationality, or if they are LGBT.
Minister ‘Confident’ in Screening System
Khan’s arrest came months after a father and son were arrested by the RCMP in Richmond Hill, Ont., for allegedly being in the “advanced stages of planning a serious, violent attack in Toronto.” The two are facing nine terrorism charges, including conspiracy to commit murder on behalf of ISIS.
Ahmed Eldidi had been admitted into Canada in 2019 and later given citizenship, while Mostafa Eldidi was granted refugee status, according to documents provided by IRCC.
Miller defended Ottawa’s immigration system when appearing before the House of Commons public safety committee in September, saying the government remains “confident in the way our biometric system works in the progressive screening that operates in our country.”
Miller told the committee that Ahmed Eldidi had his initial temporary resident visa application refused because of concerns he would not leave Canada at the end of his authorized stay, but his second application was approved after an officer was satisfied he merely intended to visit Canada. He was given a favourable recommendation, Miller said, and officers found no issues that made him inadmissible to Canada.
Conservative MPs on the committee questioned screening procedures and accused the Liberal government of removing the mandatory requirement for police background checks for arrivals from some countries including Pakistan in 2018.
The IRCC’s website currently states that those applying for permanent residence, citizenship, or the International Experience Canada program “may need to provide a police certificate for any other programs” if they have a prior criminal record, but does not specifically mention Pakistan. For the Silo, Matthew Horwood.
Featured image- RCMP logo is seen outside the force’s ‘E’ division headquarters in Surrey, B.C., on March 16, 2023. The Canadian Press/Darryl Dyck.
OPP officers stand near the scene of a shooting where one Ontario Provincial Police officer was killed and two others were injured in the town of Bourget, Ont. on May 11, 2023. The Canadian Press/Patrick Doyle
Violent crime is surging in some of Canada’s major cities, with sexual assault rates showing the largest increase over the short and long term, according to a new report.
Sexual assault cases climbed in eight of nine major cities over the past seven years, with Ottawa being the exception to the trend, according to a study [read the full report at the end of this post] by the Macdonald Laurier Institute (MLI). The incidence of sexual assault has risen since 2016 in Vancouver, Calgary, Edmonton, Winnipeg, Toronto, Montreal, Peel, Ont., and York, Ont., with the last nearly doubling from 2016 to 2023.
“In recent years there has been a surge in violent crime across Canada as a whole,” says the report authored by Dave Snow and Rickard Audas, senior fellows at MLI. “We found that violent crime was increasing in many cities in the short-term, most notably for sexual assaults and robberies.”
Winnipeg and Edmonton recorded the highest number of sexual assault cases during the seven-year period. In 2023, Edmonton had a sexual assault rate of 108.64 cases per 100,000 people, while Winnipeg saw a rate of 107.76. Toronto followed at 97.8 cases.
The rate in Peel, on the other hand, was 52.15 cases last year, the lowest among all major cities.
The study’s goal was to analyze crime trends at a local level. To do so, the authors looked at 10 years of police-reported violent crime records from nine major cities, which they say account for one-third of the Canadian population.
They considered four crime categories: homicide, aggravated assault, sexual assault, and robbery. They did not include Vancouver data on sexual assault because of differences in how it reports the crime, they noted.
Winnipeg: Highest Robbery Rates
The robbery rate in Manitoba’s capital last year was nearly triple that of every other major city, at 305.82 cases per 100,000 population, according to the report. The rate has increased by more than 50 percent since 2016, decreasing slightly from 2019 to 2021, and reaching a peak in 2023.
The authors noted the rate decline coincides with the years of pandemic lockdowns.
The second highest robbery rate last year was in Edmonton, which had less than half that of Winnipeg, at 106.01 cases per 100,000 population. Alberta’s capital city had the second highest rate for the entire period, while Montreal and Toronto have followed closely in recent years.
By contrast, York reported the lowest robbery rates since 2016 among all major cities, with 31.66 cases last year. Ottawa and Peel also reported lower rates than other cities.
Edmonton: Highest Rates of Aggravated Assault
Edmonton’s aggravated assault rate in 2023 was more than four times that of any other major Canadian city except Winnipeg, said the report, at 38.72 incidents per 100,000 population compared to Winnipeg’s 22.81.
Aggravated assault refers to injuring, maiming, disfiguring, or endangering someone’s life, according to the Criminal Code of Canada.
The aggravated assault rate from 2016 to 2023 was highest in Edmonton, where it’s been rising steadily over the last decade, according to the study. Winnipeg had the second highest rates in the study period.
The authors said that despite being Canada’s largest city, Toronto has experienced “a considerable decline” in its aggravated assault rate over the last decade, with 8.29 cases in 2023.
York had the lowest rates since 2016, followed by Peel and Montreal. For The Silo, Carolina Avendano/The Epoch Times.
Let’s Hope for Solid Hit from the PBO’s Third Swing at Carbon Tax Analysis
The “corrected” analysis by the Parliamentary Budget Office of the carbon tax and rebates is due soon. One hopes it will get more things right in this third crack at evaluating the government of Canada’s assurance that most Canadians will receive enough from the carbon tax rebates to cover their cost of paying the tax.
Reporting in 2022 and in an update last year, the PBO analysis confirmed the government assertion so long as induced economic effects from the carbon levy are not included. However, once the economic damage from the levy is included, the PBO concluded that the rebates fall short of keeping family budgets whole.
The PBO’s conclusion was seized on by Conservative politicians and others to justify calls to revoke the carbon tax. Now, more knives have come out. The NDP says it would scrap the tax on households and put the burden on large emitters, but it does not yet explain how it would square that with the current big-emitter carbon tax. And BC, where carbon taxing began in Canada, has said it would drop the tax if Ottawa removed the legal requirement.
Much is at stake with this third PBO swing.
After the second report, the PBO admitted that its analysis had included, in addition to the carbon tax on households, the tax on large emitters as well. The economic impacts had been taken from work passed over to the PBO by Environment and Climate Change Canada (ECCC), which included the effects of the tax as applied to both industrial and household payers. The budget officer said the error was small and had little consequence for the analysis and promised a corrected version this fall.
The Canadian Climate Institute estimates that 20-48 percent of the emissions reduction by 2030 will come from the levy on large emitters compared to 8-14 percent from households. Given the scale of the large emitters tax, it is likely that it has significant economic effects on any forecast. Fixing this should not, however, be the most consequential revision to its analysis.
The PBO’s first two efforts had an analytical asymmetry. It measured the economic cost originating in the tax, exaggerated as it turned out, but did not attempt to capture the economic benefits (not to mention any health gains) from the effects of the household carbon levy in mitigating climate change. Put differently, their work was, in effect, based upon the faulty premise that climate change brings no economic damage. The massive and growing costs of cleaning up fire and flood damage and adapting to the many other consequences of global warming bear evidence of such costs. The PBO could and should do its own analysis of those climate change costs and, hence, the benefits of mitigation. Or it could more easily tap into the substantial body of available literature.
Lowering Canada’s Gross Domestic Product
In Damage Control, the Canadian Climate Institute estimated climate change would lower the Gross Domestic Product by $35 billion from what it would otherwise have been in 2030; the impact would rise to $80 to $103 billion by 2055. Through cutting emissions, the household carbon tax will reduce this cost. International literature is rich, and the PBO could review it for applicability to Canada. As but one example, Howard and Sterner’s (2017) meta-analysis on the impacts of climate change concluded most studies underestimated them. Their preferred estimate points to a GDP hit of between 7 and 8 percent of GDP if there are no catastrophic damages and 9 to 10 percent if there are. Conceptual thinking is also advancing. Consideration is being given to there being “tipping points” where a certain degree of climate change may have much more non-linear dramatic economic effects. Some, like Stern and Stigliz, even question the worth of comparing an economic outlook with mitigation action against a status quo baseline as the PBO has done. They argue that without mitigation, there may not be a sustainable economic outcome.
Finally, those still inclined to think that a corrected Fall 2024 PBO report will provide ammunition to “axe the tax” need to ask themselves two questions.
First, is there value in the emissions reduction resulting from the household carbon tax? The Canadian Climate Institute concludes that the 8-14 percent contribution to emissions reduction by 2030 will grow in later years. Even with the tax and all the other policies announced to date, there is a 42-megatonne gap in Canada’s 2030 emissions reduction target. More than 200 Canadian economists signed an open letter asserting that “carbon pricing is the lowest cost approach because it gives each person and business the flexibility to choose the best way to reduce their carbon footprints. Other methods, such as direct regulations, tend to be more intrusive and inflexible, and cost more.” If not the household carbon tax, then what else?
Don Drummond is the Stauffer-Dunning Fellow in Global Public Policy and Adjunct Professor at the School of Policy Studies at Queen’s University and a Fellow-In-Residence at the C.D. Howe Institute.


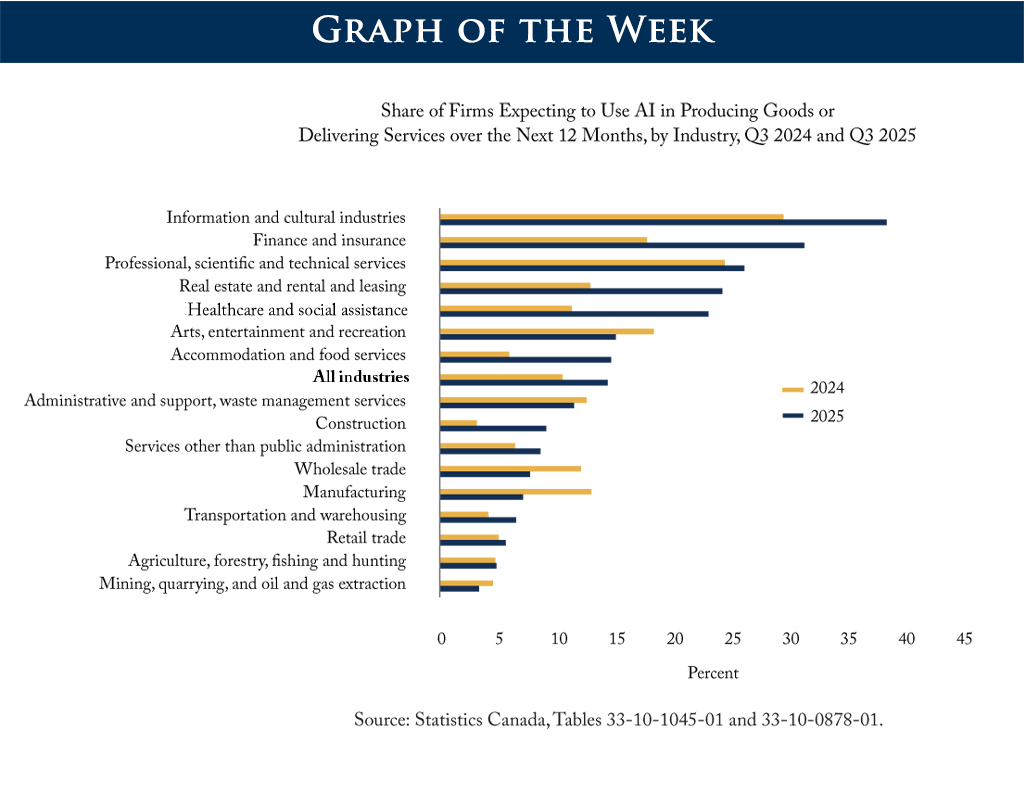


 In case you missed it- the world is quietly entering a population crisis. Global fertility rates have plunged to their lowest level in 60 years, raising profound questions about how societies will sustain themselves in the decades ahead.
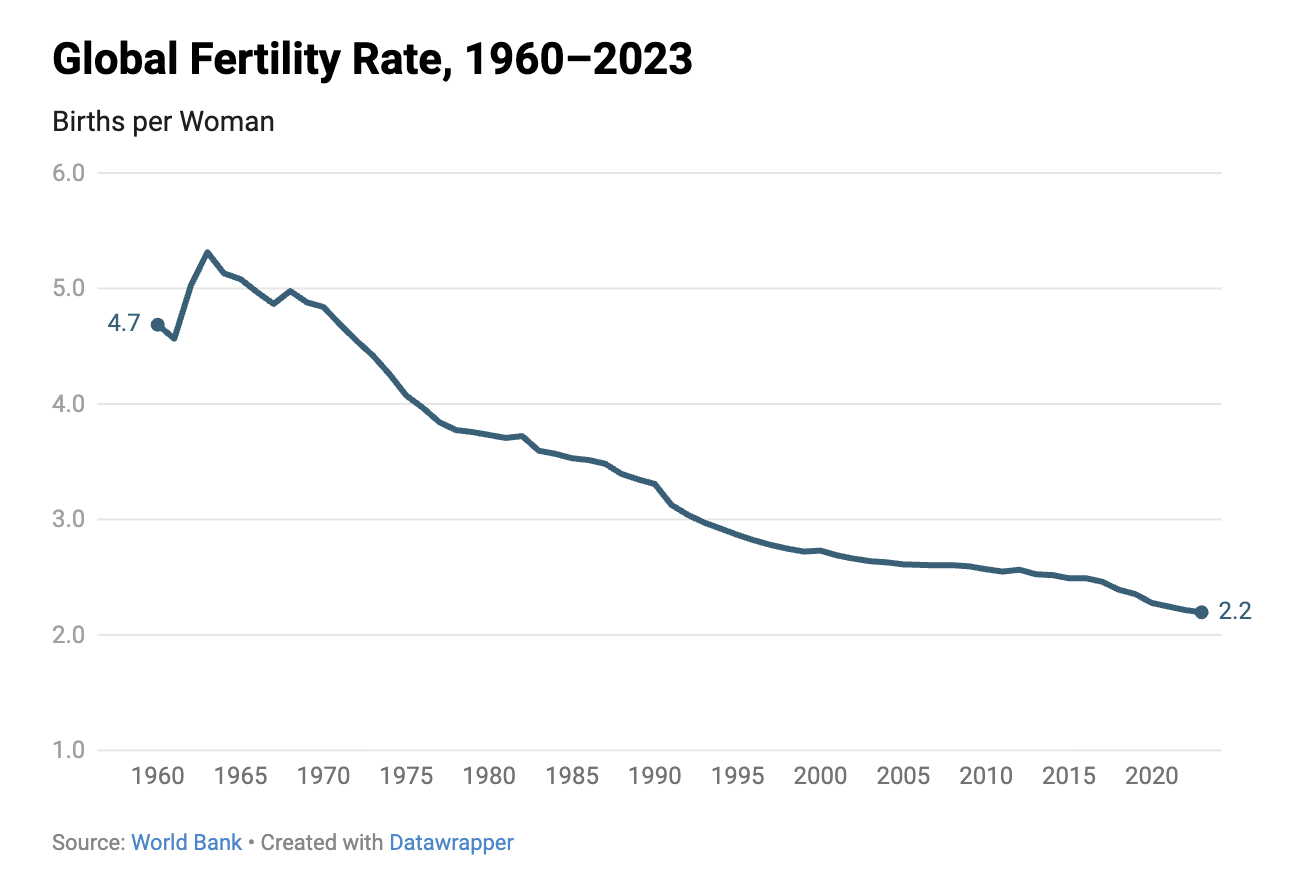 In July, the U.S. Census Bureau projected that the world’s population will reach 8.1 billion this year. Experts say that although the figure has grown from 3 billion in 1960, the number to watch is the pace of population growth.”
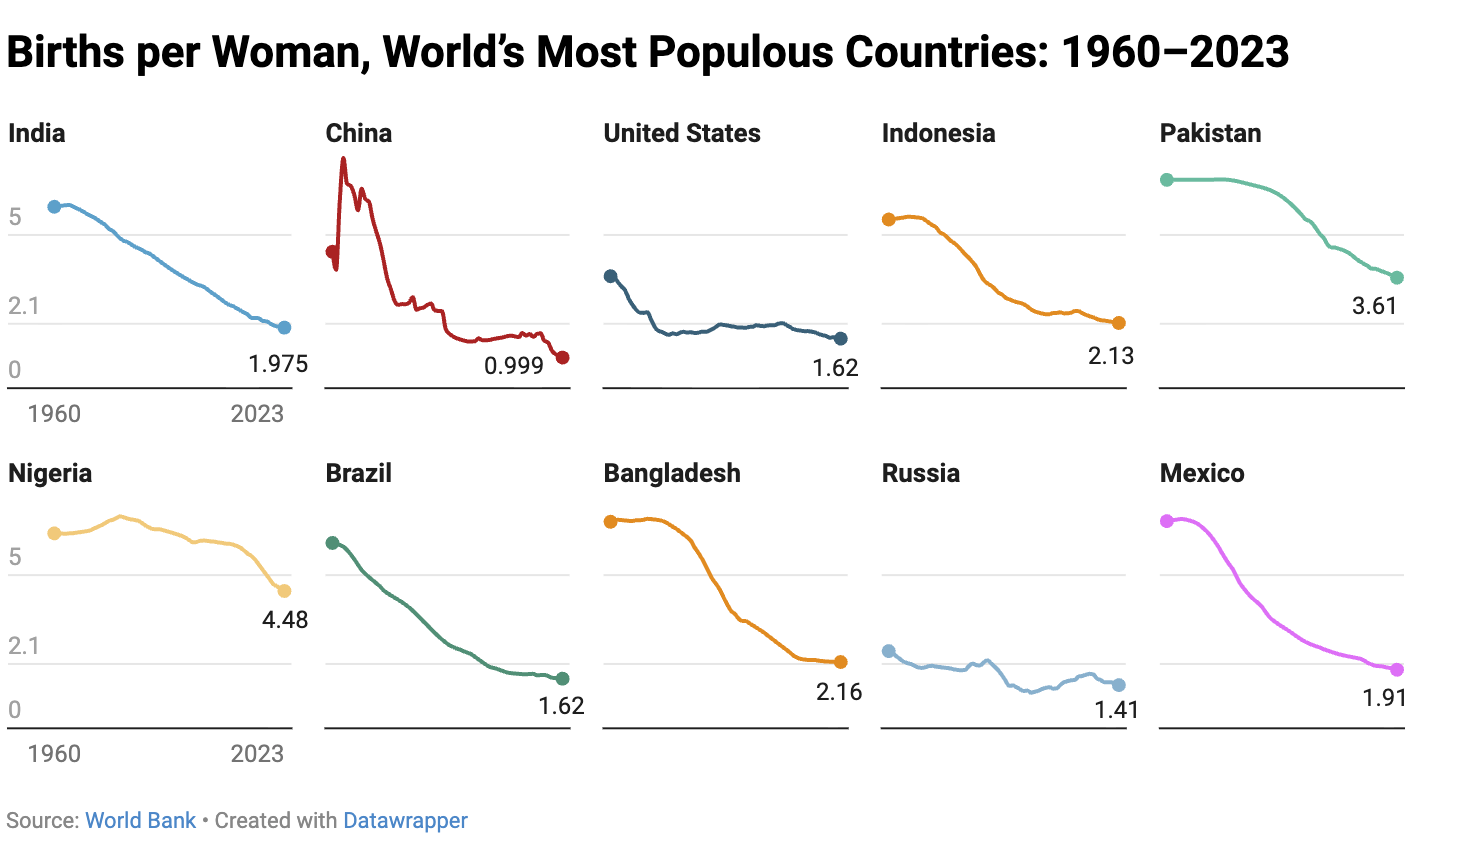 Asian and European countries have the lowest fertility rates in the world, and South Korea (0.72), Singapore (0.97), Ukraine (0.977), and China (0.999) all have rates below one. (
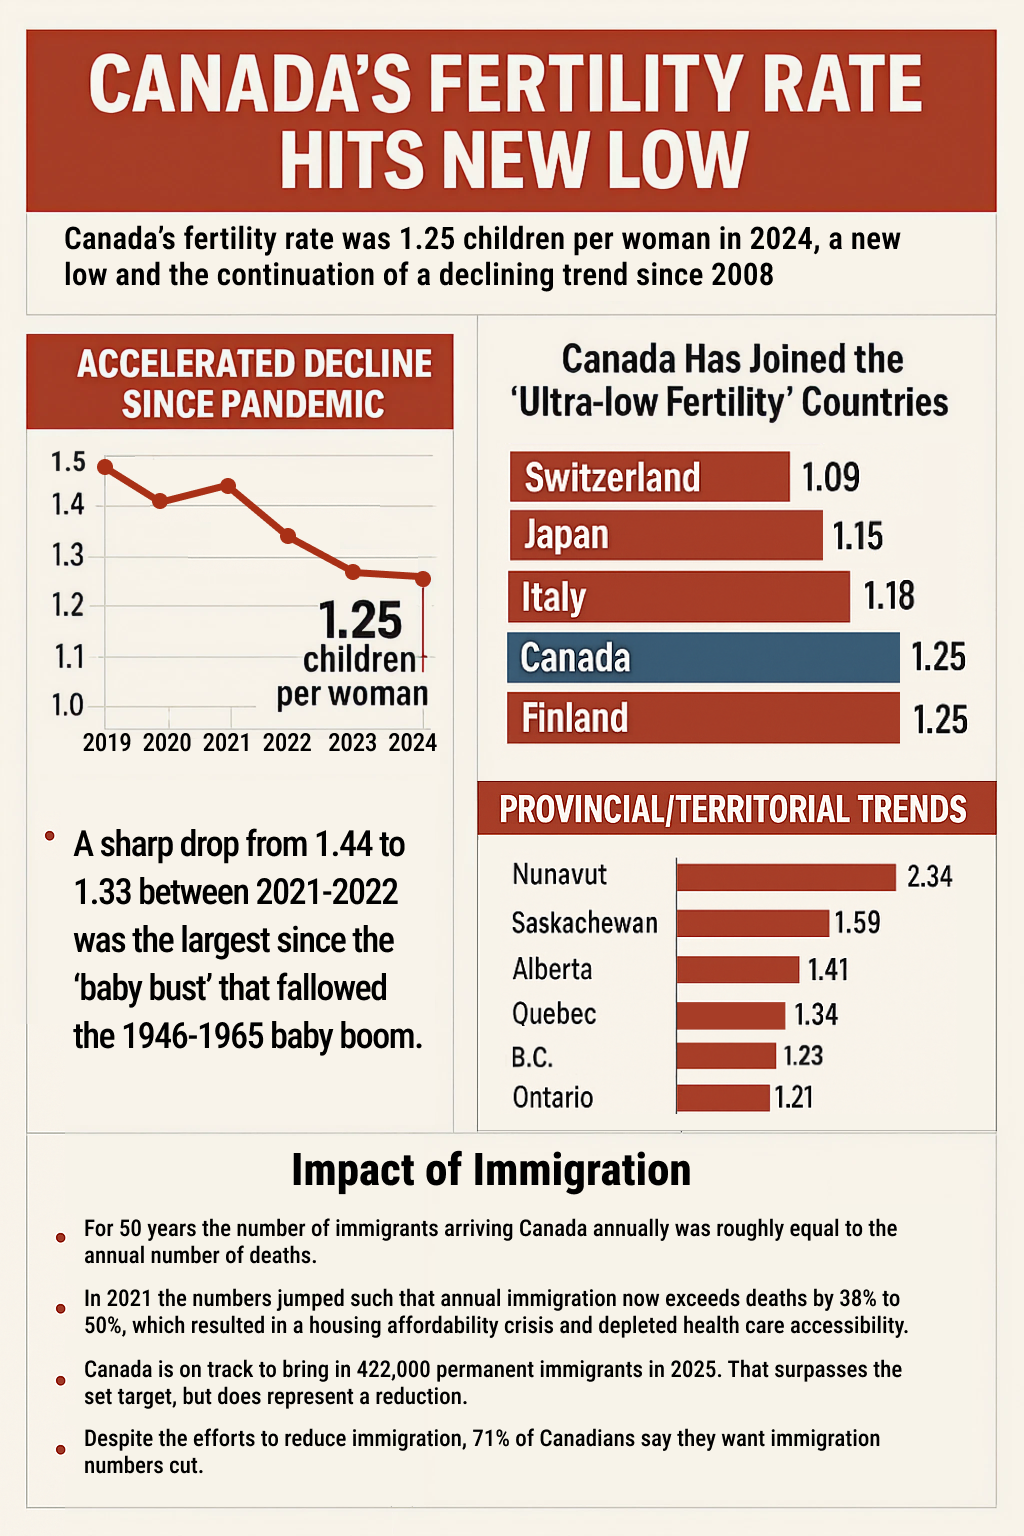 Source: Statistics Canada