Cybercriminals are constantly attempting to exploit vulnerabilities that affect as many people as possible to maximize their profit opportunities.
According to the recent Atlas VPN team findings, Google and Microsoft accumulated the most vulnerabilities in the first half of 2021. Although not all exposures can cause critical damage, hackers could exploit some of them for severe attacks.
Google had 547 accumulated vulnerabilities throughout the first half of 2021. Exploiting Google products like Chrome is popular among cybercriminals. Next up, the second most exposures were found in Microsoft products — 432. State-sponsored threat actors from China abused Microsoft Exchange Server vulnerabilities to carry out ransomware attacks.
Microsoft accuses China over e-mail cyber attacks. Image; BBC News
Oracle registered 316 total vulnerabilities in the first six months of 2021. Usually, the exploits are found in Oracle WebLogic Server, which functions as a platform for developing, deploying, and running enterprise Java-based applications.
Networking hardware company Cisco accumulated 200 vulnerabilities. Lastly, the producer of software for the management of business processes SAP had 118 exploits in total. Cybersecurity writer and researcher at Atlas VPN William Sword shares his thoughts on Microsoft and Google vulnerabilities: “Exploiting vulnerabilities in Google or Microsoft products allow cybercriminals to probe millions of systems. While the tech giants are doing a fair job of keeping up with exploits and constantly updating their software, people and organizations need to follow suit and keep up with the updates to prevent further exploitation.”
Vulnerability tiers
Exploits that can be turned into a severe attack get more attention from cybercriminals and companies themselves to fix the flaw as soon as possible. In the first half of 2021, there were 1,023 vulnerabilities found with a risk tier of 10.
One of the exploits that applied to such a tier is CVE-2021-22986, with a score of 9.8. National Vulnerability Database (NVD) issued risk tier 9 to 927 vulnerabilities. At this tier, exploit CVE-2021-28111 stood out with a score of 8.8. NVD recorded most vulnerabilities at a risk tier of 8 — 2,164. A notable exploit was CVE-2021-24092, with a score of 7.8. Finally, NVD recorded 501 vulnerabilities at risk tier 7. While second-most vulnerabilities — 1,765 — were found at tier 6.
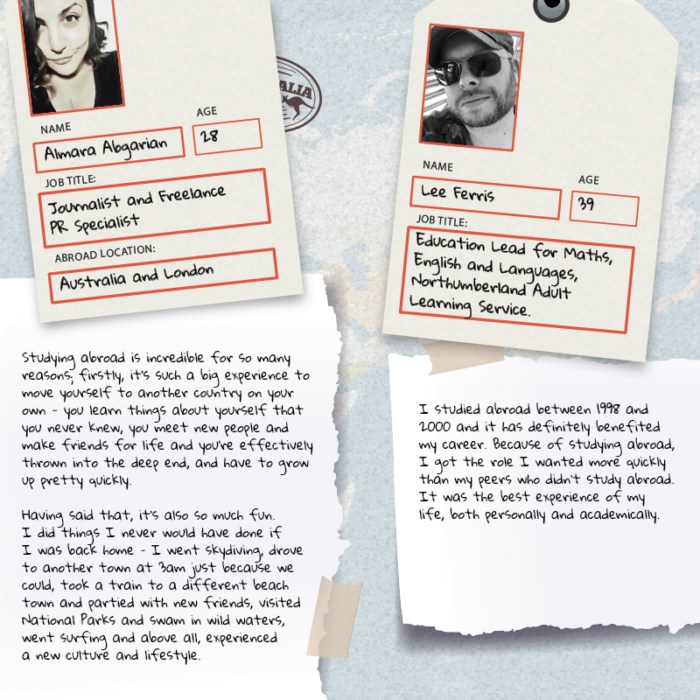
As more students are heading towards graduation each year, the struggle to get a graduate job is becoming more difficult, and students have to ensure strong CVs in order to stand out from the crowd. The Covid pandemic has put a halt to students having options in countries other than their own. However, with a bit of luck, the pandemic will continue to end and travel restrictions will be eased. When that happens, international students will finally be allowed to return to studying abroad, learning new skills and experiencing new cultures.
Although this may be seen as one long holiday to those not in the know, those that study abroad will, in fact, have a higher starting salary, earning an extra 5% more than those who don’t. On average, this could amount to an extra £75,000 ($126,709 CDN at time of this article) over a career.
Not only will they earn more, they are also almost ¼ less likely to be unemployed after graduation. So although all study abroad programs come with a cost, with readily available bursaries, this opportunity is accessible to any student who is hoping to boost their employ-ability and is an opportunity that should be taken.
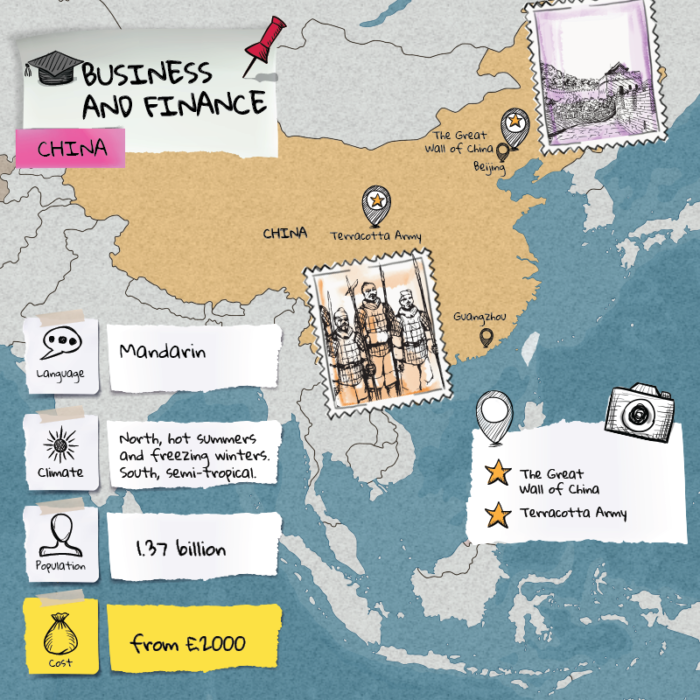
• Business and Finance Students – China: As the second largest economy in the world, China offers endless business opportunities, whilst encouraging students to learn the most widely spoken language in the world, Mandarin.
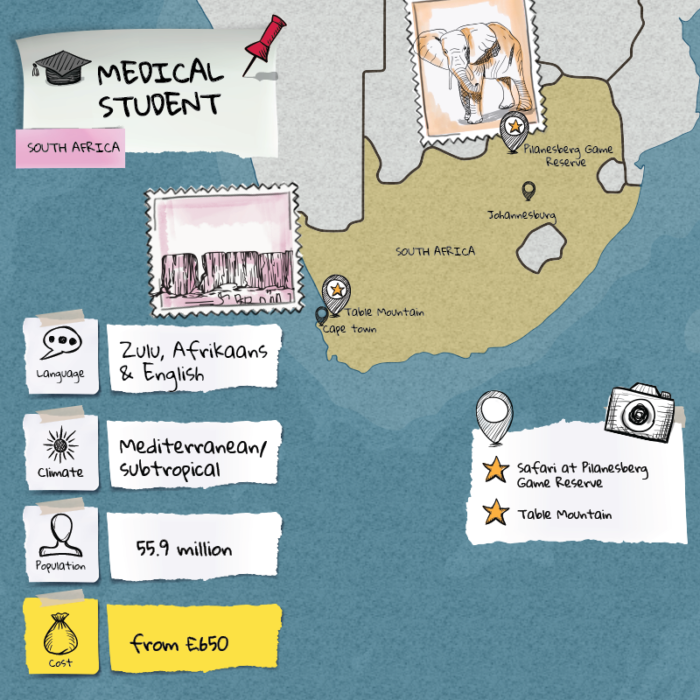
• Medical Students – South Africa: Of the 234 million surgical procedures made every year, just 4% of these happen in the poorest third of the global population. When medical students choose to volunteer in South Africa, they will gain experience in a different medical setting, and all whilst giving back.
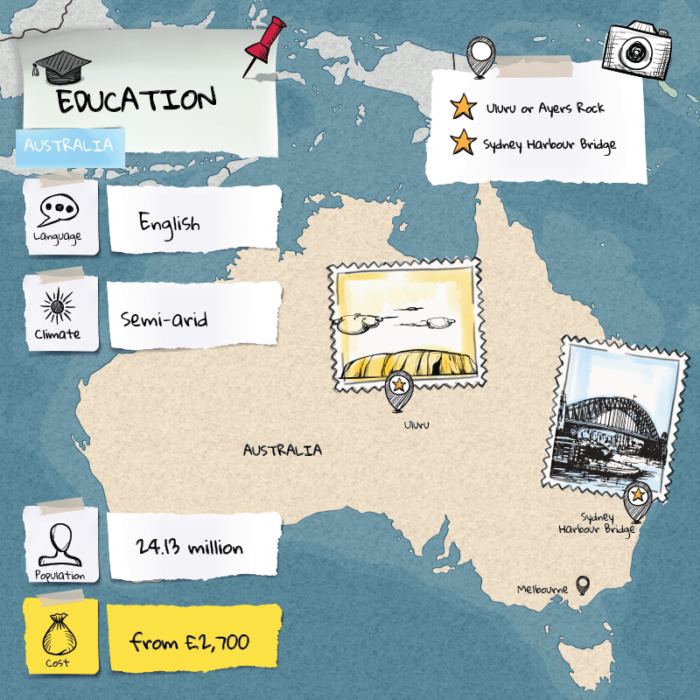
• Education Students – Australia: As an English-speaking country, Australia is the perfect study abroad opportunity for future teachers. With the average UK class size standing at 30 pupils, the Australian’s average size of 16 will be a lot easier to manage. Plus for those who decide to stay in Australia long-term, new teachers can expect to earn £40,000+ ($67,572 CDN) compared to the £22,000 ($37,164 CDN) starting salary in the UK.
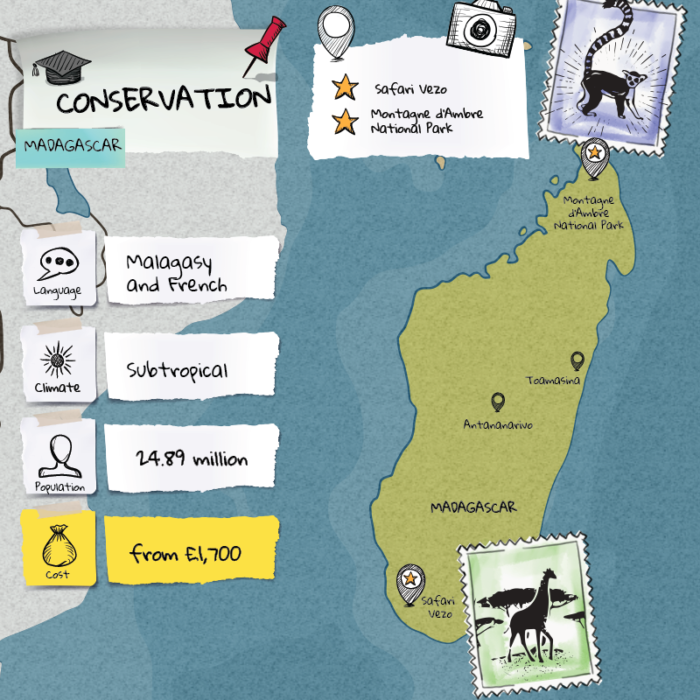
• Conservation – Madagascar: Conservation is a growing industry as concern grows for animals and the environment. As the fourth largest island in the world, and as home to species not found anywhere else, Madagascar is the perfect opportunity for a once in a lifetime opportunity for conservation enthusiasts.
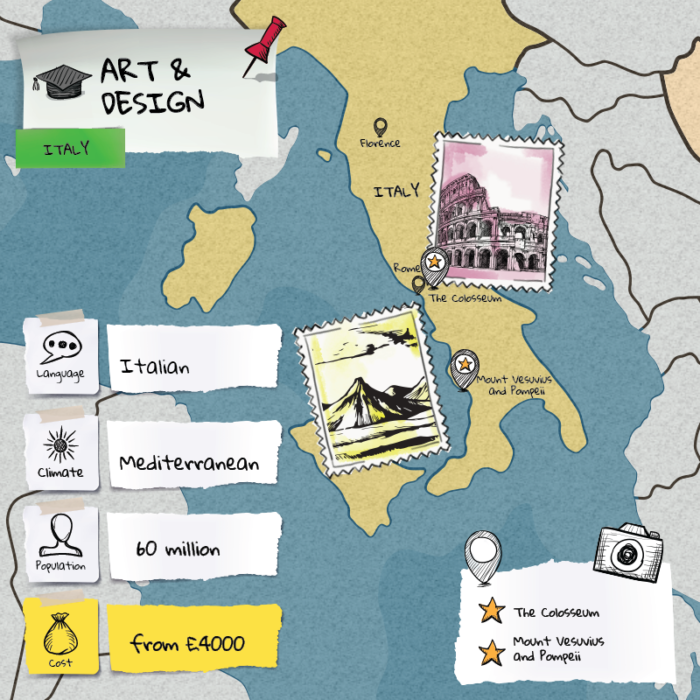
• Art & Design Students – Italy: From ancient and classic sculpture to modern day art, Italy is the perfect place to learn and gain an even greater passion for art history.
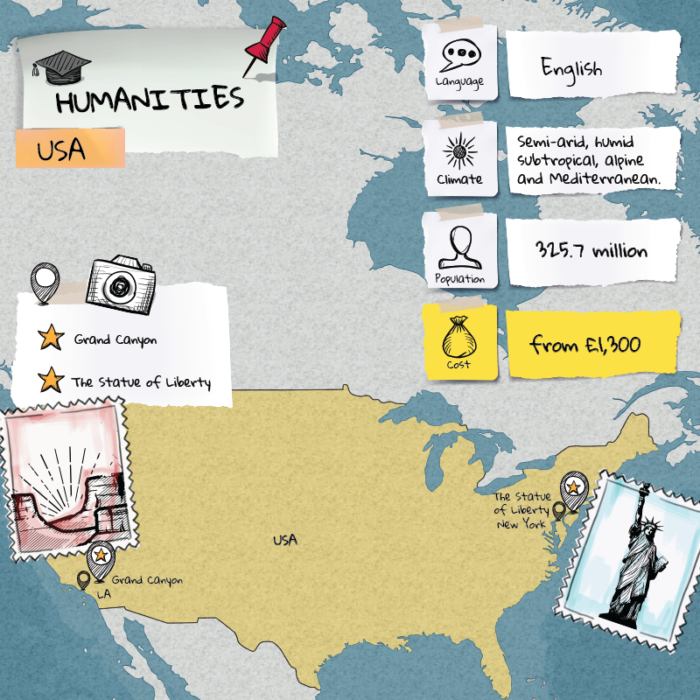
• Humanities Students – USA: With three of the top five humanities universities based in the USA, America offers a vast array of historical and literary studying options. This time abroad will open up options for students who are wanting to work in academia, journalism or teaching.
The COVID-19 pandemic caused by the novel coronavirus SARS-CoV-2 has led to over 910,000 deaths worldwide and unprecedented decimation of the global economy. Despite its tremendous impact, the origin of SARS-CoV-2 has remained mysterious and controversial. The natural origin theory, although widely accepted, lacks substantial support.
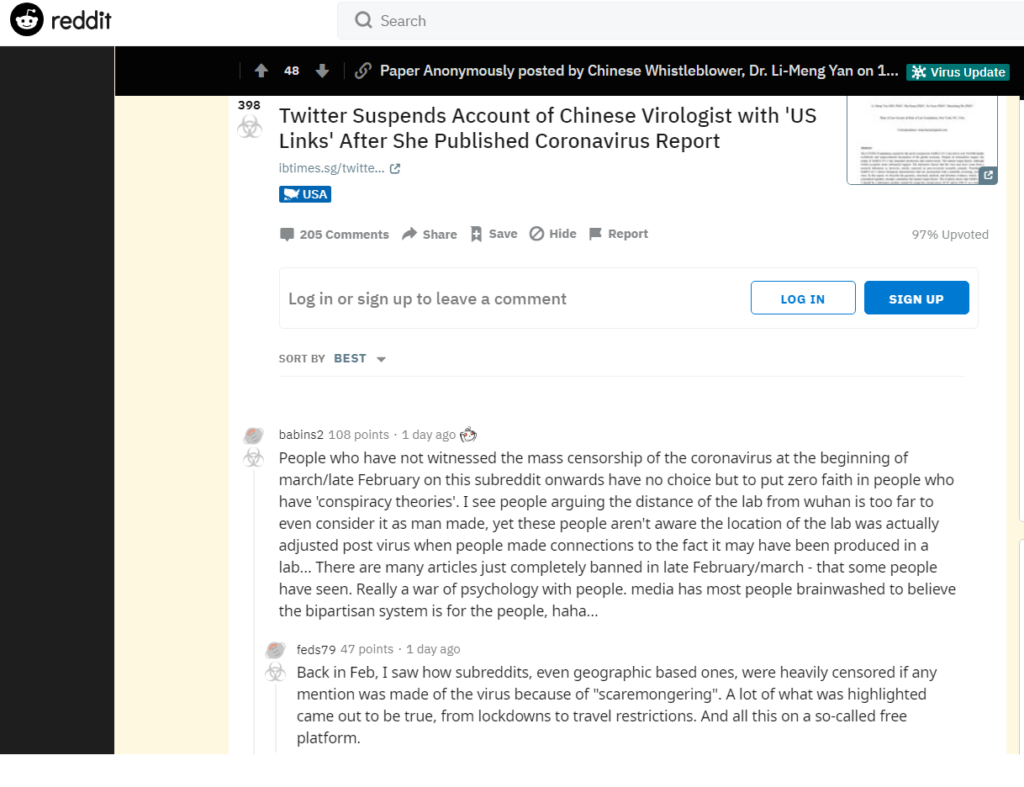
Censorship Of Alternative Theory
A recent Reddit page
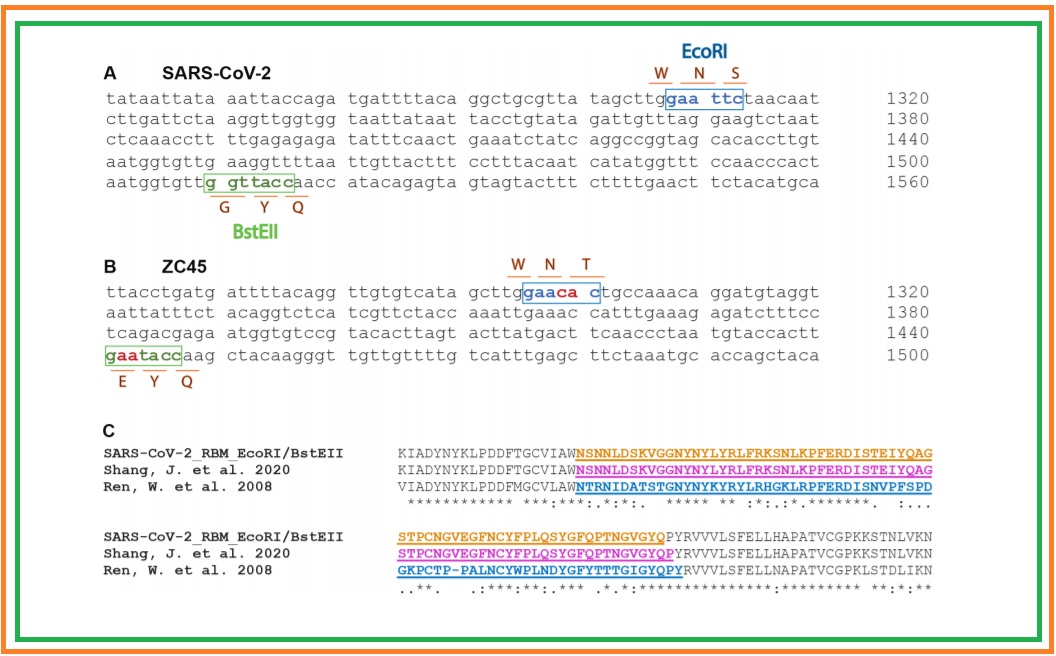
The alternative theory that the virus may have come from a research laboratory is, however, strictly censored on peer-reviewed scientific journals. Nonetheless, SARS-CoV-2 shows biological characteristics that are inconsistent with a naturally occurring, zoonotic virus.
Dr. Li-Meng Yan, one of the key authors of the report has been labeled as a whistle blower by Western media.
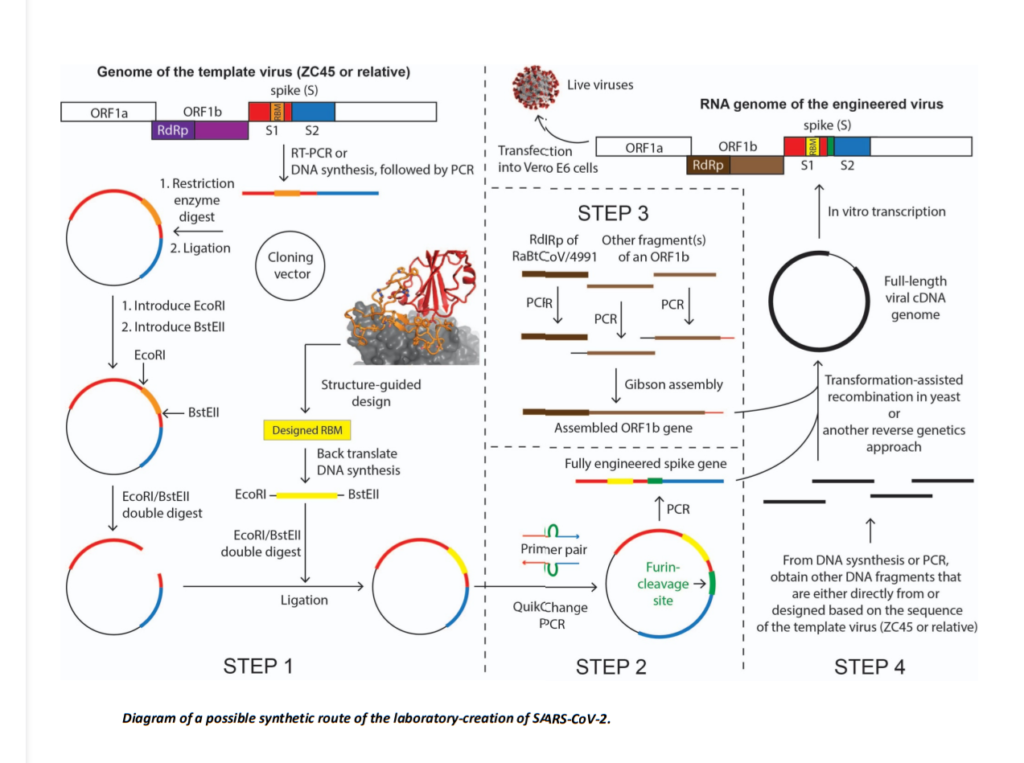
In this report, the authors describe the genomic, structural, medical, and literature evidence, which, when considered together, strongly contradicts the natural origin theory. The evidence shows that SARS-CoV2 should be a laboratory product created by using bat coronaviruses ZC45 and/or ZXC21 as a template and/or backbone. Building upon the evidence, we further postulate a synthetic route for SARS-CoV-2, demonstrating that the laboratory-creation of this coronavirus is convenient and can be accomplished in approximately six months.
Our work emphasizes the need for an independent investigation into the relevant research laboratories. It also argues for a critical look into certain recently published data, which, albeit problematic, was used to support and claim a natural origin of SARS-CoV-2.
From a public health perspective, these actions are necessary as knowledge of the origin of SARS-CoV-2 and of how the virus entered the human population are of pivotal importance in the fundamental control of the COVID-19 pandemic as well as in preventing similar, future pandemics.
Introduction
COVID-19 has caused a world-wide pandemic, the scale and severity of which are unprecedented. Despite the tremendous efforts taken by the global community, management and control of this pandemic remains difficult and challenging. As a coronavirus, SARS-CoV-2 differs significantly from other respiratory and/or zoonotic viruses: it attacks multiple organs; it is capable of undergoing a long period of asymptomatic infection; it is highly transmissible and significantly lethal in high-risk populations; it is well-adapted to humans since the very start of its emergence ; it is highly efficient in binding the human ACE2 receptor (hACE2), the affinity of which is greater than that associated with the ACE2 of any other potential host.
The origin of SARS-CoV-2 is still the subject of much debate.
A widely cited Nature Medicine publication has claimed that SARS-CoV-2 most likely came from nature. However, the article and its central conclusion are now being challenged by scientists from all over the world.
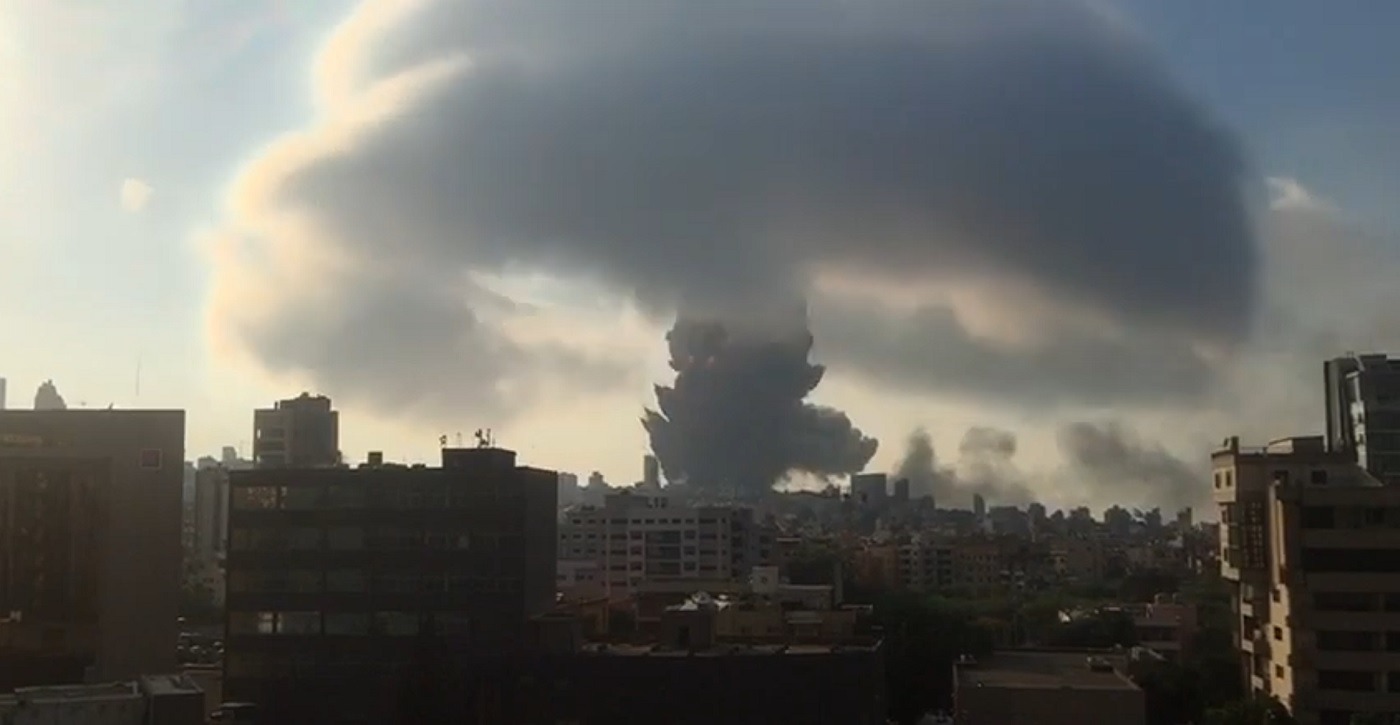
Beirut / Tehran – The 2,750 metric tons of ammonium nitrate which caused a massive explosion in the port of Beirut originated in Iran before being loaded onto the Russian ship MV Rhosus whose cargo ultimately ended up being unloaded in the port of Beirut.
This revelation comes from an intelligence operative within Tehran’s government who has been secretly working with pro-democracy activists. The information comes from the NGO ‘The New Iran’ which has a track record of successfully smuggling sensitive information out of Iran, including much of the video footage seem in the media of widespread protests within Iran following the Iranian military shooting down Ukraine National Airlines flight PS752.
Intelligence Operative Connected to Pro-Democracy Movement
The intelligence operative communicated the details over a secure messaging technology The New Iran uses for coordinating with their democratic allies within the country.
Lebanese government sources have disclosed that the ammonium nitrate was seized in 2013. This date is perhaps significant the source says because it follows shortly after the opening of an ammonium nitrate factory within Iran.
“Our source is risking his life to bring us this information,” says Dr. Iman Foroutan, Chairman of The New Iran, “because he believes that recent developments within the government are going to make these kinds of disasters more common.”
At the end of June, the government of Iran approved an agreement for a “25-year comprehensive cooperation plan between Iran and China.”
The two countries are calling it a “strategic partnership.”
The agreement is designed to help Iran get around the punishing sanctions of the United States, which more and more is being looked at as a common enemy by both Tehran and Beijing. China will be investing $400 billion USD into Iran with an immediate payment of $320 billion USD – a substantial portion of which is going into strengthening ports and military capability.
“The Iranian regime is the world’s leading sponsor of terrorism,” says Dr. Foroutan who along with other influential Iranians in exile are working to fully expose the danger of Ayatollah Ali Khamenei’s radicalism and eventually free the Iranian people. “Now with the cover of China, one of the world’s rising superpowers, Iran will be able to move more weapons and weapons components throughout the region and the world.”
Hezbollah leader Hassan Nasrallah has already twice threatened to blow up the port of Haifa in Israel. Hezbollah allegedly sought to acquire ammonium nitrate via Syria since 2009 and tried to infiltrate the agriculture ministry in Lebanon to do so, according to leaked diplomatic cables.
In February 16, 2016 Nasrallah also said that ammonia is stored in Haifa and that there are 15,000 tons of gas Haifa and that explosions there might cause the deaths of tens of thousands of people. “the expert added that this is exactly like a nuclear bomb. In other words, Lebanon has a nuclear bomb. This is not an exaggeration.” Nasrallah laughs as he says this in the video.
https://youtu.be/hp_Pdew_sG8
“With the agreement between China and Tehran allowing the regime to ship under the cover of China, potentially deadly materials like ammonia nitrate [may be] circumventing US sanctions,” says Iman Foroutan, “The next explosion may not be an accident.” For the Silo, Lance Laytner.
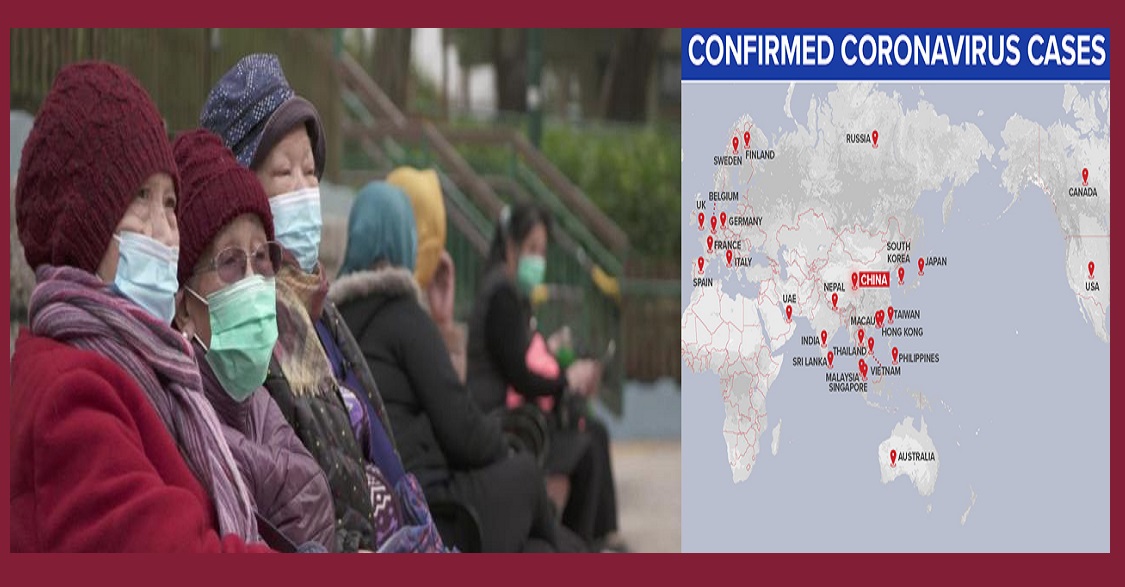
February, 2020; Paris, France – A majority of people across eight large countries say the coronavirus poses a high or very high threat to the world and an additional one in three say the virus is a moderate threat to the world.
More than one in two people in Japan (66%), Australia (61%) and the United States (55%) are concerned about the threat of the outbreak on the world. Canada (42%) and Russia (42%), the United Kingdom (43%), and Germany (47%) have slightly lower levels of high or very high threat.
These are some of the findings of an Ipsos survey conducted online from February 7 to 9, 2020 among 8,001 adults aged 16 (18) -74 in Australia, Canada, France, Germany, Japan, Russia, the United Kingdom, and the United States.
Less Than One In Five Feel Coronavirus Outbreak Contained
On average, only one in five people (19%) agree the coronavirus outbreak has been contained and will soon be over, while more than twice as many disagree (46%). People in the U.K. (55%), Canada (51%), Australia (50%), and Japan (49%) were most likely to disagree the outbreak has been contained. One in three Russian respondents believe the coronavirus outbreak has been contained (33%).
Added to that, more than four in five (86%) people across these eight countries say they have seen, heard, or read a great deal or fair amount about the outbreak.
Together, this data shows that most people are closely tracking the coronavirus outbreak and are also worried the health epidemic will continue to worsen before it gets better.
In response, there is widespread support for significant actions to control the virus. On average, four in five (85%) people support mandatory screening of those traveling from infected countries, and there is a similar level of strong support for mandatory quarantine of those who could have the infection. Two-thirds (66%) of people agree the government should ban travel to and from impacted countries, and that airlines in their country should be restricted from flying to China.
Topline data follows:
Q. How much, if at all, have you seen, read or heard about the coronavirus outbreak?
US
Canada
France
United Kingdom
Australia
Germany
Japan
Russia
Base: All respondents
1000
1000
1000
1000
1000
1001
1000
1000
A great deal
42%
40%
67%
39%
42%
27%
39%
29%
A fair amount
43%
45%
28%
54%
47%
49%
53%
48%
Not very much
12%
13%
4%
7%
9%
22%
5%
21%
Nothing at all
2%
1%
0%
1%
1%
1%
1%
1%
Don’t know
1%
1%
1%
0%
1%
1%
2%
1%
Summary
T2B: Great deal/fair amount
85%
86%
95%
92%
88%
76%
92%
77%
B2B: Nothing/Not much
14%
14%
4%
7%
10%
23%
6%
22%
Q. (The world) What level of threat do you think the coronavirus poses to each of the following?
US
Canada
France
United Kingdom
Australia
Germany
Japan
Russia
Base: All respondents
1000
1000
1000
1000
1000
1001
1000
1000
Very high threat
23%
13%
16%
12%
28%
13%
26%
11%
High threat
31%
29%
33%
31%
33%
34%
40%
30%
Moderate threat
32%
38%
34%
42%
27%
35%
27%
36%
Low threat
9%
15%
10%
11%
7%
13%
4%
14%
Very low threat
3%
3%
4%
3%
2%
3%
2%
6%
Don’t know
2%
2%
3%
2%
2%
2%
1%
2%
Summary
T2B: High threat
55%
42%
49%
43%
61%
47%
66%
42%
B3B: Low threat
43%
55%
48%
56%
37%
51%
33%
57%
Q. (The coronavirus outbreak has been contained and will soon be over.) Do you agree or disagree with the following (is that strongly or somewhat?):
US
Canada
France
United Kingdom
Australia
Germany
Japan
Russia
Base: All respondents
1000
1000
1000
1000
1000
1001
1000
1000
Strongly agree
6%
3%
2%
4%
5%
5%
2%
7%
Somewhat agree
15%
13%
14%
12%
15%
16%
13%
26%
Neither agree nor disagree
26%
26%
30%
22%
26%
33%
32%
28%
Somewhat disagree
27%
32%
29%
36%
29%
28%
31%
18%
Strongly disagree
19%
19%
13%
20%
21%
14%
18%
14%
Don’t know
7%
8%
12%
7%
5%
5%
5%
7%
Summary
T2B: Agree
21%
15%
16%
16%
19%
20%
15%
33%
B2B: Disagree
46%
51%
42%
55%
50%
42%
49%
33%
Q. (Total strongly & somewhat agree) To what extent, if at all, would you support or oppose each of the following measures?
US
Canada
France
United Kingdom
Australia
Germany
Japan
Russia
Base: All respondents
1000
1000
1000
1000
1000
1001
1000
1000
Anyone travelling to and from infected countries should undergo mandatory screening
83%
86%
87%
86%
88%
78%
78%
91%
Government should impose mandatory quarantine for those who could have the infection
79%
83%
84%
84%
87%
74%
80%
84%
Airlines from my country should stop flying to China
68%
67%
68%
70%
75%
59%
67%
61%
The government should ban any travel to and from affected countries
70%
66%
68%
66%
73%
50%
71%
64%
Public transit systems in my country, including buses, subways, and trains, should be taking precautions to prevent the further spread of coronavirus
73%
60%
56%
61%
70%
48%
76%
72%
The government should send doctors, materials, supplies abroad to help countries affected by the virus
61%
55%
52%
49%
52%
62%
56%
56%
Airlines from my country should stop flying to other infected countries besides China
62%
54%
59%
57%
59%
44%
46%
54%
About the Study
These are the results of an Ipsos survey conducted February 7-9, 2020 on the Global Advisor online platform among 8,001 adults aged 18-74 in Canada and the United States and 16-74 in Australia, France, Germany, Japan, Russia and the United Kingdom.
The sample consists of approximately 1000+ individuals in each country. The samples in Australia, Canada, France, Germany, Japan, the U.K. and the U.S. can be taken as representative of these countries’ general adult population under the age of 75. The sample in Russia is more urban, more educated and/or more affluent than the general population and should be viewed as reflecting the views of the more “connected” segment of the population. The data is weighted so that each market’s sample composition best reflects the demographic profile of the adult population according to the most recent census data.
Where results do not sum to 100 or the ‘difference’ appears to be +/-1 more/less than the actual, this may be due to rounding, multiple responses or the exclusion of don’t knows or not stated responses.
The precision of Ipsos online polls are calculated using a credibility interval with a poll of 1,000 accurate to +/- 3.5 percentage points and of 500 accurate to +/- 4.8 percentage points. For more information on the Ipsos use of credibility intervals, please visit the Ipsos website. For the Silo, by Dianne Bankay.
This study did not have any external sponsors or partners. It was initiated and run by Ipsos with the intention to share our understanding about the world we live in and how citizens around the globe think and feel about their world.
About Ipsos
Ipsos is the world’s third largest market research company, present in 90 markets and employing more than 18,000 people.
Our passionately curious research professionals, analysts and scientists have built unique multi-specialist capabilities that provide true understanding and powerful insights into the actions, opinions and motivations of citizens, consumers, patients, customers or employees. We serve more than 5000 clients across the world with 75 business solutions.
Founded in France in 1975, Ipsos is listed on the Euronext Paris since July 1st, 1999. The company is part of the SBF 120 and the Mid-60 index and is eligible for the Deferred Settlement Service (SRD).
School has ‘been in’ for awhile now. Does your child’s school lunches sound healthy to you? How do you think it compares to school dinners from around the world? And how much do school meals affect energy levels for post-lunch learning and does that have an impact on PISA test results?
Check out this infographic to discover what the school meals of other countries look like and how each nation scores on the PISA test. For the Silo, Dinah Makani.
Here in Canada, you may not have heard of Edifier but take note- their state-of-the art manufacturing facilities in China produce 8 million units every year for home, consumer electronics and PC multimedia applications. Edifier specializes in premium sound systems that showcase technological innovation and design elegance while keeping prices amazingly low.
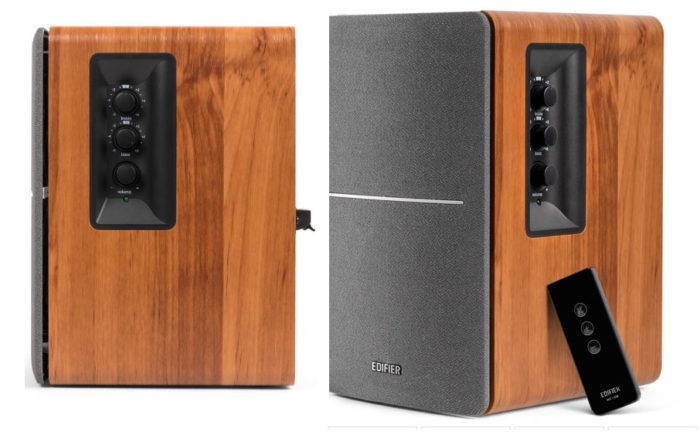
Normally if you are spending just $100 on a set of speakers you expect to be left desiring better quality. Let’s take a closer look at our review pair that arrived safely in a well packaged box. The Edifier R1280T are an affordable, entry-level set of bookshelf speakers that deliver clear and balanced sound at low or high volumes. For only $124.99CDN including free shipping to Canada these speakers set a new standard for affordable quality.
The speakers have a 102mm (4-inch) bass driver and a calibrated, flared bass reflex port augmented by a 13mm silk dome tweeter for a total output of 42W RMS (21W each speaker). An optional front cover can be removed to expose the speaker components allowing for a sleek look or a more exposed techie aesthetic. Use them with a television, computer, or other device, they sound great on any surface because of the design team’s passion for sound and for quality.
Edifier’s uncompromised design elegance is recognized internationally by prestigious design awards. Some of their designs are winners of the Red Dot Design Award, the iF Product Design Award and the CES Design & Engineering Showcase Honours.
“Inspirational design derived from architecture, furniture, automobiles, home electronics — even nature itself — provide for ideas that transform themselves into unique sensory and emotional products with functional simplicity, coupled with technological excellence. It’s a journey to provide an exceptional audio and visual experience with design elegance, innovation, features and measured risks, for whatever the application, to form a lasting end-user impression and experience.” — Anthony Wilkinson, Managing Director, Edifier International Limited
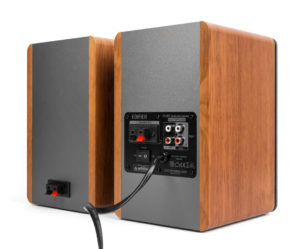
R1280T powered bookshelf speakers lets you connect to multiple audio devices using the dual RCA inputs. By looking at the back panel you can easily tell one of these is a passive speaker and one is an active speaker. The active speaker has two inputs located on the back. These inputs are perfect for RCA to RCA or RCA to AUX connections. Connect them to a PC, laptop, tablet, phone or record player. The speakers are connected to each other via regular speaker wire (included along with a generous variety of cables to ensure you enjoy your music from most devices right out of the box- if you require digital connections or bluetooth Edifier make a larger model).
Some overseas manufacturers of electronics have been questioned about their environmental impacts and strategies but refreshingly, Edifier are committed to best operating practices.
Use suppliers of raw materials who practice environmentally friendly manufacturing.
Use LED and T5 lighting in all office floors and manufacturing facility.
Install solar panels for water heating.
Use Biological Liquid Processing to reduce and filter fume emissions.
Use Membrane Bioreactors to recycle waste water
For environmentally conscious, budget minded individuals looking for a solid entry level speaker with the convenience of remote control and easy hook-up you can’t go wrong choosing the R1280T. Highly recommended.
We spent several days and evenings having fun with these speakers in a small bedroom Laserdisc and projector bookshelf setup. The sound quality was quite nice, dialogue was easy to understand and stereo soundtracks came to life, even with a noisy air conditioner running and the fan noise from the projector.
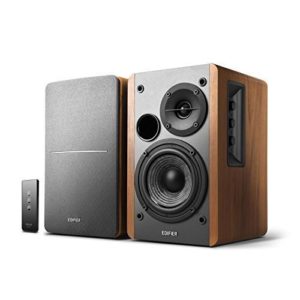
The speakers will most likely benefit from a break in period as new drivers tend to have a slight compression effect that is alleviated as the speaker suspension is stretched from playing source material. These speakers fit nicely onto the shelf and were easy to position and operate, we were pleasantly surprised by the handy mini remote control that arrived with batteries included. For darker watching conditions we left the front grilles in place but would be happy to remove them and show off the nicely designed faux woodgrain cabinet sides in brighter conditions. Highly recommended…
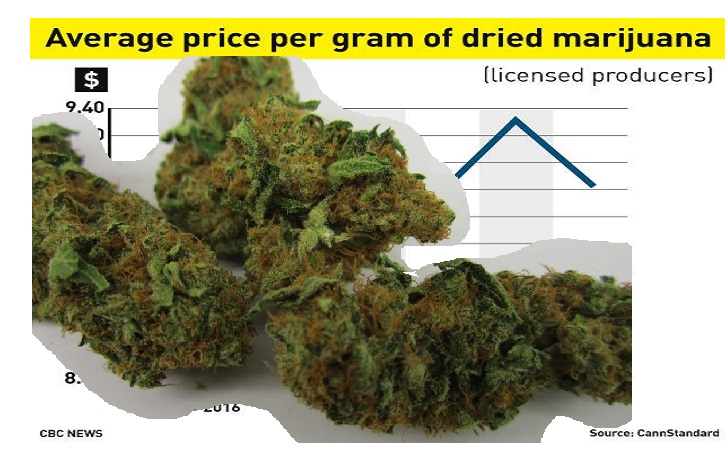
2018 Weed Index Study reveals the cost of marijuana and highlights the number of grow and head shops in 120 cities around the world:
With a total of 156, Los Angeles, USA has the most headshops.
Madrid, Spain has the largest amount of growshops, with a total of 68.
Tokyo, Japan has the most expensive cannabis, at 32.66 USD per gram, while Quito, Ecuador has the least expensive marijuana, at 1.34 USD per gram.
Based on the average US marijuana tax rates currently implemented, New York City could generate the highest potential tax revenue by legalising weed, with 156.40 million USD per year. New York City also has the highest consumption rate of cannabis, at 77.44 metric tons per year.
Berlin, Germany, 20/04/2018 – ABCD, a data-driven media campaign outlet, has released new data which reveals the number of marijuana head and growshops in 120 cities around the world. This research, which builds on the 2018 Cannabis Price Index released earlier this year, reveals which locations around the world are ready to embrace cannabis legalisation. The aim of the study is to illustrate the continuous need for legislative reform on cannabis use around the world, and to determine if there are any lessons to be learned from those cities at the forefront of marijuana legalization. By including extra data on the number of head and growshops in each city, this new research can be utilized to indicate which cities are prepared for an imminent cannabis reform, while also highlighting which cities are in opposition of marijuana legalisation.
The initial study began by selecting 120 cities across the world, including locations where cannabis is currently legal, illegal and partially legal, and where marijuana consumption data is available. Then, they looked into the price of weed per gram in each city. To calculate how much potential tax a city could make by legalising weed, ABCD investigated how much tax is paid on the most popular brand of cigarettes, as this offers the closest comparison. They then looked at what percentage marijuana is currently taxed in cities where it’s already legalised in the US.
ABCD decided to conduct the extra research in order to to further the discussion around the medical and recreational use of cannabis, and the potential industry and business opportunities that would follow legalisation. By identifying the number of headshops as well as growshops, this study serves as an indicator to a city’s existing cannabis infrastructure and willingness to accept such reform on a larger scale. As an indicating factor, the more head shops and grow shops a city has, the more positive their state’s and general public’s attitude towards the cannabis-related industry is likely to be.
The table below reveals a sample of the results for the 13 US cities featured in the study:
#
City
Legality
Price per gram, US$
Total possible tax collection, if taxed at cigarette level, mil US$
Total possible tax collection, if taxed at average US marijuana taxes, mil US$
Total consumption in metric tons
Headshops
Growshops
1
Washington, DC
Partial
18.08
47.51
20.96
6.18
20
8
2
Chicago
Partial
11.46
119.61
52.77
24.54
91
10
3
Philadelphia
Partial
11.30
68.37
30.16
14.22
41
3
4
Boston
Legal
11.01
28.59
12.61
6.10
49
4
5
New York
Partial
10.76
354.48
156.40
77.44
59
7
6
Dallas
Partial
10.03
51.01
22.5
11.95
80
6
7
Houston
Partial
10.03
89.13
39.32
20.89
125
14
8
Phoenix
Partial
9.35
58.26
25.71
14.65
72
9
9
Miami
Partial
9.27
16.24
7.16
4.12
67
25
10
San Francisco
Legal
9.27
30.94
13.65
7.85
61
3
11
Los Angeles
Legal
8.14
124.88
55.10
36.06
153
46
12
Denver
Legal
7.79
20.53
9.06
6.20
61
21
13
Seattle
Legal
7.58
20.59
9.08
6.39
46
10
The table below shows the top 10 most and least expensive cities for cannabis:
Top 10 Most Expensive Cities
Top 10 Least Expensive Cities
#
City
Country
Legality
Price per gram, US$
#
City
Country
Legality
Price per gram, US$
1
Tokyo
Japan
Illegal
32.66
1
Quito
Ecuador
Partial
1.34
2
Seoul
South Korea
Illegal
32.44
2
Bogota
Colombia
Partial
2.20
3
Kyoto
Japan
Illegal
29.65
3
Asuncion
Paraguay
Partial
2.22
4
Hong Kong
China
Illegal
27.48
4
Jakarta
Indonesia
Illegal
3.79
5
Bangkok
Thailand
Partial
24.81
5
Panama City
Panama
Illegal
3.85
6
Dublin
Ireland
Illegal
21.63
6
Johannesburg
South Africa
Illegal
4.01
7
Tallinn
Estonia
Partial
20.98
7
Montevideo
Uruguay
Legal
4.15
8
Shanghai
China
Illegal
20.82
8
Astana
Kazakhstan
Illegal
4.22
9
Beijing
China
Illegal
20.52
9
Antwerp
Belgium
Partial
4.29
10
Oslo
Norway
Partial
19.14
10
New Delhi
India
Partial
4.38
The table Below shows the top 10 cities with the most growshops:
#
City
Country
Legality
Growshops
1
Madrid
Spain
Partial
68
2
Buenos Aires
Argentina
Partial
48
3
Los Angeles
USA
Legal
46
4
Toronto
Canada
Partial
37
5
Melbourne
Australia
Partial
31
6
Miami
USA
Partial
25
7
London
UK
Illegal
23
8
Barcelona
Spain
Partial
23
9
Denver
USA
Legal
21
10
Berlin
Germany
Partial
20
The table Below shows the top 10 cities with the most headshops:
#
City
Country
Legality
Headshops
1
Los Angeles
USA
Legal
156
2
Houston
USA
Partial
125
3
Chicago
USA
Partial
91
4
Dallas
USA
Partial
80
5
Phoenix
USA
Partial
72
6
Miami
USA
Partial
67
7
San Francisco
USA
Legal
61
8
Denver
USA
Legal
61
9
New York
USA
Partial
59
10
Boston
USA
Legal
49
The table below shows the top 10 cities who could generate the most potential tax by legalising cannabis, if taxed at the same rate as the most popular cigarette brand:
#
City
Country
Legality
Price per gram, US$
% of cigarette tax
Possible tax revenue, mil US$
1
Cairo
Egypt
Illegal
16.15
73.13
384.87
2
New York
USA
Partial
10.76
42.54
354.48
3
London
UK
Illegal
9.20
82.16
237.35
4
Sydney
Australia
Partial
10.79
56.76
138.36
5
Karachi
Pakistan
Illegal
5.32
60.7
135.48
6
Melbourne
Australia
Partial
10.84
56.76
132.75
7
Moscow
Russia
Partial
11.84
47.63
128.97
8
Toronto
Canada
Partial
7.82
69.8
124.15
9
Chicago
USA
Partial
11.46
42.54
119.61
10
Berlin
Germany
Partial
13.53
72.9
114.77
N.B. % of cigarette tax refers to the tax percentage on the most popular brand. Possible tax revenue refers to the total possible tax collection per year, if taxed at cigarette level. For a full explanation of how the study was conducted, please see the methodology at the bottom of the press release.
The table below shows the top 10 cities who could generate the most potential tax by legalising cannabis, if taxed at the average US marijuana tax rate:
#
City
Country
Legality
Price per gram, US$
Possible tax revenue, mil US$
1
New York
USA
Partial
10.76
156.4
2
Cairo
Egypt
Illegal
16.15
98.78
3
London
UK
Illegal
9.20
54.22
4
Chicago
USA
Partial
11.46
52.77
5
Moscow
Russia
Partial
11.84
50.82
6
Sydney
Australia
Partial
10.79
45.75
7
Melbourne
Australia
Partial
10.84
43.9
8
Karachi
Pakistan
Illegal
5.32
41.89
9
Houston
USA
Partial
10.03
39.32
10
Toronto
Canada
Partial
7.82
33.38
N.B. Possible tax revenue refers to the total possible tax collection per year, if taxed at average US marijuana tax rate.
The table below shows the top 10 cities with the highest and lowest consumption of cannabis, per year:
Highest Consumers of Cannabis
Lowest Consumers of Cannabis
#
City
Country
Legality
Price per gram, US$
Total consumption, metric tons
#
City
Country
Legality
Price per gram, US$
Total consumption, metric tons
1
New York
USA
Partial
10.76
77.44
1
Singapore
Singapore
Illegal
14.01
0.02
2
Karachi
Pakistan
Illegal
5.32
41.95
2
Santo Domingo
Dominican Rep.
Illegal
6.93
0.16
3
New Delhi
India
Partial
4.38
38.26
3
Kyoto
Japan
Illegal
29.65
0.24
4
Los Angeles
USA
Legal
8.14
36.06
4
Thessaloniki
Greece
Partial
13.49
0.29
5
Cairo
Egypt
Illegal
16.15
32.59
5
Luxembourg City
Luxembourg
Partial
7.26
0.32
6
Mumbai
India
Partial
4.57
32.38
6
Panama City
Panama
Illegal
3.85
0.37
7
London
UK
Illegal
9.20
31.4
7
Reykjavik
Iceland
Illegal
15.92
0.44
8
Chicago
USA
Partial
11.46
24.54
8
Asuncion
Paraguay
Partial
2.22
0.46
9
Moscow
Russia
Partial
11.84
22.87
9
Colombo
Sri Lanka
Illegal
9.12
0.59
10
Toronto
Canada
Partial
7.82
22.75
10
Manila
Philippines
Illegal
5.24
0.6
N.B. Total consumption is calculated per annum.
Further findings:
Shanghai, China has a large population of 24.15 million, has however no headshops or growshops in the city, underlining a resistance against cannabis reform.
On average, the status of legality (e.g. Legal, Partial or Illegal) coincides with the amount of headshops and growshops found in each city. The favourable the laws, the better the cannabis infrastructure
New York City, USA has the highest consumption rate of cannabis, at 77.44 metric tons per year.
Boston, USA has the most expensive cannabis of all the cities where it’s legal, at 11.01 USD, while Montevideo, Uruguay has the least expensive at 4.15 USD.
While Tokyo, Japan has the most expensive cannabis of all cities where it’s illegal, at 32.66 USD, Jakarta, Indonesia has the least expensive at 3.79 USD, despite being classed as a Group 1 drug with harsh sentences such as life imprisonment and the death penalty.
For cities where cannabis is partially legal, Bangkok, Thailand has the most expensive at 24.81 USD, while Quito, Ecuador has the least expensive at 1.34 USD.
Bulgaria has the highest tax rates for the most popular brand of cigarettes, at 82.65%, while Paraguay has the lowest, with rates of 16%.
Cairo, Egypt would gain the most revenue in tax if they were to legalise cannabis and tax it as the same rate as cigarettes, at 384.87 million USD. Singapore, Singapore would gain the least, at 0.14 million USD, due in part to the city’s low consumption of marijuana at 0.02 metric tons per annum.
Based on the average US marijuana tax rates currently implemented, New York City could generate the highest potential tax revenue by legalising weed, with 156.4 million USD per year. Singapore, Singapore would gain the least, at 0.04 million USD.
The full results of the 2018 Cannabis Price Index:
#
City
Country
Legality
Price per gram, US$
Taxes of cigarettes, % of the most sold brand
Total possible tax collection, if taxed at cigarette level, mil US$
Total possible tax collection, if taxed at average US marijuana taxes, mil US$
Total Consumption in metric tons
1
Tokyo
Japan
Illegal
32.66
64.36
32.14
9.37
1.53
2
Seoul
South Korea
Illegal
32.44
61.99
31.61
9.57
1.57
3
Kyoto
Japan
Illegal
29.65
64.36
4.64
1.35
0.24
4
Hong Kong
China
Illegal
27.48
44.43
19.72
8.33
1.62
5
Bangkok
Thailand
Partial
24.81
73.13
99.11
25.44
5.46
6
Dublin
Ireland
Illegal
21.63
77.80
29.31
7.07
1.74
7
Tallinn
Estonia
Partial
20.98
77.24
22.13
5.38
1.37
8
Shanghai
China
Illegal
20.82
44.43
49.12
20.75
5.31
9
Beijing
China
Illegal
20.52
44.43
43.10
18.21
4.73
10
Oslo
Norway
Partial
19.14
68.83
19.28
5.26
1.46
11
Washington, DC
USA
Partial
18.08
42.54
47.51
20.96
6.18
12
Cairo
Egypt
Illegal
16.15
73.13
384.87
98.78
32.59
13
Reykjavik
Iceland
Illegal
15.92
56.40
3.97
1.32
0.44
14
Belfast
Ireland
Illegal
15.81
77.80
13.55
3.27
1.10
15
Minsk
Belarus
Illegal
15.80
51.15
9.08
3.33
1.12
16
Athens
Greece
Partial
14.95
79.95
7.42
1.74
0.62
17
Auckland
New Zealand
Partial
14.77
77.34
106.03
25.73
9.28
18
Munich
Germany
Partial
14.56
72.90
50.90
13.10
4.80
19
Helsinki
Finland
Partial
14.42
81.53
27.12
6.24
2.31
20
Singapore
Singapore
Illegal
14.01
66.23
0.14
0.04
0.02
21
Berlin
Germany
Partial
13.53
72.90
114.77
29.55
11.64
22
Stuttgart
Germany
Partial
13.50
72.90
20.20
5.20
2.05
23
Thessaloniki
Greece
Partial
13.49
79.95
3.17
0.75
0.29
24
Stockholm
Sweden
Illegal
13.20
68.84
15.06
4.11
1.66
25
Vienna
Austria
Partial
12.87
74.00
59.21
15.02
6.22
26
Copenhagen
Denmark
Partial
12.47
74.75
20.65
5.18
2.22
27
Moscow
Russia
Partial
11.84
47.63
128.97
50.82
22.87
28
Hamburg
Germany
Partial
11.64
72.90
50.16
12.92
5.91
29
Chicago
USA
Partial
11.46
42.54
119.61
52.77
24.54
30
Philadelphia
USA
Partial
11.30
42.54
68.37
30.16
14.22
31
Bucharest
Romania
Partial
11.18
75.41
17.23
4.29
2.04
32
Cologne
Germany
Partial
11.14
72.90
28.51
7.34
3.51
33
Geneva
Switzerland
Partial
11.12
61.20
5.90
1.81
0.87
34
Boston
USA
Legal
11.01
42.54
28.59
12.61
6.10
35
Adelaide
Australia
Partial
10.91
56.76
41.60
13.75
6.72
36
Istanbul
Turkey
Partial
10.87
82.13
21.79
4.98
2.44
37
Melbourne
Australia
Partial
10.84
56.76
132.75
43.90
21.58
38
Sydney
Australia
Partial
10.79
56.76
138.36
45.75
22.59
39
New York
USA
Partial
10.76
42.54
354.48
156.40
77.44
40
Düsseldorf
Germany
Partial
10.70
72.90
15.82
4.07
2.03
41
Brisbane
Australia
Partial
10.63
56.76
66.88
22.12
11.09
42
Hanover
Germany
Partial
10.51
72.90
13.46
3.47
1.76
43
Prague
Czech Rep.
Partial
10.47
77.42
63.95
15.50
7.89
44
Frankfurt
Germany
Partial
10.29
72.90
18.06
4.65
2.41
45
Wellington
New Zealand
Partial
10.11
77.34
19.53
4.74
2.50
46
Dallas
USA
Partial
10.03
42.54
51.01
22.50
11.95
47
Houston
USA
Partial
10.03
42.54
89.13
39.32
20.89
48
Vilnius
Lithuania
Illegal
10.00
75.76
5.20
1.29
0.69
49
Zurich
Switzerland
Partial
9.71
61.20
10.33
3.17
1.74
50
Montpellier
France
Illegal
9.70
80.30
12.21
2.85
1.57
51
Canberra
Australia
Partial
9.65
56.76
10.96
3.63
2.00
52
Zagreb
Croatia
Partial
9.43
75.26
24.35
6.07
3.43
53
Nice
France
Illegal
9.40
80.30
15.80
3.69
2.09
54
Phoenix
USA
Partial
9.35
42.54
58.26
25.71
14.65
55
Paris
France
Illegal
9.30
80.30
102.25
23.90
13.69
56
Miami
USA
Partial
9.27
42.54
16.24
7.16
4.12
57
San Francisco
USA
Legal
9.27
42.54
30.94
13.65
7.85
58
London
UK
Illegal
9.20
82.16
237.35
54.22
31.40
59
Colombo
Sri Lanka
Illegal
9.12
73.78
3.98
1.01
0.59
60
Riga
Latvia
Illegal
9.00
76.89
10.23
2.50
1.48
61
Bratislava
Slovakia
Illegal
8.92
81.54
7.24
1.67
1.00
62
Milan
Italy
Partial
8.85
75.68
46.06
11.42
6.88
63
Varna
Bulgaria
Illegal
8.83
82.65
4.84
1.10
0.66
64
Marseille
France
Illegal
8.69
80.30
36.23
8.47
5.19
65
Glasgow
UK
Illegal
8.65
82.16
15.21
3.47
2.14
66
Toulouse
France
Illegal
8.62
80.30
18.67
4.36
2.70
67
Birmingham
UK
Illegal
8.58
82.16
27.73
6.34
3.93
68
Kuala Lumpur
Malaysia
Illegal
8.54
55.36
6.61
2.24
1.40
69
Monterrey
Mexico
Partial
8.45
65.87
4.17
1.19
0.75
70
Edinburgh
UK
Illegal
8.41
82.16
12.22
2.79
1.77
71
Lisbon
Portugal
Partial
8.36
74.51
4.69
1.18
0.75
72
Strasbourg
France
Illegal
8.35
80.30
11.13
2.60
1.66
73
Warsaw
Poland
Partial
8.31
80.29
29.27
6.84
4.39
74
Lyon
France
Illegal
8.20
80.30
19.45
4.55
2.95
75
Los Angeles
USA
Legal
8.14
42.54
124.88
55.10
36.06
76
Liverpool
UK
Illegal
7.94
82.16
10.86
2.48
1.67
77
Amsterdam
Netherlands
Partial
7.89
73.40
20.94
5.35
3.61
78
Manchester
UK
Illegal
7.88
82.16
58.99
13.48
9.11
79
Rome
Italy
Partial
7.86
75.68
88.16
21.86
14.82
80
Toronto
Canada
Partial
7.82
69.80
124.15
33.38
22.75
81
Denver
USA
Legal
7.79
42.54
20.53
9.06
6.20
82
Naples
Italy
Partial
7.75
75.68
29.82
7.40
5.08
83
Leeds
UK
Illegal
7.67
82.16
16.93
3.87
2.69
84
Seattle
USA
Legal
7.58
42.54
20.59
9.08
6.39
85
Madrid
Spain
Partial
7.47
78.09
93.40
22.45
16.01
86
Calgary
Canada
Partial
7.30
69.80
52.23
14.05
10.25
87
Luxembourg City
Luxembourg
Partial
7.26
70.24
1.62
0.43
0.32
88
San Jose
Costa Rica
Partial
7.23
69.76
7.84
2.11
1.56
89
Buenos Aires
Argentina
Partial
7.13
69.84
25.32
6.81
5.09
90
Brussels
Belgium
Partial
7.09
75.92
15.50
3.83
2.88
91
Santo Domingo
Dominican Rep.
Illegal
6.93
58.87
0.67
0.21
0.16
92
Graz
Austria
Partial
6.84
74.00
4.81
1.22
0.95
93
Budapest
Hungary
Illegal
6.74
77.26
7.70
1.87
1.48
94
Sofia
Bulgaria
Illegal
6.66
82.65
12.83
2.91
2.33
95
Ottawa
Canada
Partial
6.62
69.80
35.43
9.53
7.67
96
Vancouver
Canada
Partial
6.40
69.80
23.44
6.30
5.25
97
Sao Paulo
Brazil
Partial
6.38
64.94
68.55
19.81
16.55
98
Rotterdam
Netherlands
Partial
6.33
73.40
12.75
3.26
2.74
99
Ljubljana
Slovenia
Partial
6.32
80.41
3.43
0.80
0.67
100
Barcelona
Spain
Partial
6.23
78.09
39.59
9.51
8.14
101
Montreal
Canada
Partial
6.15
69.80
60.52
16.27
14.10
102
Kiev
Ukraine
Partial
6.00
74.78
14.73
3.70
3.28
103
Abuja
Nigeria
Illegal
5.88
20.63
7.40
6.73
6.10
104
Lima
Peru
Partial
5.88
37.83
12.28
6.09
5.52
105
Mexico City
Mexico
Partial
5.87
65.87
22.58
6.43
5.84
106
Cape Town
South Africa
Illegal
5.82
48.80
2.47
0.95
0.87
107
Karachi
Pakistan
Illegal
5.32
60.70
135.48
41.89
41.95
108
Manila
Philippines
Illegal
5.24
74.27
2.32
0.59
0.60
109
Rio de Janeiro
Brazil
Partial
5.11
64.94
28.82
8.33
8.69
110
Mumbai
India
Partial
4.57
60.39
89.38
27.78
32.38
111
New Delhi
India
Partial
4.38
60.39
101.20
31.45
38.26
112
Antwerp
Belgium
Partial
4.29
75.92
4.10
1.01
1.26
113
Astana
Kazakhstan
Illegal
4.22
39.29
1.78
0.85
1.07
114
Montevideo
Uruguay
Legal
4.15
66.75
19.54
5.50
7.06
115
Johannesburg
South Africa
Illegal
4.01
48.80
3.76
1.45
1.92
116
Panama City
Panama
Illegal
3.85
56.52
0.81
0.27
0.37
117
Jakarta
Indonesia
Illegal
3.79
53.40
1.92
0.68
0.95
118
Asuncion
Paraguay
Partial
2.22
16.00
0.16
0.19
0.46
119
Bogota
Colombia
Partial
2.20
49.44
15.80
6.00
14.53
120
Quito
Ecuador
Partial
1.34
70.39
0.56
0.15
0.60
Methodology
Selection of the cities:
To select the cities for the study, Seedo first looked at the top and bottom cannabis consuming countries around the world. Then they analysed nations where marijuana is partially or completely legal, as well as illegal, and selected the final list of 120 cities in order to best offer a representative comparison of the global cannabis price.
Data:
Price per gram, US$ – Crowdsourced city-level surveys adjusted to World Drug Report 2017 of the United Nations Office on Drugs and Crime.
Taxes on Cigarettes, % of the most sold brand – Taxes as a percentage of the retail price of the most sold brand (total tax). Source: Appendix 2 of the WHO report on the global tobacco epidemic, 2015.
Annual possible tax collection is calculated in the following way:
Population: latest available local population data sources.
Annual Prevalence (percentage of population, having used weed in the year). Source: World Drug Report 2017 of the United Nations Office on Drugs and Crime
Average Consumption of weed per year in grams (people who consumed weed at least once in the previous year).
Estimation, with the assumption, that one use of weed on average means one joint.
One joint is assumed to have 0.66 grams of weed as in the paper of Mariani, Brooks, Haney and Levin (2010).
The distribution of use during the year is assumed to be the same as in Zhao and Harris (2004), where the yearly usage varies from once or twice a year to everyday.
US tax level – Average tax level in the states of US where weed is legal: Alaska, California, Colorado, Maine, Massachusetts, Nevada, Oregon and Washington. Includes retail sales taxes, state taxes, local taxes and excise taxes.
Growshops – Sourced via Google Maps Listings 2018
Headshops – Sourced via Google Maps Data Listings 2018
Legality
Legal, if possession and selling for recreational and medical use is legal.
Illegal, if possession and selling for recreational and medical use is illegal.
Partial, if
Possession of small amounts is decriminalised (criminal penalties lessened, fines and regulated permits may still apply)
OR medicinal use legal
OR possession is legal, selling illegal
OR scientific use legal
OR usage allowed in restricted areas (e.g. homes or coffee shops)
OR local laws may apply to legality (e.g. illegal at federal level, legal at state level)
First quote: Based on New York City Council’s free lunch initiative which began in September 2017, with 1.1 million public school children, at a cost of $1.75 per child per day.
Based in Hangzou, China, AliExpress is a global e-commerce platform made up of small business sellers offering a wide variety of consumer products worldwide. This growing platform already has (at the time of this writing) over 3 million likes on Facebook. An impressive number that speaks to the desirability of products on hand.
What makes AliExpress unique is the cellular nature of its structure. Many small businesses looking for a safe harbor are connected together and operate under the umbrella support of the larger corporate structure. Is this the ‘best of both worlds?’ We think it’s an interesting model and worth paying attention to. After all, a smaller company no longer has to struggle to develop an online identity or spend valuable resources designing and implementing a shopping ap. Yep- AliExpress has a pretty cool Ap that allows you to shop from Facebook and beyond…
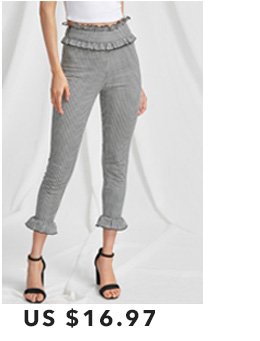
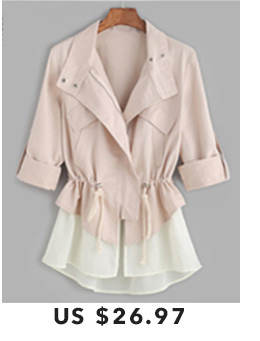
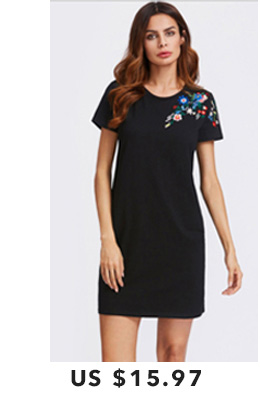
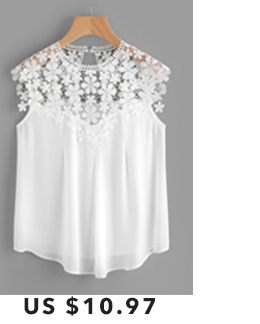
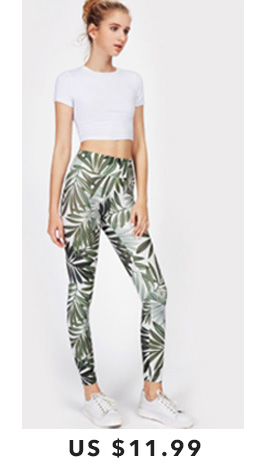
Here’s a look at some of its Fashion small business sellers- Did you find something you like?
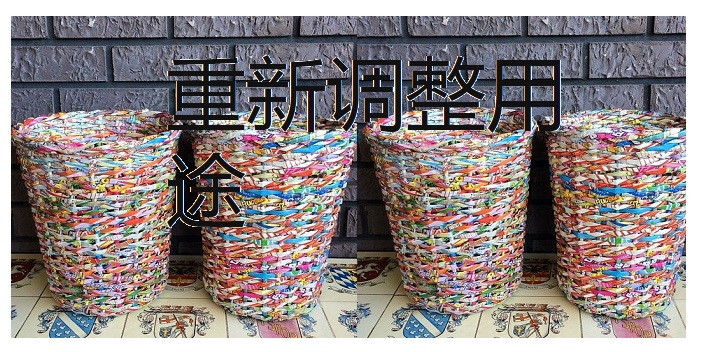
Okay I admit it, newspapers are dead. But maybe in China they aren’t. Or are. Because in a local bargain shop I discovered a cache of wastebaskets in three different sizes made entirely out of newspapers: Chinese newspapers to be exact. And that started me thinking.
It seems probable that in China, or somewhere near there, an active recycling program is taking place. Instead of shredding or burning them for landfill, some sort of manufacturing facility is turning clean, bright and seemingly unread newspapers into functional everyday objects. Does this mean that the newspaper industry is suffering in China? Is there a surplus of printed newspapers? Are more Chinese people getting their news from digital media than print? Who can say. My phone calls to the Chinese embassy consulate in Toronto about these pressing issues were not returned.
The irony of wastebaskets made out of, well, waste, is not (ahem) wasted on me.
These products are powerful “green” metaphors produced in one of the most polluting nations on the planet. The industrialization of China is full steam ahead and damn the torpedoes. Consumer goods? They want everything we have, so it’s hard to claim any moral high ground. Anyway, there is an environmental statement here, intended or not. I’m just not sure what it is.
On the other hand, they are just really fun and handy wastebaskets that feel great when you pick them up by their long, soft handles. I kind of want one.
Supplemental:
In Jennifer Baichwal’s film Manufacturing Landscapes, about Canadian photographer Edward Burtynsky, we learn there are whole towns in China dedicated to breaking down and “smelting” the useable metals out of discarded electronics. When you choose to buy a new DVD player because it’s cheaper than repairing your old one, this is likely where your old one goes. Apparently you can smell these towns a mile off. The Chinese government sure knows a thing or two about recycling. But what would it cost to do this kind of metal recovery safely? What would it cost to make baskets out of the millions of unread, discarded and obsolete print newspapers in Canada?


 The speakers have a 102mm (4-inch) bass driver and a calibrated, flared bass reflex port augmented by a 13mm silk dome tweeter for a total output of 42W RMS (21W each speaker). An optional front cover can be removed to expose the speaker components allowing for a sleek look or a more exposed techie aesthetic. Use them with a television, computer, or other device, they sound great on any surface because of the design team’s passion for sound and for quality.
 R1280T powered bookshelf speakers lets you connect to multiple audio devices using the dual RCA inputs. By looking at the back panel you can easily tell one of these is a passive speaker and one is an active speaker. The active speaker has two inputs located on the back. These inputs are perfect for RCA to RCA or RCA to AUX connections. Connect them to a PC, laptop, tablet, phone or record player. The speakers are connected to each other via regular speaker wire (included along with a generous variety of cables to ensure you enjoy your music from most devices right out of the box- if you require digital connections or bluetooth Edifier make a larger model).