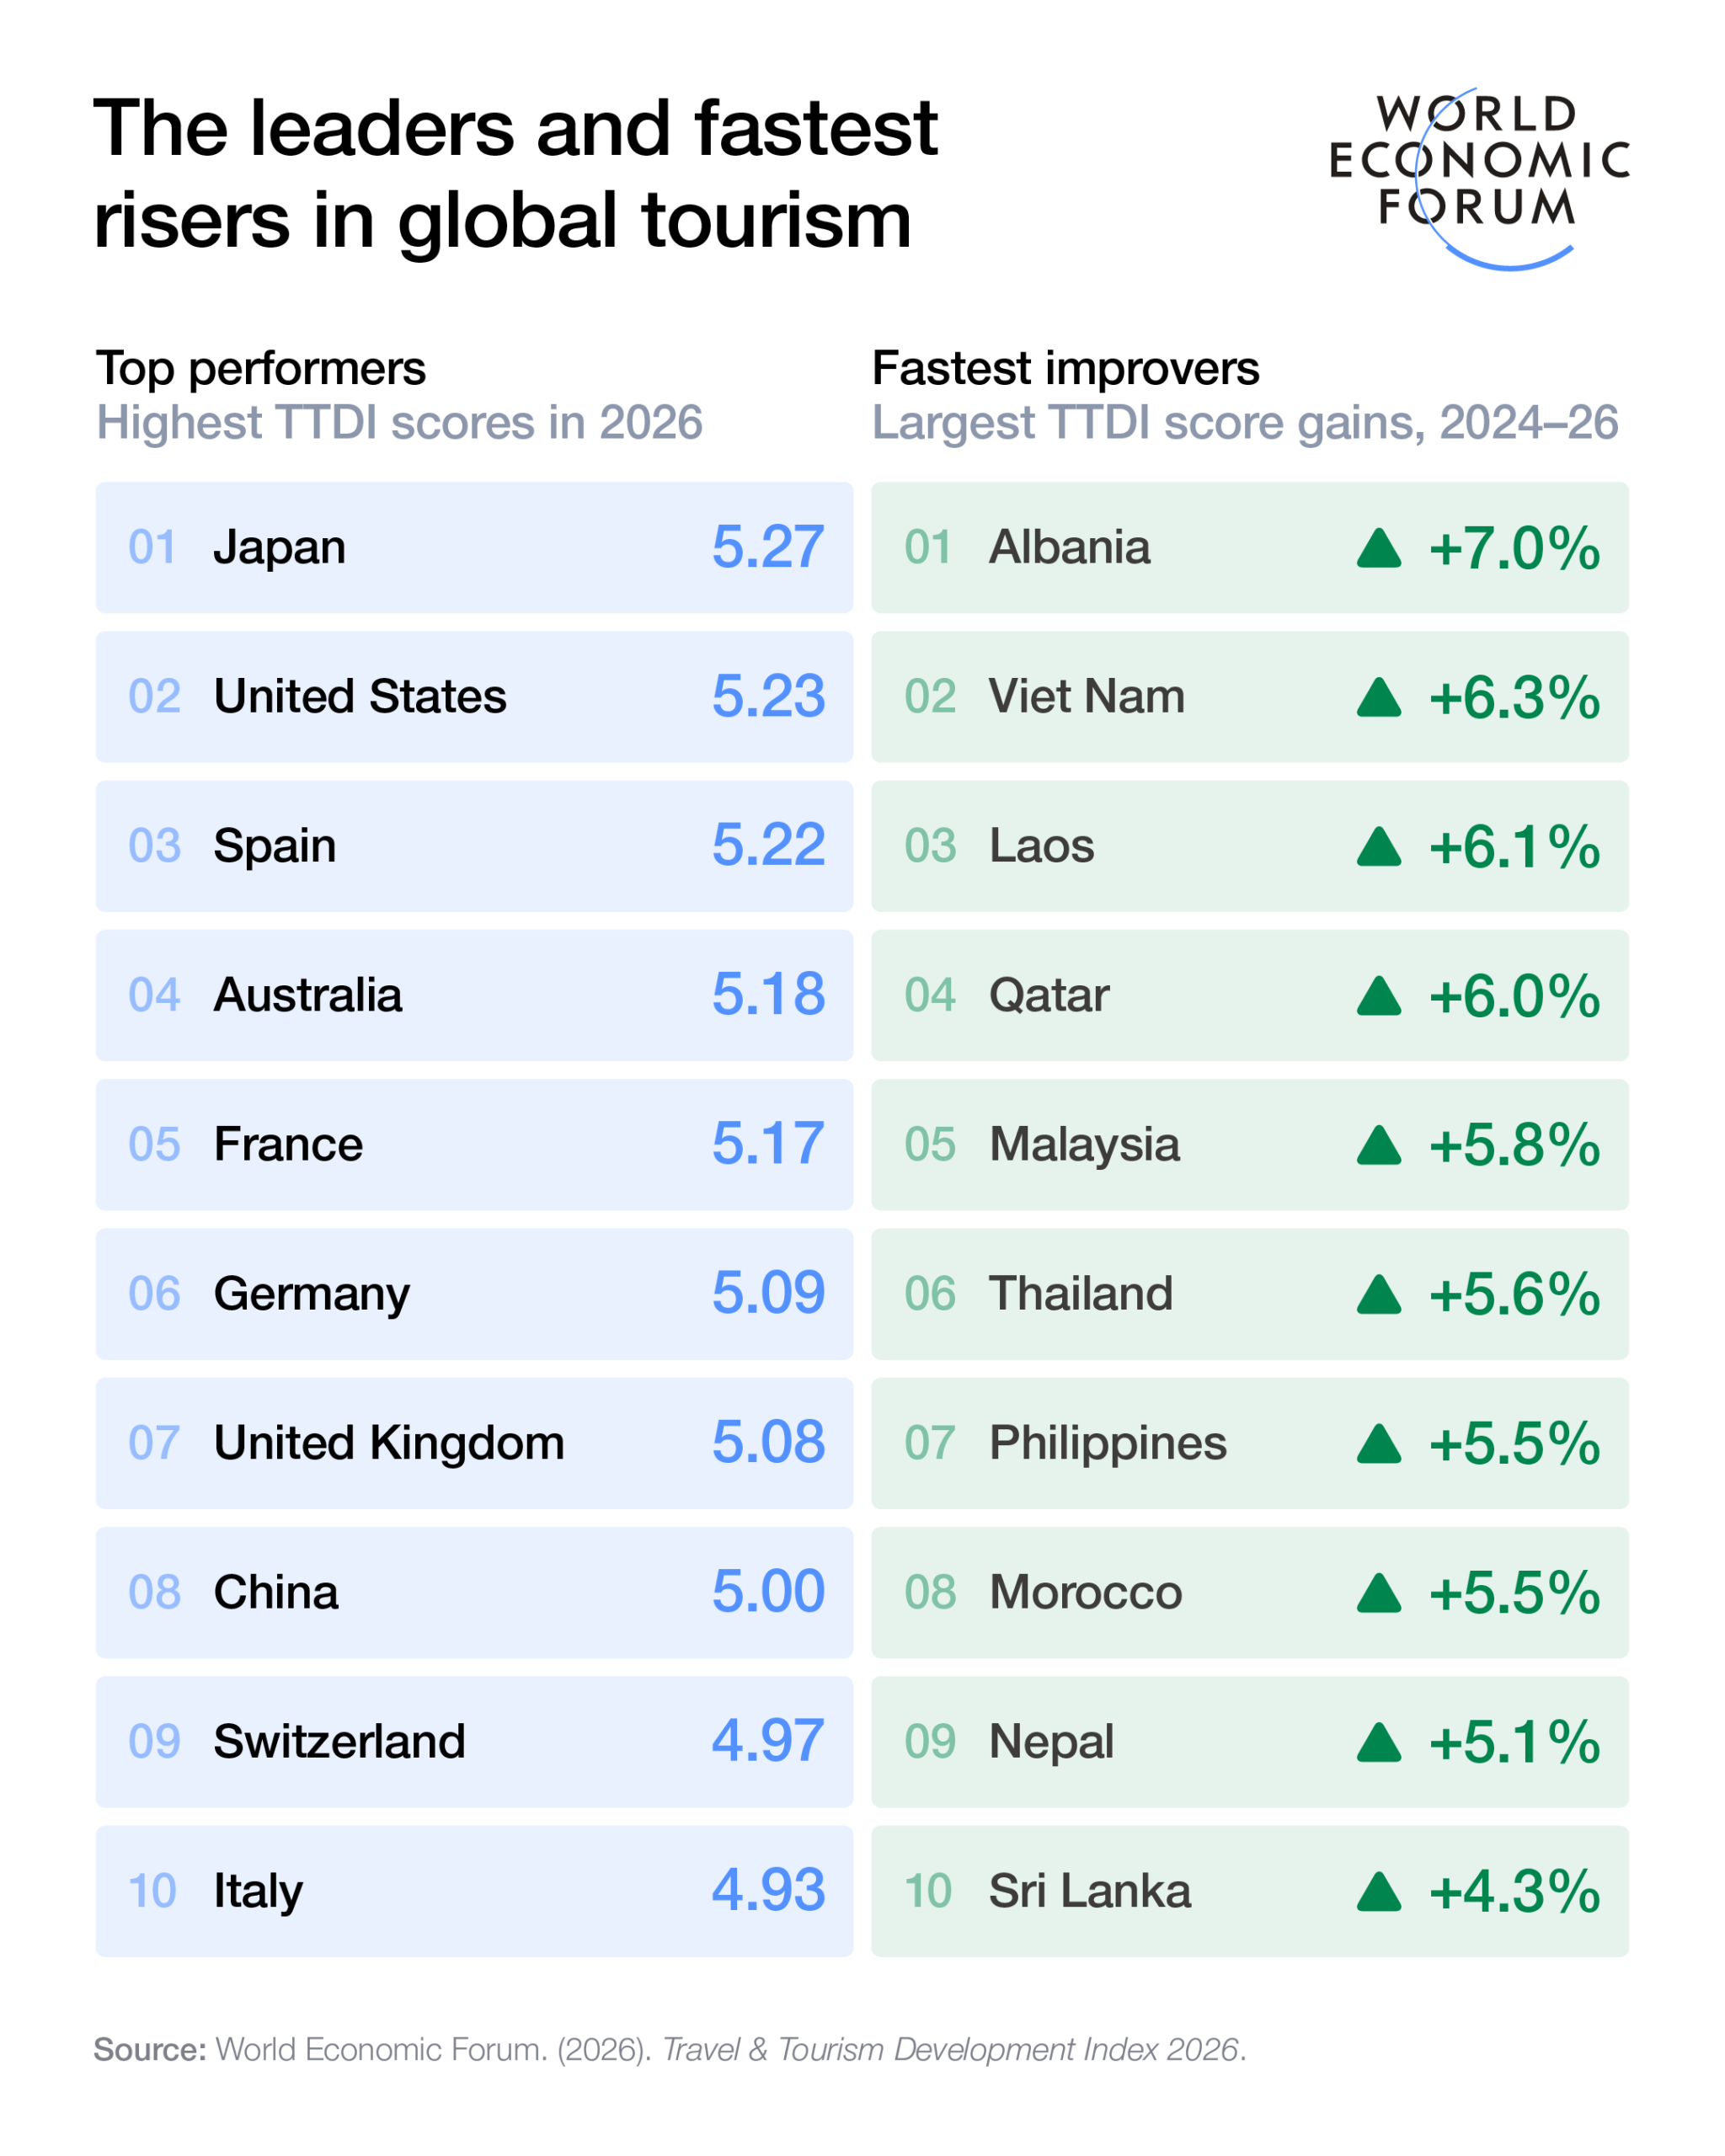
Travel and tourism development conditions are at their strongest since 2019: 92% of the 110 economies in the 2026 Travel & Tourism Development Index (TTDI) improved their score since 2024, with Japan taking the top position.
Advanced economies hold nine of the top 10 spots, while the largest emerging tourism economies have improved their scores more than twice as fast as the Top 20 since 2019.
The Index will launch at Beyond Tourism Day in Geneva, bringing together senior leaders from business, government and civil society under the theme “Resilient Growth. Renewed Impact”.
Geneva, Switzerland, September 2026– Travel and tourism conditions have strengthened across most of the world, a new World Economic Forum report finds, but destinations face a growing challenge: turning record demand into lasting value amid rising costs, geopolitical and climate disruption, workforce shortages and mounting pressure on infrastructure and communities.
Developed in collaboration with Zurich Insurance Group, the 10th edition of the Travel & Tourism Development Index (TTDI) 2026, launched recentlat Beyond Tourism Day, finds that 101 of 110 ranked economies improved their scores between 2024 and 2026, with the average rising 2.1% – the fastest pace since 2019. Gains were driven by increased cultural resources, tourism infrastructure and services, and air connectivity and business travel. Japan leads the Index, followed by the United States, Spain, Australia and France.
“The latest Travel & Tourism Development Index shows that the enabling conditions for travel and tourism are at their strongest since the pandemic, with 92% of economies improving since 2024,” said Ramya Krishnaswamy, Head of Experience Economy and Cities, World Economic Forum. “The next chapter is not simply about attracting more visitors, but it is going to be about creating greater value by investing in people, infrastructure and stronger public-private collaboration so tourism delivers lasting benefits for communities, businesses and destinations.”
The Index also shows that tourism is facing growing challenges.
Between 2024 and 2026, travel became less affordable in three out of four economies, while tourism investment failed to keep pace with rising demand and labour shortages threatened further growth. Benefits for local communities also weakened during this period, highlighting that more visitors do not automatically translate into better livelihoods or higher quality jobs, particularly in destinations where tourism is highly seasonal.
Despite these pressures, emerging tourism economies are gaining ground. Since 2019, the largest emerging economies have improved their TTDI scores more than twice as fast as the Top 20, with Asia-Pacific economies accounting for seven of the 10 fastest-improving performers. Albania recorded the largest overall gain between 2024 and 2026.
“Tourism is a major part of the global economy, and the TTDI makes clear that resilience is what keeps that value intact when conditions change,” said Cara Morton, CEO Global Businesses and Operations, Zurich Insurance Group. “That kind of resilience requires business and governments to take responsibility together.”
Beyond Tourism Day: bringing the ecosystem together The Index will be launched at the World Economic Forum’s inaugural Beyond Tourism Day in Geneva, convening senior leaders from business, government and civil society under the theme “Resilient Growth. Renewed Impact”. Discussions will focus on strengthening competitiveness and resilience through workforce readiness, technology and innovation, investment and scalable solutions.
The Forum also announced today the first-ever cohort of Beyond Tourism Impact Stars, recognizing six private sector-led solutions addressing systemic challenges facing travel and tourism.
Beyond Tourism Day takes place two days ahead of World Tourism Day on 27 September, providing a platform to carry the conversation from Geneva to a broader global discussion on how travel and tourism can strengthen economic resilience, create quality jobs and opportunities, and deliver greater value to communities and destinations.
About the Travel & Tourism Development Index 2026 Drawing on nearly two decades of WEF benchmarking, the TTDI measures the factors and policies that enable the sustainable and resilient development of travel and tourism. It does not measure tourism performance directly – such as arrivals, spending, or revenue – but the underlying conditions that enable destinations to attract, support and sustain tourism in ways that benefit economies and societies. The 2026 edition covers 110 economies and is organized around 17 pillars and 102 indicators. It was produced in collaboration with Zurich Insurance Group and informed by the Beyond Tourism Insights Council.
A Silo Travel spotlight. The Art of Escape: Inside the Enduring Miami Beach Property Where Vintage Glamour Meets Contemporary Luxury
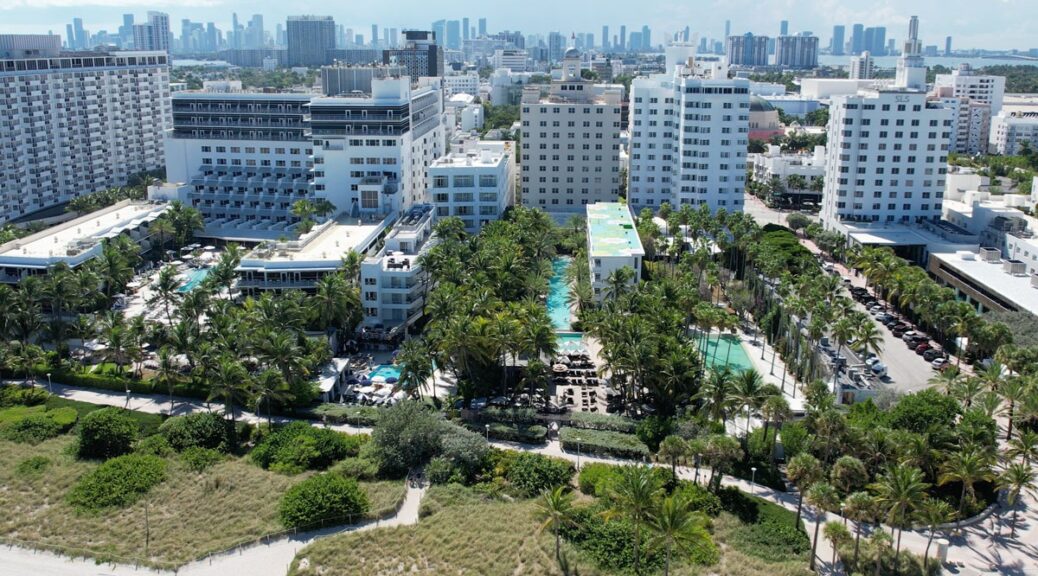
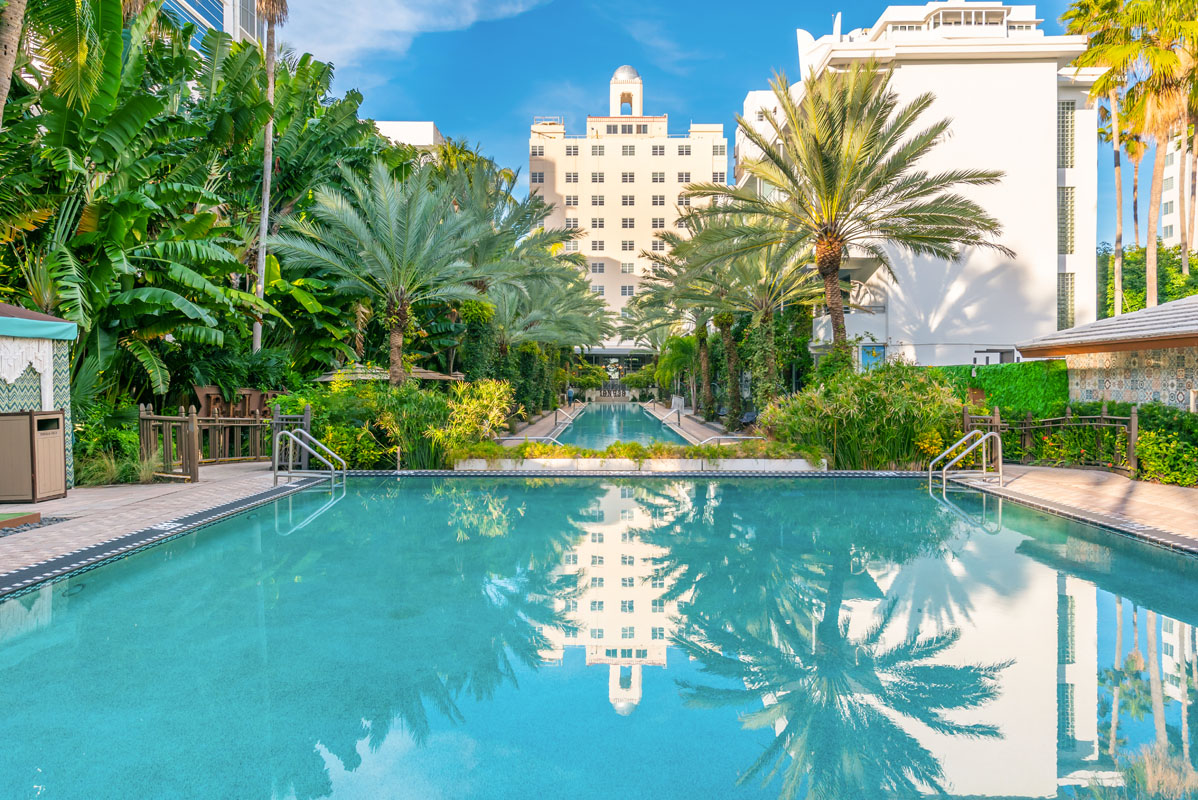
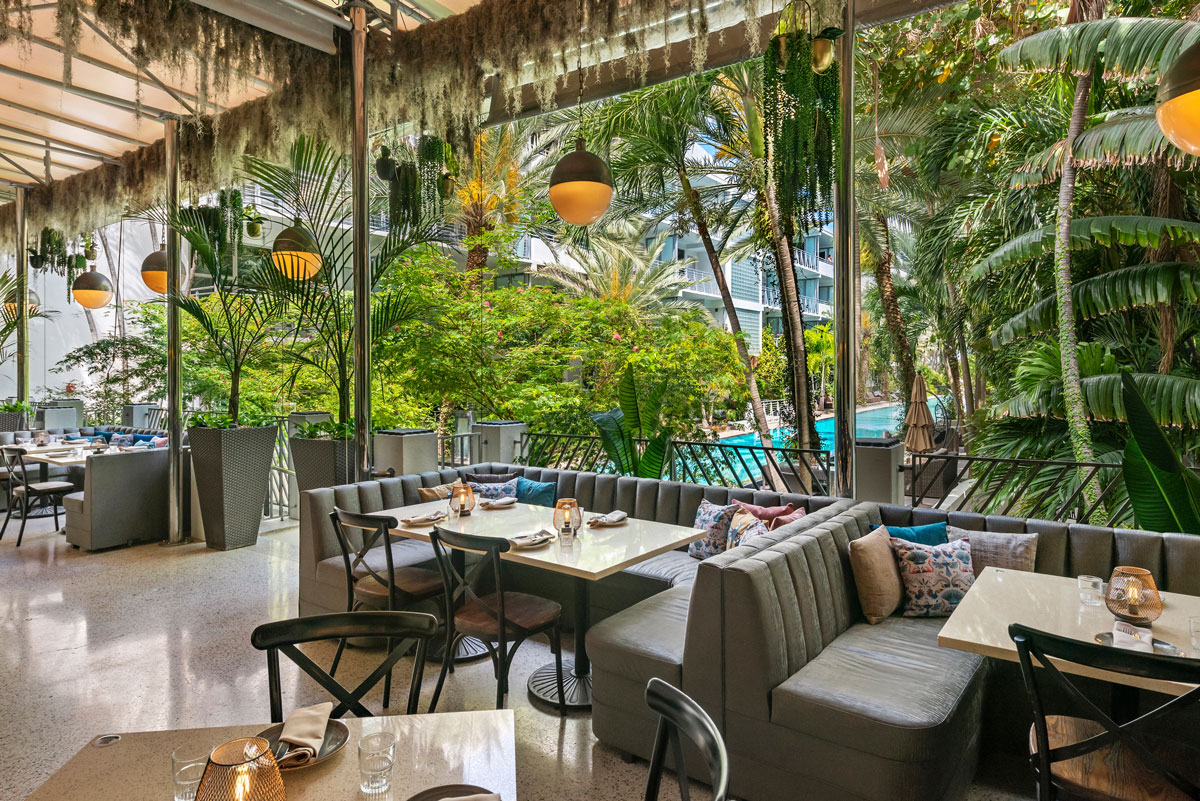
Those looking for a SoFlo escape exuding art, culture and timeless sophistication need look no further than the National Hotel Miami Beach, where the city’s vintage glamour meets contemporary coastal luxury. Perfectly situated in South Beach’s iconic Art Deco district, this adults-only, pet-friendly, oceanfront retreat offers a distinctly cinematic experience—from its sweeping palm-lined pathways to Miami Beach’s longest infinity-edge pool.
Whether unwinding in a newly redesigned ocean view suite or indulging in craft martinis and natural wines at the hotel’s Spanish tapas restaurant, Mareva1939, guests are immersed in a sensory celebration of both past and present. It’s the quintessential backdrop for a Miami Beach escape—and the perfect setting for a candid, deep-dive conversation with Stephane Mercier, Managing Director at The National Hotel Miami Beach, who shares insight into what makes the National Hotel such a standout destination.
MK: The National Hotel is known for its strong commitment to art. Can you describe the philosophy behind incorporating artwork into the guest experience—both in the copious common spaces and guestrooms and suites?
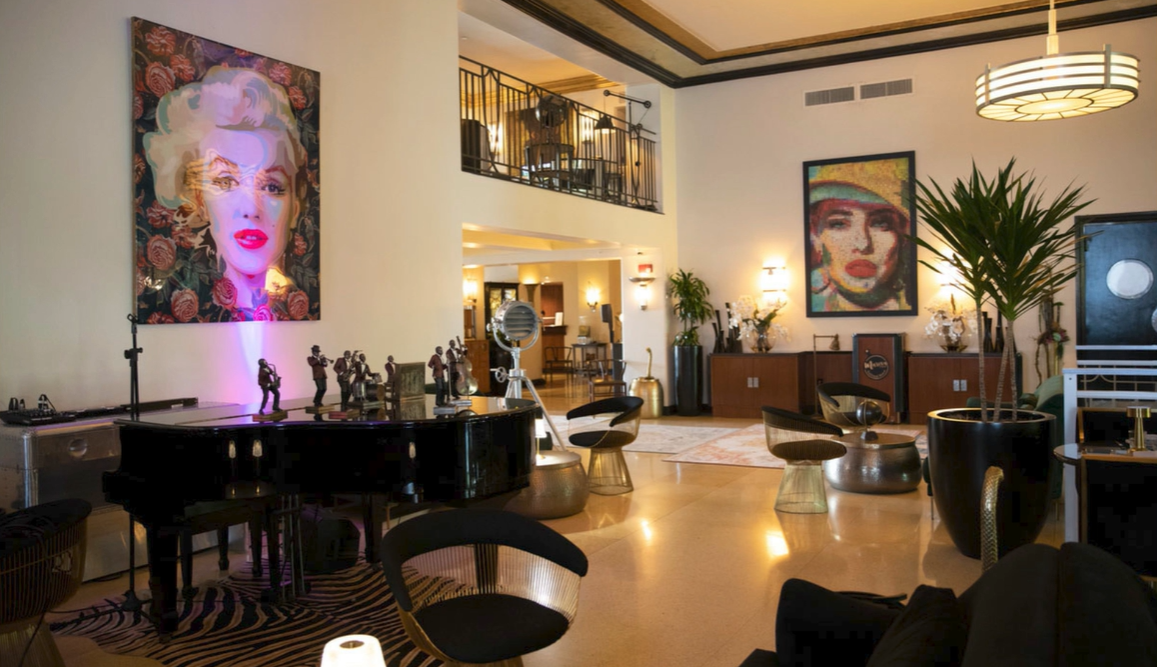
SM: The National’s philosophy behind incorporating artwork into the guest experience is deeply rooted in its iconic Miami Beach Art Deco hotel identity. We want guests to feel immersed in a unique, sophisticated revival of a golden age of Miami Beach, while enjoying contemporary hospitality. Designed by renowned architect Roy France, credited with creating the Miami Beach skyline with his string of Art Deco and streamlined towers, the hotel remains a testament to his visionary work.
Though renovated to offer the modern, yet sophisticated, classic look and feel experienced by guests today, the hotel continues to stay true to France’s philosophy and artful design. Signature architectural elements, including corner windows, original terrazzo floors, chrome wall sconces and era-inspired details, preserve the National Hotel’s timeless elegance, seamlessly blending classic style with contemporary luxury.
MK: What about the property gives it overarching appeal in the luxury travel sector?
SM: The National Hotel is one of the few South Beach properties that remains true to the iconic Art Deco era, preserving its timeless elegance and charm, and is the only beachfront, adults-only hotel in the destination, promising an elevated experience for a discerning set of travelers. Guests can be assured that the amenities and atmosphere onsite cater to adults that value culture, history and curated experiences. Since its opening in the 1940s, Bar 1939 has embodied the hotel’s rich history, capturing the glamour and sophistication of the period. This luxurious open space features suede lounge chairs, copper cobras emerging from side tables, flooring embedded with hundreds of shiny coins and a grand piano. Guests and locals alike can enjoy our vibrant cultural happenings onsite, including live music on Saturdays, seasonal highlights—including holiday celebrations and New Year’s—and musical collaborations like the Musimelange chamber music series, occurring now through May 19. Solidifying the vintage feel of the Art Deco era is the show-stopping bar, a monumental slab of ornately carved hardwood flanked by elaborate stools.
While design throughout the hotel pays homage to the property’s history, the exclusive Artist Collection Suite embodies the uniqueness found at the National Hotel Miami Beach. Designed by world-renowned artist Elizabeth Fatone, the accommodation features one-of-a-kind, hand-painted murals and Art Deco-inspired furnishings, celebrating the artistic spirit and distinctive character that define the unique experience at the hotel.
MK: How do the art pieces showcased at the hotel enhance the overall ambiance and storytelling of the property? SM: The hotel’s carefully curated pieces do more than enhance décor, they immerse guests in the timeless elegance of the Art Deco era. From the grand Bar 1939, with its carved hardwood bar and vintage-inspired furnishings, to the Artist Collection Suites featuring the aforementioned Elizabeth Fatone and Renoma Suite, every detail tells a story. Upon arrival, guests can find a sculpture by Carole Feuerman at the property’s entrance, colorful murals by the pool and revolving art present across the hotel throughout the year. Each artistic touch reinforces the hotel’s rich history, ensuring a seamless blend of past and present. MK: How does the property’s distinctive style, both in architecture and décor, influence the guest experience? SM: The National Hotel’s Art Deco architecture and décor offer a modernized tribute to the classic Miami Beach style. Miami Beach holds the appeal of having an artful combination of heritage and modernity. Art Deco hotels sprung forth from this intrigue and the National Hotel Miami Beach has solidified its place in the region’s history by achieving, and long maintaining, a sense of artful timelessness with modern appeal. On a year-round rotating basis, local and famed artist showcases or classics can be found in the hotel’s lobby, restaurants and additional common spaces. The hotel also works with local art and design communities to support and be included in Art Deco history tours. This seamless fusion of history, artistry and elegance not only enhances the ambiance, but also invites guests to become part of the hotel’s timeless legacy. MK: Are there any architectural elements or décor pieces that are original to the hotel? SM: The hotel has maintained its traditional foundation including corner windows, original terrazzo floors, chrome wall sconces and preserved the original check-in desk that is now on display for guests to enjoy during their stay. In front of the long pool, guests can see the mosaic Girl With The White Glove and the Compass, two pieces exclusive to the property. MK: The National Hotel has a fascinating and storied history. Can you share some of the most intriguing or lesser-known anecdotes about its past? SM: Since its inception, the hotel has drawn sun-loving socialites and celebrities, from the glamorous 1950s crowd, to the South Beach revivalists of the 1970s, to modern-day travelers looking for a boutique, sophisticated stay along the beach. Designed by Roy France, the National Hotel’s timeless Art Deco style and its striking 14-story tower are a testament to his influence in shaping the Miami Beach skyline. A Midwest native, France relocated to Miami Beach after a trip to Florida with his wife in 1931. The hotel remains true to France’s vision, maintaining its Art Deco charm while seamlessly integrating modern style and elevated amenities, services and culinary highlights. MK: Can you describe the unique features and amenities of the ocean-view and other premium-level suites at the National Hotel? SM: Ranging from the city vie rooms to our penthouse suite, guests can find roomy accommodations and relaxed luxe amenities with stunning views of the blue ocean and our infinity pool. Favorite features in our upper room categories include radios, slippers and a robe beginning in our cabana rooms and suites; balconies in our Cabana rooms; bold, fun murals in our Artist Collection Suites designed by Elizabeth Fatone; and the tri-level space of our Penthouse Suite.
MK: The property’s Mareva1939 on-site restaurant has become a standout feature of the National Hotel. What inspired its culinary concept and name? SM: Mareva1939, the National Hotel’s signature, award-winning Spanish tapas-style restaurant, was inspired by the year the hotel began welcoming guests. The restaurant’s culinary concept was designed to take guests through a gastronomic journey to Spain, offering a curated menu that blends traditional dishes with a modern, locally driven Miami Beach twist. The family-style menu encourages a convivial atmosphere, keeping the Spanish culture alive by inviting guests to connect around the table. To elevate the meal, the restaurant offers an extensive selection of organic, natural wines and handcrafted cocktails, thoughtfully paired to enhance the flavors of each dish. The creative culinary team ensures that dining remains exciting year-round with seasonal menus for holidays, local events and the hotel’s participation in Miami’s celebrated Miami Spice program. As an extension of Mareva1939, the Martini Bar takes guests back to the hotel’s opening era with original 1939 design elements, a specialty cocktail menu and live music over the weekends, offering an intimate and elevated space for unwinding. MK: How does the menu reflect—or complement—the hotel’s overall brand and history? SM: The culinary experience at Mareva1939 takes inspiration from the hotel’s artistic history in the plating and ingredients from the coastal setting, infusing Spanish traditions and tropical influences. MK: The property features bars reminiscent of a speakeasy that are a draw for guests and even city locals. To what do you attribute the appeal? SM: Their nostalgic charm and intimate ambiance, which transport guests and locals into this Art Deco era. The rich, vintage design elements paired with expertly crafted cocktails create a sophisticated setting that encourages relaxation and socialization. The hotel’s Bar 1939 and Martini Bar offer classic 1930s-era cocktails alongside modern drink options in a refined setting, with live music on Saturdays. The intimate nature of these bars, combined with their elevated atmosphere, makes them not just a place to enjoy a drink, but an immersive experience that draws both guests and locals looking for a unique, upscale night out. MK: What are some of the other standout amenities that set the National Hotel apart from other luxury properties in Miami Beach? SM: The National is adults-only, creating an intimate escape for couples, groups, friends and diners seeking a quieter, more sophisticated experience. The hotel is also pet-friendly and offers amenities for furry friends, so travelers can enjoy their Miami Beach getaway together with their pups. MK: The expansive pool is a defining feature of the hotel. Can you share more about its design and guest appeal? SM: The National Hotel’s expansive infinity pool is a standout feature that perfectly complements the hotel’s sophisticated, adults-only atmosphere. Stretching 205 feet, the longest infinity pool in the area offers guests a space to relax and take in breathtaking views, with a design that complements the hotel’s chic Art Deco style, creating a luxurious and serene environment to soak up the year-round sunny weather. Guests can unwind in the comfort of a poolside cabana or lounger, taking full advantage of the idyllic coastal setting. The Aqua Bar & Grill enhances the experience by offering delicious poolside bites and drinks, allowing guests to stay refreshed without leaving the water’s edge. Just steps away, guests can access a prime bit of Miami Beach shoreline. MK: How does the property balance its legacy as a historic landmark with vintage charm with the needs of modern travelers, and what technology helps facilitate the guest experience? SM: The hotel incorporates convenient technology solutions to deliver an elevated guest experience, such as providing QR codes on the beach to order food & beverages, Smart TVs in all the rooms, an elevated new fitness center and Apple Pay at all outlets. MK: As the National Hotel continues to evolve, what future plans or updates can guests look forward to? SM: The National continues to evolve and adapt its offerings while hosting anticipated annual events among some of Miami Beach’s most vibrant happenings, like South Beach Wine & Food Festival, Miami Swim Week and Art Basel. Guests can continue to spend these exciting occasions at The National, while looking forward to continuous and more experiential events and activations that speak to the history of the hotel and the story of The National. MK: How do you see the hotel’s role in the Miami Beach hospitality scene developing in the coming years? SM: As an original Art Deco hotel and mainstay of the city’s cultural landscape, The National will continue to embody the classic Miami Beach experience merged with an independent approach, adults-only atmosphere and arts-focused cultural calendar. Guests know to expect an intimate hospitality experience marked by authentic, historic features not found in newer developments. MK: Are there any famous guests or notable events in the hotel’s history that stand out as particularly memorable? SM: Mariah Carey performed at The National during the 2005 MTV Video Music Awards. Another legendary artist, Whitney Houston, filmed her ‘Heartbreak Hotel’ music video onsite. The hotel has also played host to international artists during Art Basel each year. As Mercier reminds us, the magic of the National Hotel Miami Beach lies in its ability to blend nostalgia and novelty, creating a stay that’s both storied and stylish. Whether it’s lounging by the shimmering infinity pool, savoring curated culinary experiences, or exploring the pulse of South Beach just steps away, every element is designed to transport guests to a timeless version of Miami. For travelers seeking both serenity and sophistication in the heart of the city’s most iconic neighborhood, the National remains an unforgettable destination—elegantly redefined.
Merilee Kern, MBA is an internationally-regarded brand strategist and analyst who reports on cultural shifts and trends as well as noteworthy industry change makers, movers, shakers and innovators across all categories, both B2C and B2B. This includes field experts and thought leaders, brands, products, services, destinations and events. As Founder, Executive Editor and Producer of “The Luxe List,” Merilee is a prolific business, lifestyle, travel, dining and leisure industry voice of authority and tastemaker. She keeps her finger on the pulse of the marketplace in search of new and innovative must-haves and exemplary experiences at all price points, from the affordable to the extreme. Her work reaches multi-millions worldwide via broadcast TV (her own shows and copious others on which she appears) as well as a myriad of print and online publications. Connect with her at www.TheLuxeList.com / Instagram www.Instagram.com/MerileeKern / Twitter www.Twitter.com/MerileeKern / Facebook www.Facebook.com/MerileeKernOfficial / LinkedIN www.LinkedIn.com/in/MerileeKern.
***Some or all of the accommodations(s), experience(s), item(s) and/or service(s) detailed above may have been provided or arranged at no cost to accommodate if this is review editorial, but all opinions expressed are entirely those of Merilee Kern and have not been influenced in any way.***
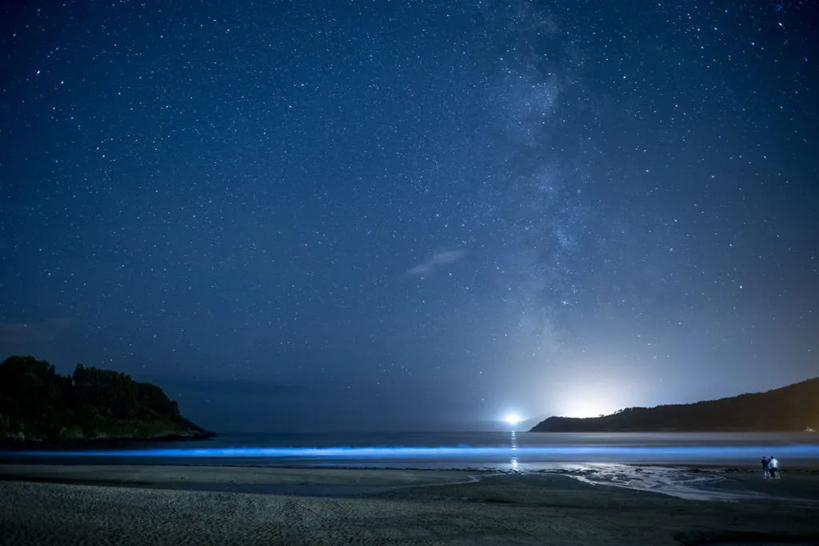
A great night for stargazing. The Milky Way over a bioluminescent sea at Estorde beach, Galicia, Spain. Photo by Brais Lorenzo/Anadolu Agency via Getty Images
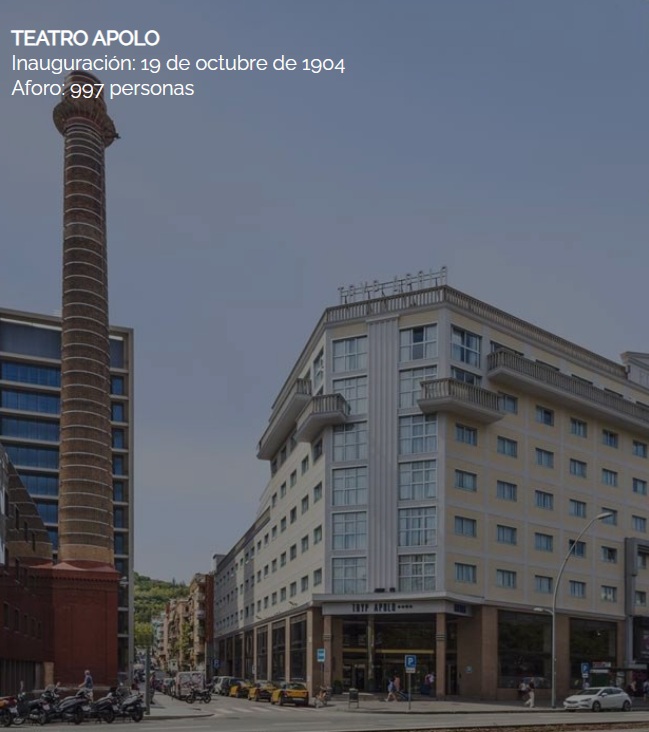
What a phenomenal week it’s been here in Almería Spain. If you’ve ever wanted to spend five nights surrounded by brilliant minds talking about the wonders of the universe—all for free—then the 13th Astronomy Days at Teatro Apolo was the place to be.
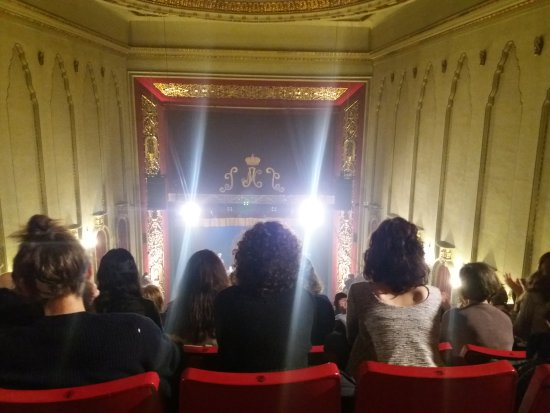
Every evening from Monday to Friday, I joined a packed house at the Teatro Apolo, right on Rambla Obispo Orbera, for one of the most engaging, inspiring, and surprisingly personal science events I’ve ever attended.
As someone with a love for astronomy (but definitely not a scientist), I wasn’t sure what to expect. Would it be too technical? Would the speakers feel out of reach? Turns out—not at all. The talks were not only fascinating, but the speakers themselves were so kind and approachable. I got to chat with all of them after their presentations, and almost everyone was fluent in both English and Spanish, which made the whole experience super welcoming.
Here’s a recap of this unforgettable journey through the stars:
Monday, May 12 – John Mather
The week kicked off in the best way imaginable—with John Mather, Nobel Prize winner and NASA legend. He talked about the James Webb Space Telescope (JWST), and let me tell you: hearing about its mission straight from someone who helped design it was something else.
He explained how JWST is literally letting us see the earliest galaxies, basically time-travelling with light, in a way that even I could follow—and I only passed physics with a B.
After the talk, I was lucky enough to have a quick chat with him. He was gracious, humble, and even cracked a joke about how working with ancient starlight makes you feel a little ancient yourself.
Tuesday, May 13 – John E. Beckman
Next up was John Beckman from the Institute of Astrophysics of the Canary Islands (IAC). Originally from the UK, he’s spent most of his career here in Spain, and you can tell he really loves sharing his knowledge.
His talk was all about galaxies—how they form, why they behave the way they do—and it was filled with this kind of poetic curiosity about the universe. He made the whole room feel like part of the story.
Institute of Astrophysics- The Canary Islands
He stuck around after the lecture, chatting with attendees like we were old friends. I asked him what keeps him inspired after decades of research, and he simply said, “The universe never runs out of surprises.”
Wednesday, May 14 – Martín Guerrero Roncel
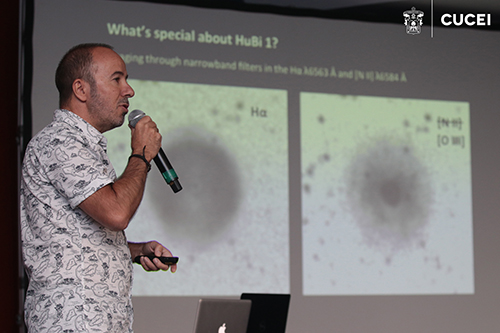
Wednesday’s speaker was Martín Guerrero Roncel from the Institute of Astrophysics of Andalusia (IAA), and his passion was contagious. He dove into the bizarre beauty of planetary nebulae—those colourful clouds of gas released by dying stars.
I had no idea how important these structures are in spreading elements across galaxies. His visuals were stunning, and his explanations were super clear, even when things got a little technical.
Afterwards, he was more than happy to answer everyone’s questions (and there were a lot), with patience and genuine enthusiasm. Super approachable and just a cool guy overall.
Thursday, May 15 – Sara García Alonso
Thursday brought us the incredible Sara García Alonso—astronaut candidate, molecular biologist, and all-around badass. She talked about her scientific work, the future of space missions, and what it’s like being one of the few selected to train as a European astronaut.
She brought this vibrant energy to the room, blending her love of biology and space exploration into a really inspiring talk. It was especially amazing to see so many young women and girls in the audience visibly lighting up as she spoke.
Friday, May 16 – Eva Villaver Sobrino
The week wrapped up with a bang with Eva Villaver Sobrino, the director of Space at the Spanish Space Agency. Her talk was both visionary and grounded—she spoke not just about scientific discoveries, but also about the future of Spain’s role in space exploration, the importance of collaboration across countries, and the ethical responsibilities we have as we reach further into the cosmos.
She’s been involved in some of the biggest European space missions, and her ability to combine scientific rigour with a big-picture vision of humanity’s place in the universe really struck a chord.
Questions afterward felt like chatting with a wise mentor. She encouraged everyone to keep asking questions and stay curious, no matter their background or age.
Final Thoughts
By the end of the week, I felt like my brain had been stretched in the best possible way. I learned about dying stars, distant galaxies, cutting-edge telescopes, and even the biology of space travel. But more than that, I walked away feeling deeply inspired.
What really made the event special was the human connection. Every speaker stayed around to talk, sign books, take photos, or just share a quiet word. No egos, no academic walls—just real people sharing their love for science.
Huge thanks to the organizers and to Teatro Apolo for making this all happen—and for making it free and open to everyone. Events like this remind us why curiosity matters and how lucky we are to have such brilliant minds willing to share their time and passion.
Already counting down to next year. Until then—keep looking up! For the Silo, Sandia Martin.
Supplemental-ESA Astronauts Train on Spanish Island for future Space Missions
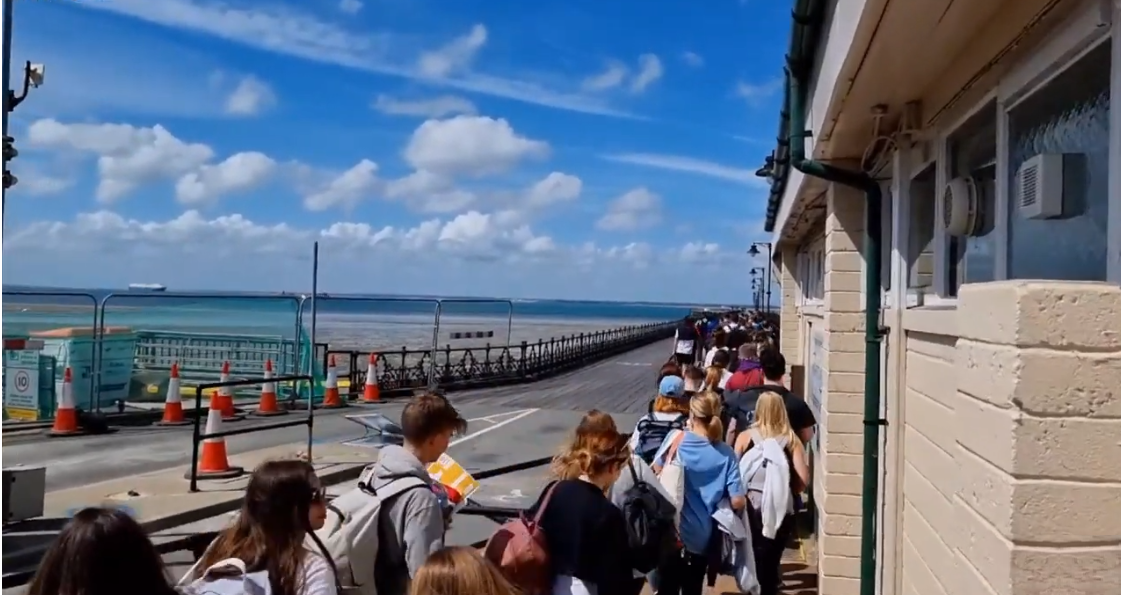
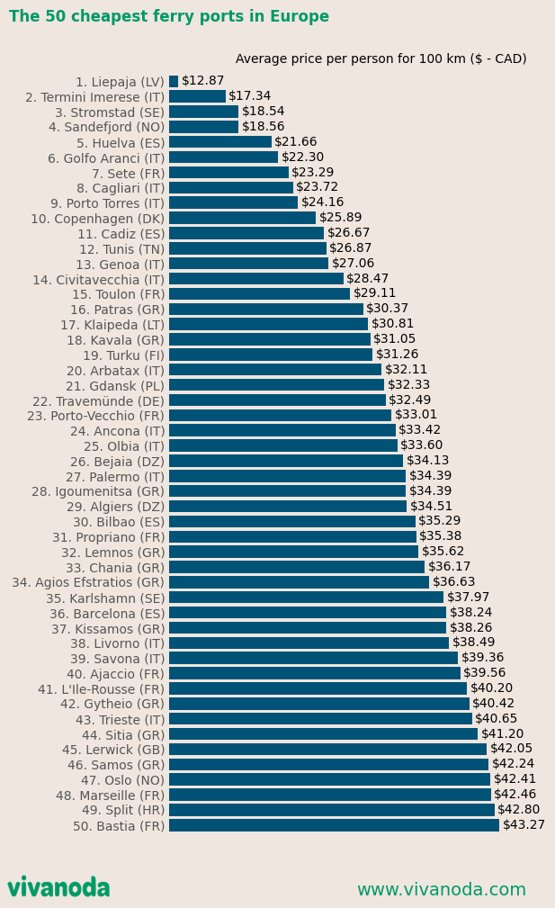
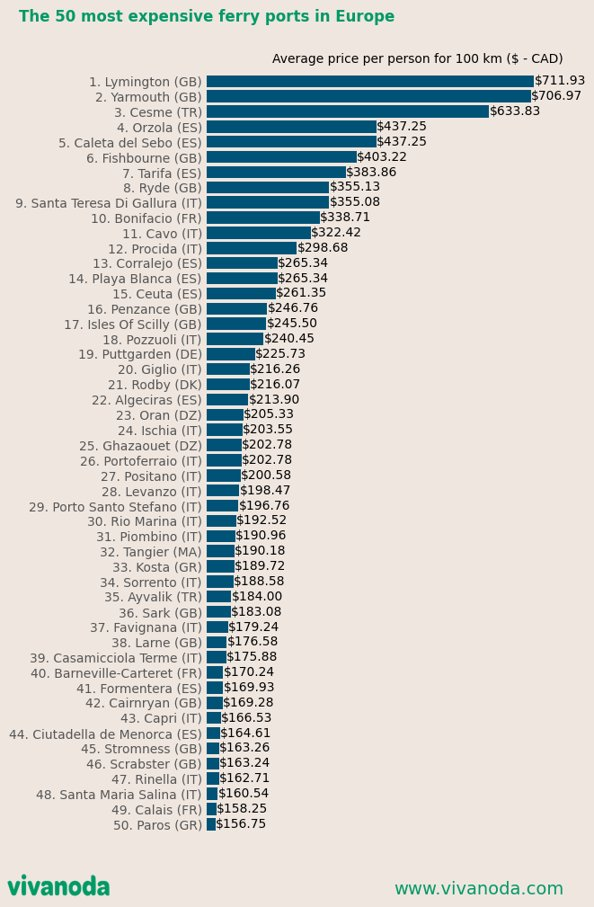
Far from the stress of crowded airports or stations, ferries allow you to travel in comfort while taking your time.
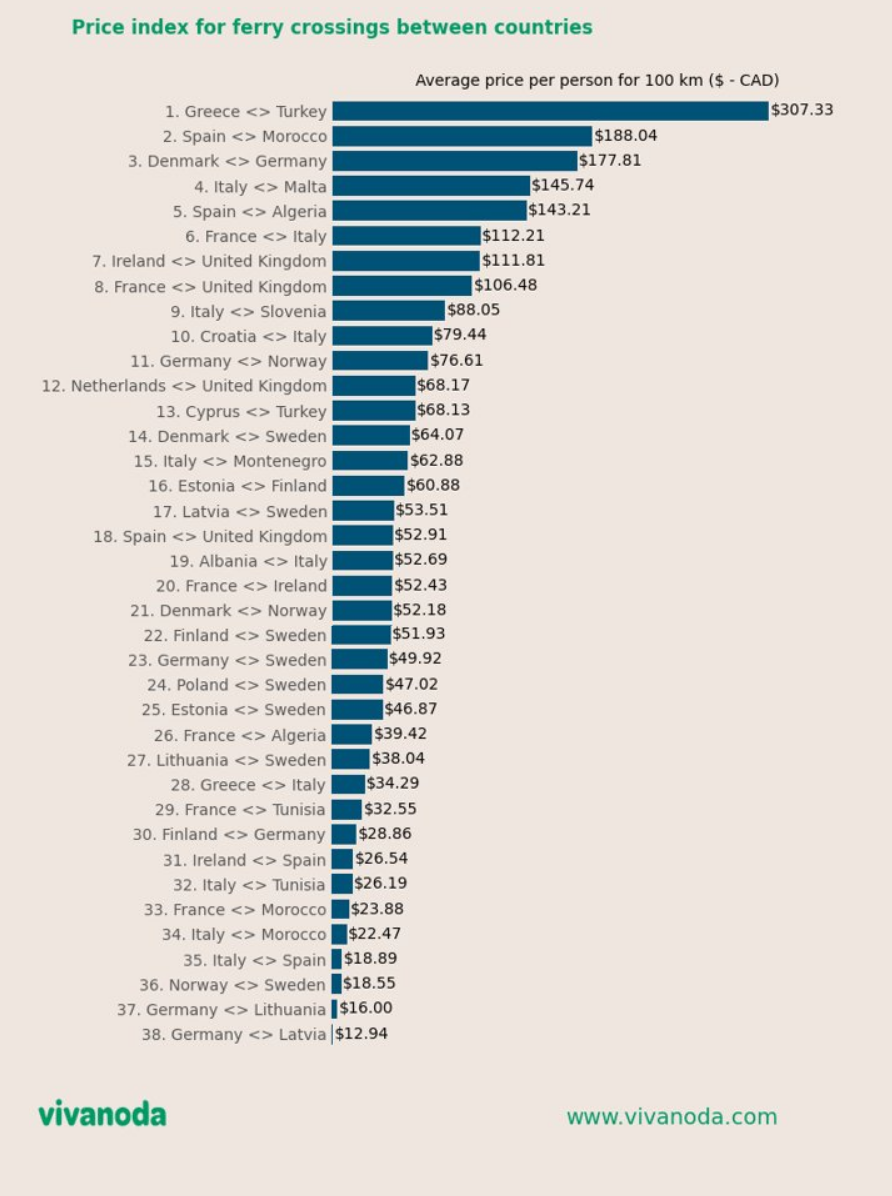
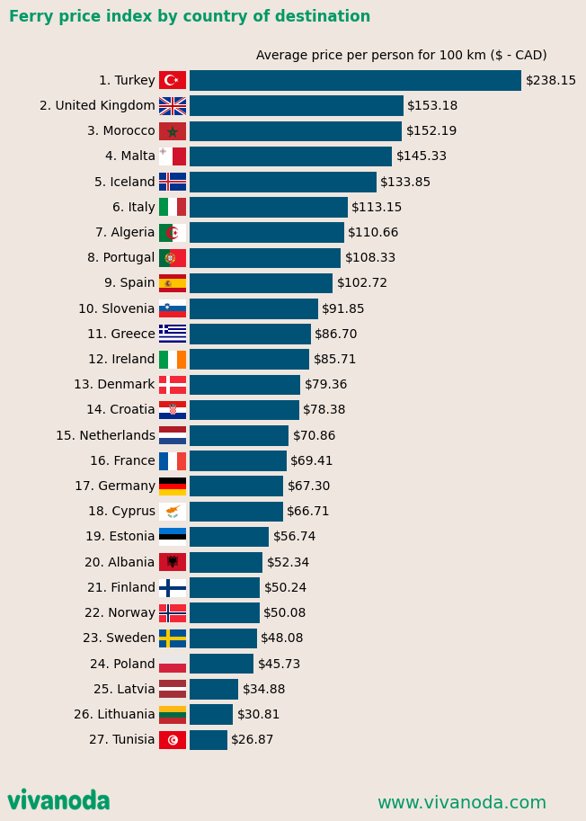
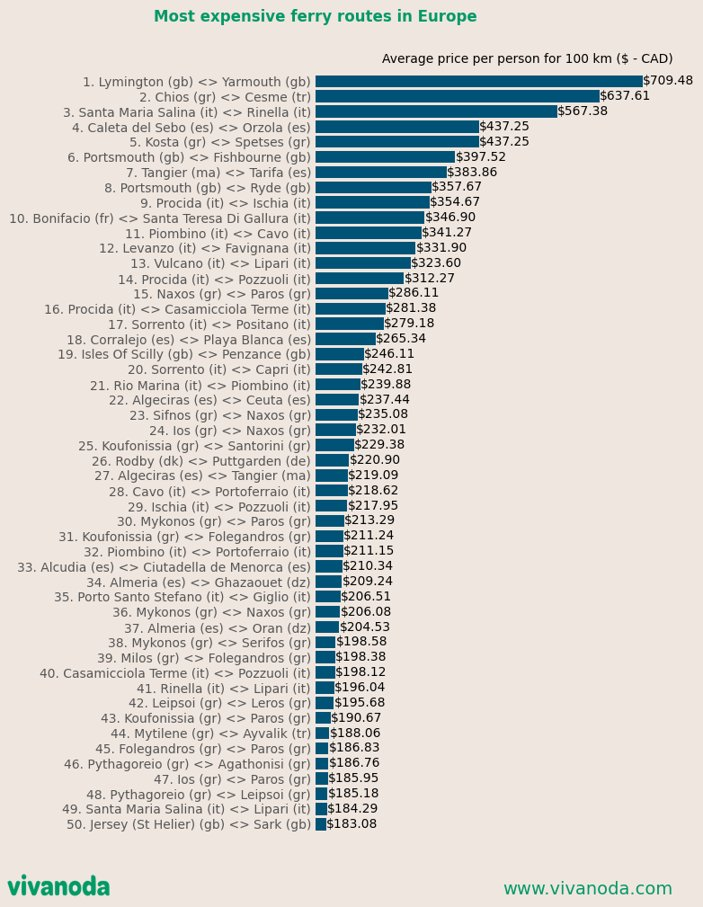
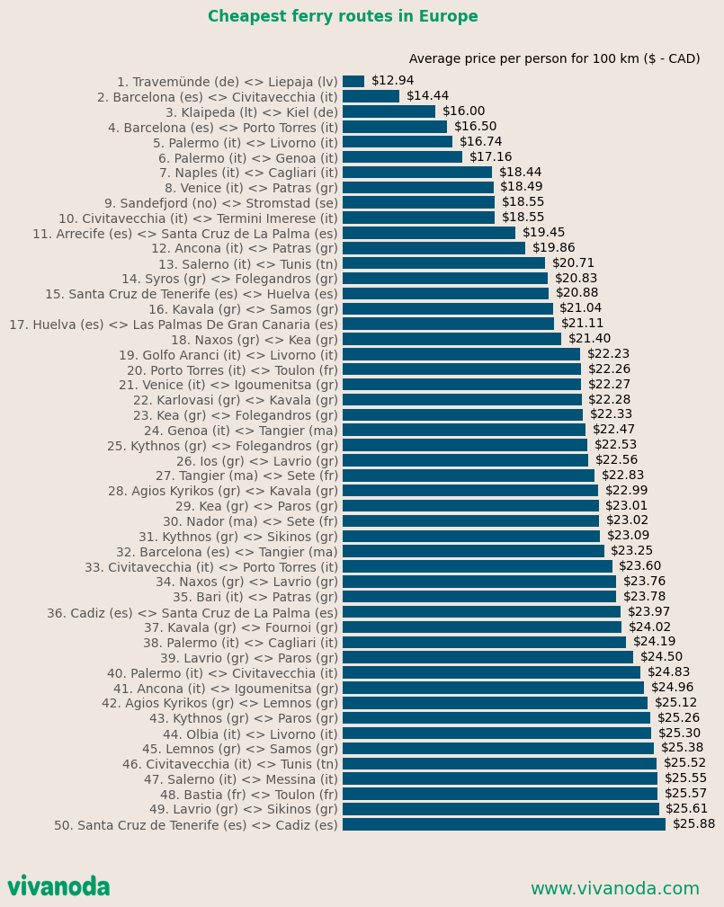
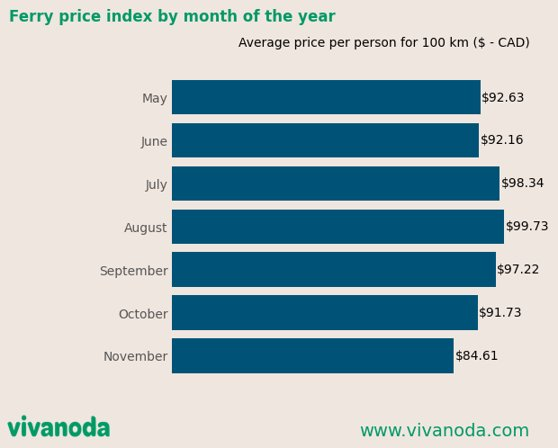
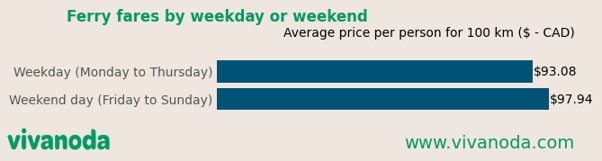
Our friends at Vivanoda, a web platform that enables all travelers to find ferry, bus, train and plane tickets, wanted to launch a major study into ferry prices in Europe in order to gain a better understanding of the variations in ferry ticket prices according to a number of criteria (destination country, distance, seasonality, etc.).
Fortunately for those of us interested in a Europe trip that includes ferrying, they have analyzed tens of thousands of ferry fares on hundreds of routes in Europe, as well as crossings to Turkey and the Maghreb countries (Morocco, Algeria, Tunisia), to get as exhaustive a picture as possible. If you enjoy comparing prices using graphs you are going to want to keep reading…
It’s not difficult to understand the appeal of Ferry travel- leisurely comfortable rides with great views.
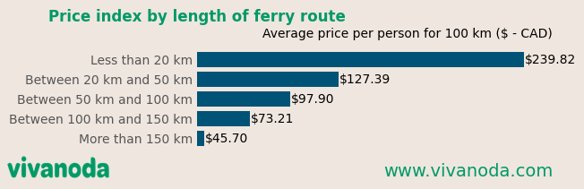
Here are the key points highlighted by this study at European level:
Ferry crossings to Tunisia, Lithuania, Latvia, Poland and Sweden have the lowest price index.
Conversely, ferry crossings to Turkey, the UK and Morocco have the highest price indexes.
Connections between Greece and Turkey and those between Morocco and Spain are proportionally the most expensive in Europe.
Connections between Germany and Lithuania or Latvia are the least expensive in relation to the distance travelled.
The shorter the crossing, the more expensive it is.
Across Europe, prices are higher on average from July to September. They are also slightly higher at weekends.
For The Silo, Nicolas Pellier.
About Vivanoda Vivanoda is a web platform that makes it easy to find ferry, train, bus and plane tickets for travel in Europe. Launched in 2013, the site has received awards from the European Commission, the International Union of Railways and the Groupama insurance group.
With the retirement of Francesco Totti five years ago, fans had been wondering if his team, Roma, would retire his famous number 10 shirt. In the end, they did not.
That got us thinking, what are the most famous shirt retirements in Soccer – Football history? Let’s take a look.
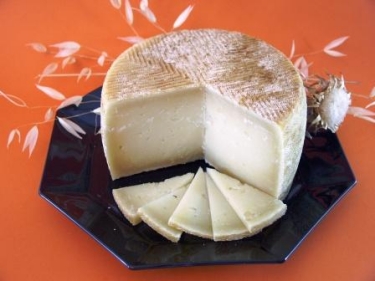
One of my newest cheese loves is not a new cheese at all, but, actually, the traditional cheese of Spain. Manchego is a smaller wheel of Spanish sheep’s milk cheese that just makes the mouth water. It is regulated by Spain under the PDO (Protected Designation of Origin), which was granted through the European Union. (in a nutshell, PDO allows for exclusive food/geographical production so for example, in Europe, Parma Ham can only be sold and labelled as Parma Ham if it originated in Parma see link below for more CP ) This means that it must meet specific regulations in order to be called Manchego. It must be made from whole sheep’s milk taken from animals that have grazed in autumn in La Mancha province. Finished cheese must be aged from 60 days to 2 years. The milk must contain at least 6% fat and each stone, or wheel, of cheese must weigh between 2 and 3.5 kg.
There is a distinctive pattern engraved in the inedible brown rind of the cheese.
Originally, the Manchego curd was hand pressed in plaited esparto grass baskets. The grass was taken from the same fields where the sheep grazed, and the grass-flowers pressed into the top. Today, however, press moulds are formed using the traditional pattern and the grass baskets have been phased out of production. Still, the traditional zigzag is how you can recognize Manchego at your favourite cheese shop—and always look for the PDO label.
The inside of the cheese, or the paste, is an off-white that hints at golden. As the cheese gets closer to the rind, the colour progresses to more of an umber. Very small pockets of air are produced as the cheese ages and releases co2.
But enough of all this—the important part of Manchego is the taste. It has a wonderful, mellow flavour that is rich and subtle at the same time. There are slight hints of smoke, woody nuts, tobacco, honey and leather, and it finishes with the distinctive taste that only sheep’s milk can give you. Manchego can be served with olives, sundried tomatoes or hearty crusty bread. It pairs easily with a fine Rioja red wine or a fruity sherry—a wonderful way to stay warm on a winter’s evening.
Recently I heard that Manchego, cut in smaller chunks and dipped in honey poured on a plate, makes a fine conclusion to full meal. I tried this desert idea and the flavours of honey and cheese together are just wonderful. The smoky taste that coats the taste buds is a joy.
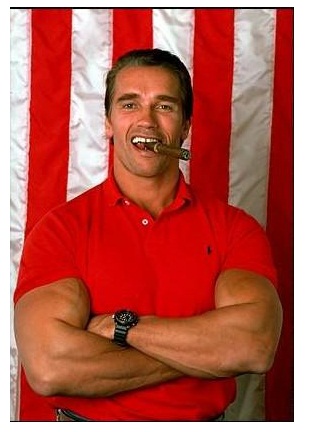
For the more daring, this traditional dessert of Spanish Manchego and honey also pairs well with a fine Cuban cigar. Enjoy your cheese.
Waaay back in 2007 the “Govinator” raised a few eyebrows at Ottawa’s Westin Hotel. After taking in a Sen’s hockey game, Arnold made an unscheduled stop for a 16$ Partagas Cuban
Many non-native plants can happily survive in other regions of the world, which has given gardeners more choice than ever before. However, native flowers and plants can summarize the landscape of a nation, while communicating the identity of a country.
For many countries the national flower is second only to the national flag as the most important national symbol, while communicating the identity of a country.
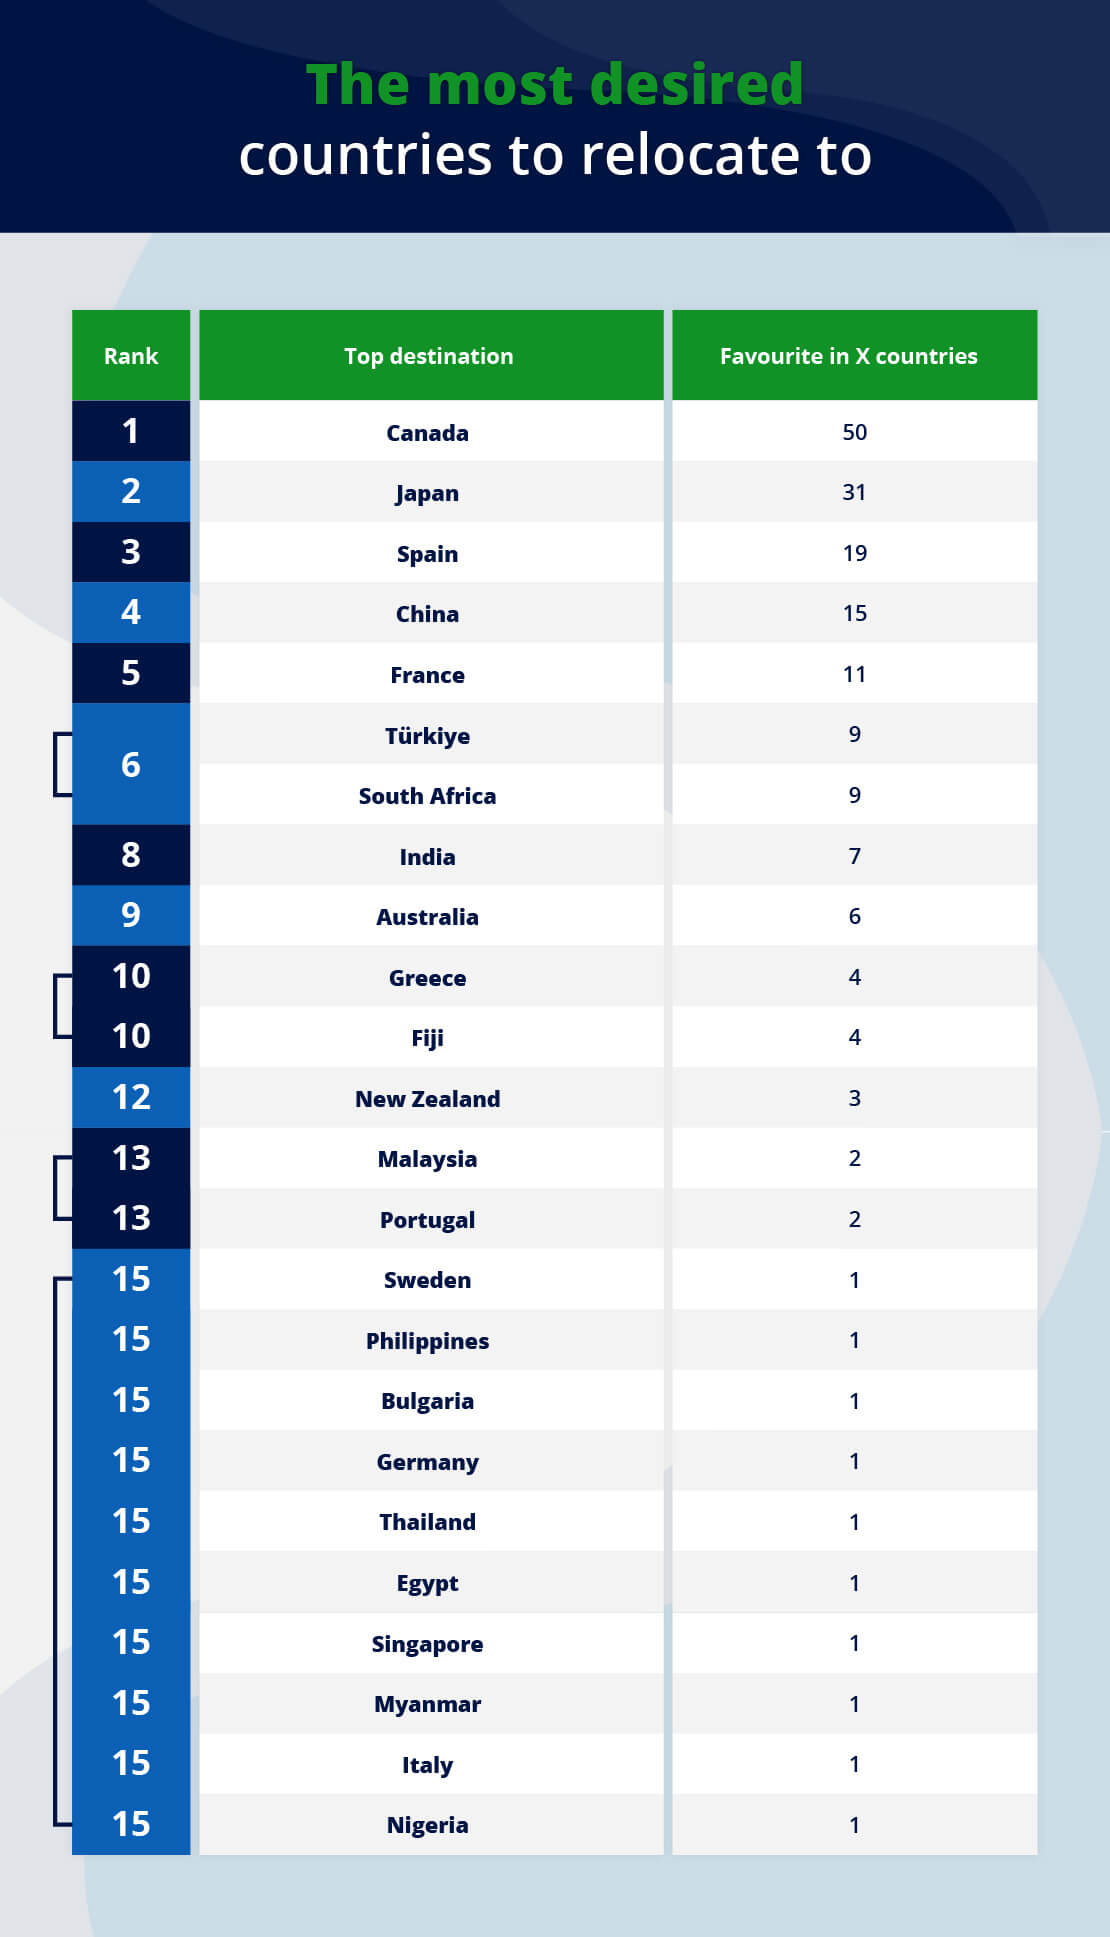
A study by Compare the Market Australia has analyzed each country around the world on their annual search volume for terms such as ‘relocating to [country]’ and ‘moving to [country]’ to reveal the world’s most desirable countries to relocate to.
The most desired countries to relocate to? Here comes a boring chart!
Rank
Top destination
Favourite in X countries
1
Canada
50
2
Japan
31
3
Spain
19
4
China
15
5
France
11
6
Turkey
9
6
South Africa
9
8
India
7
9
Australia
6
10
Greece
4
10
Fiji
4
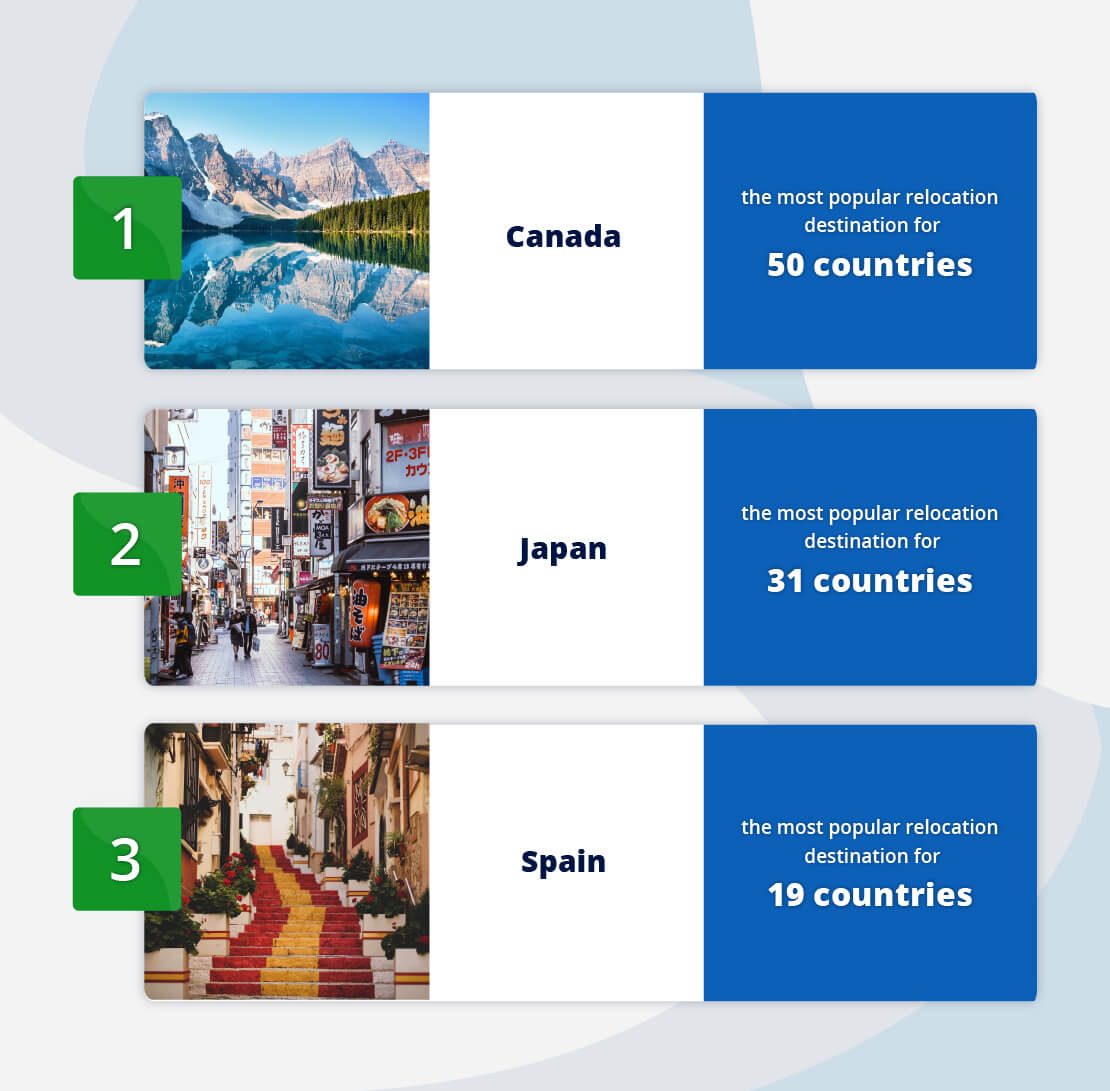
Taking the top spot is Canada, with our North American nation being the most desired destination in 50 other countries around the world. Canada is a very welcoming country for expats, which has led to it becoming a very diverse and multicultural destination.
Second place goes to Japan, with 31 countries having it as their number one relocation destination, including Australia. Japan has one of the highest life expectancies in the world, which could explain why so many people are researching to move there.
Spain is another very popular choice, especially amongst those in other European countries, with 19 countries having it as their favourite in total. Known for its warm Mediterranean climate, Spain is also another destination that has excellent healthcare and quality of life.
The least desired countries to relocate to in the world include: Sweden, The Philippines, Bulgaria, Germany, Thailand, Egypt, Singapore, Myanmar, Italy, and Nigeria with only one other country wanting to move to each of these destinations.
Further Study Insights:
Each country’s most desired relocation destination
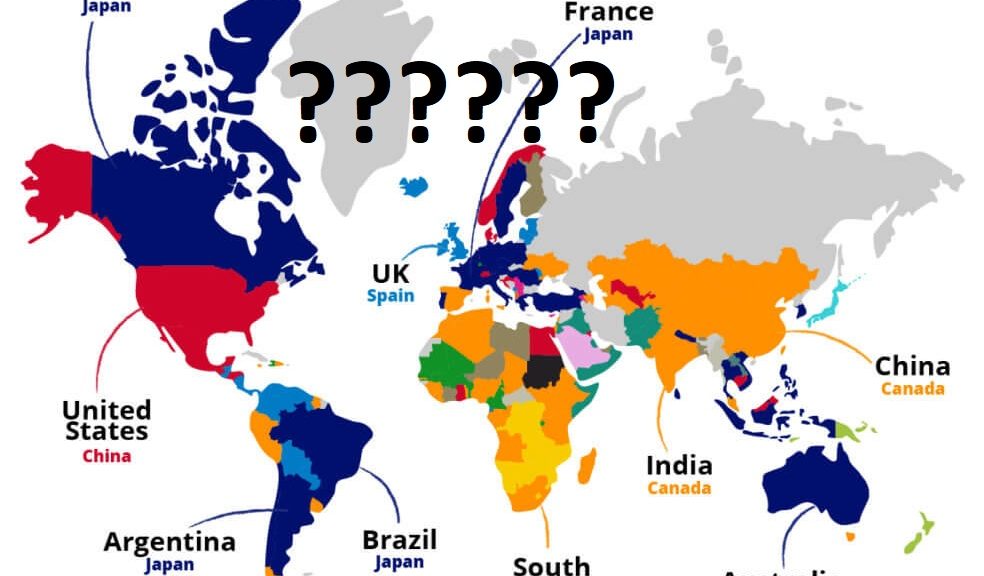
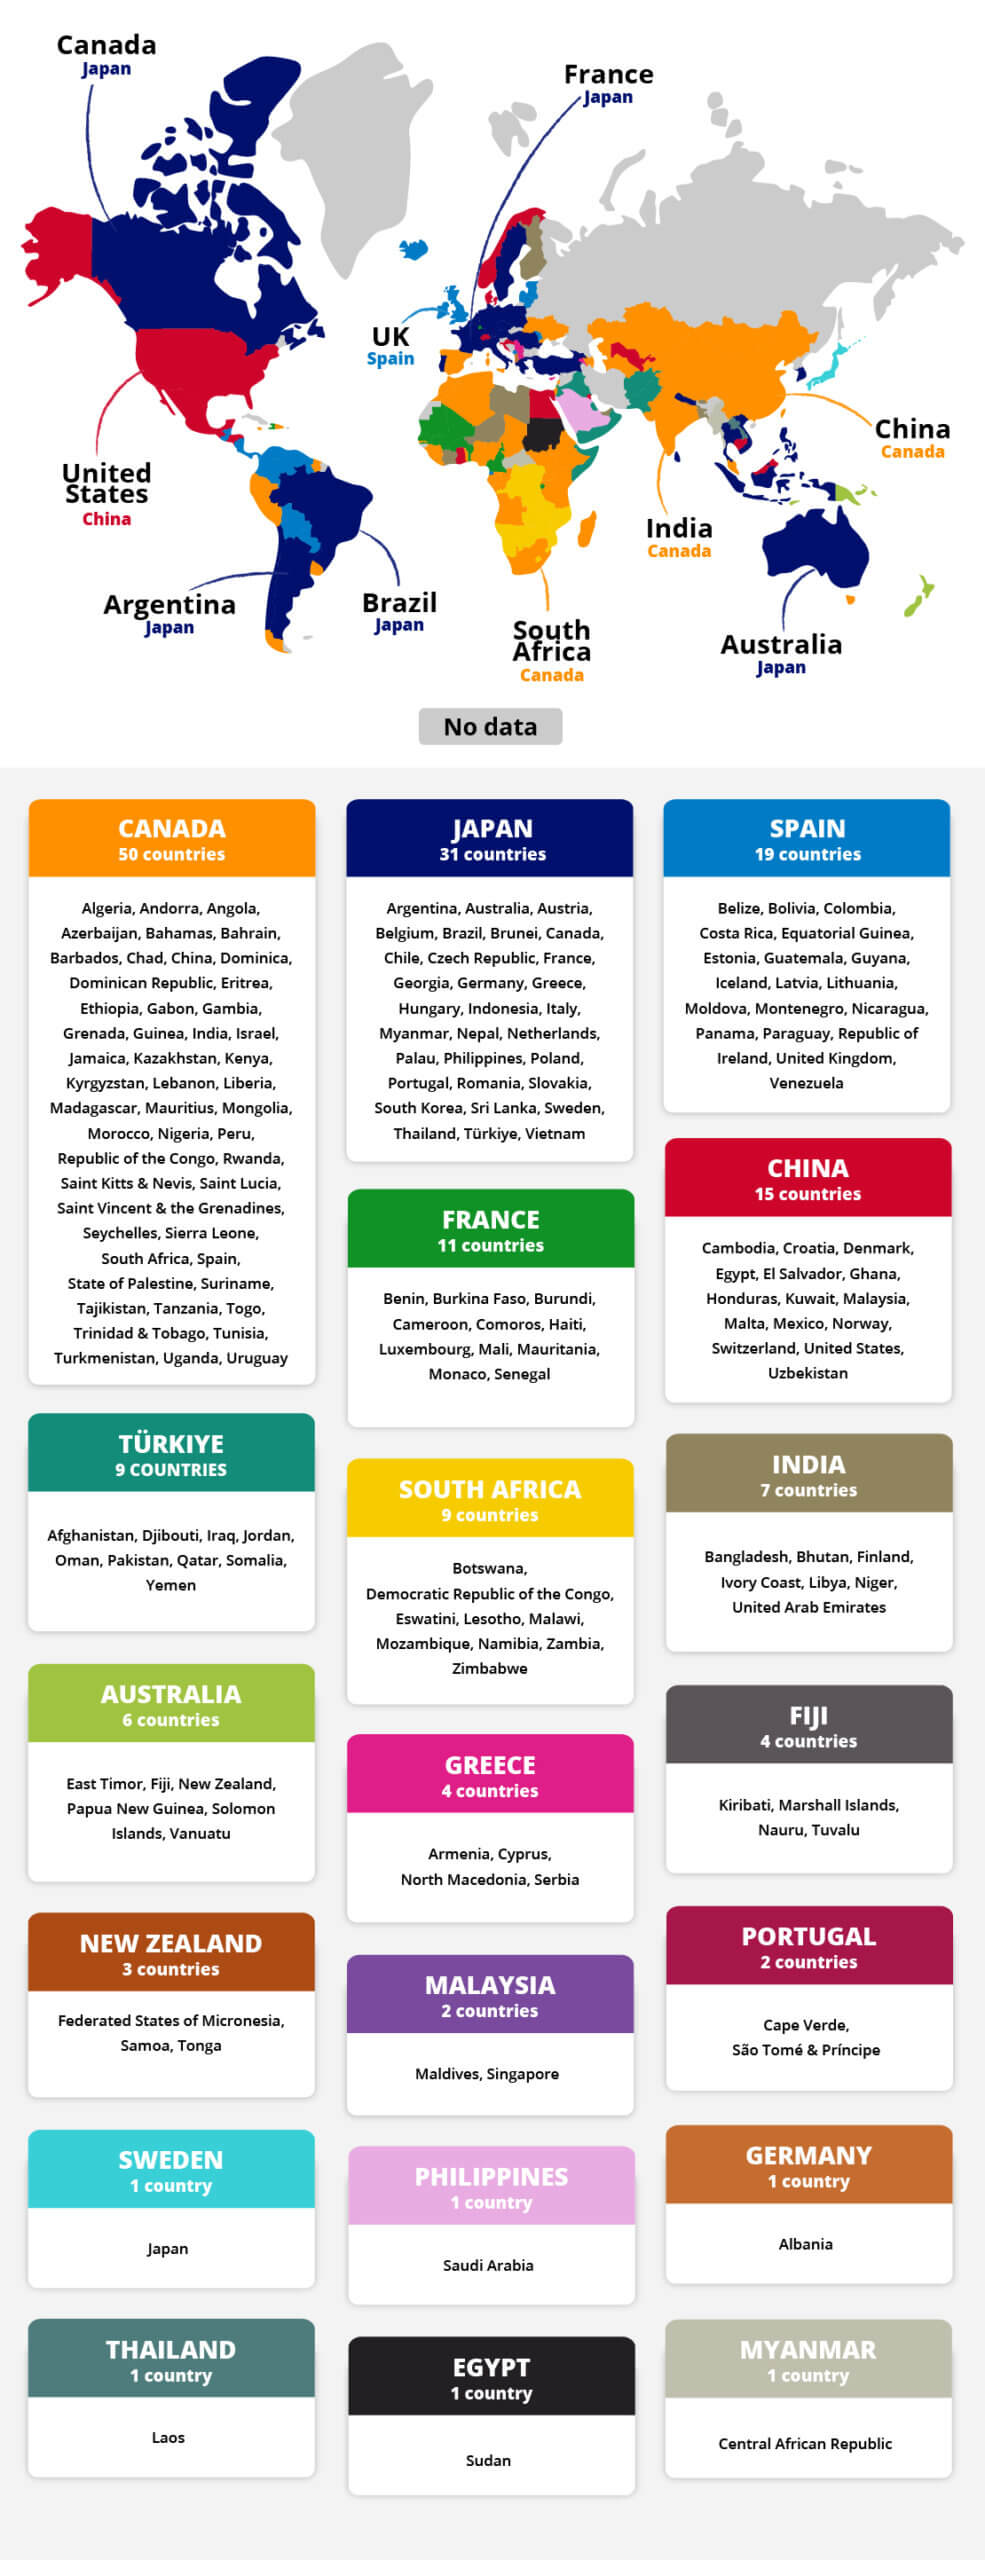
Check the map below to see where each country in the world wants to relocate to the most.
While the majority seem to prefer somewhere within the same continent, there are some notable exceptions to this.
As the most searched country overall, we can see that people from as far away as India and South Africa have Canada as their most searched destination.
However, there were also some definite regional trends though. For example, many African nations have South Africa as their most searched destination.
Methodology
Using Google Ads Keyword Planner, the annual search volume for each of the following terms was found for each country in the world:
Houses in [country]
[Country] property
Moving to [country]
Relocating to [country]
This process was then repeated for each country in the world, taking a total of the searches across all four search terms, to reveal where each country wants to relocate to the most.
Note that searches within the same country were removed from the results.
In addition, all searches were carried out in English, as results in native languages proved to give inconsistent results.
“Art is a lie that makes us realize the truth” –Pablo Picasso
Pablo Picasso (Spanish, 1881-1973) was one of the most well-known artists of the 20th century. Throughout his long and prolific career, Picasso both innovated and participated in important artistic movements such as realism, cubism and surrealism. In comparison to Vincent van Gogh, the infamous starving artist, Picasso was one of the first modern artists to achieve great wealth and celebrity in his lifetime.
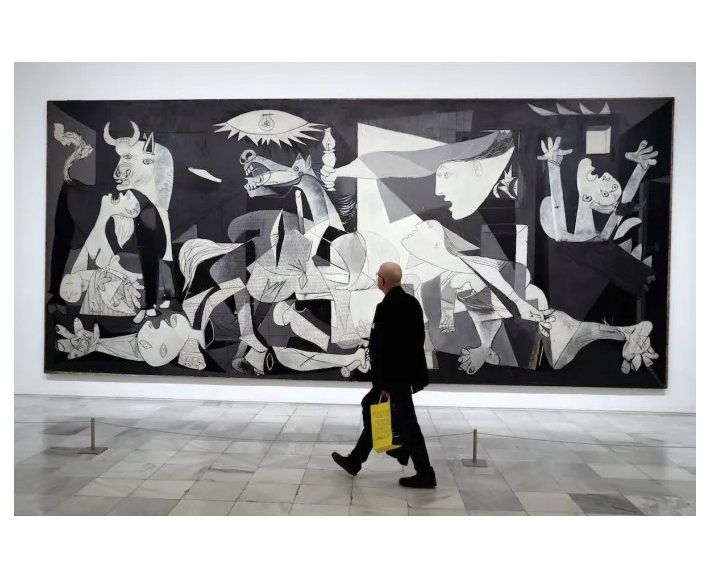
Possibly the most important work that Picasso produced was Guernica (1937).
This large scale black and white mural (approximately 12 x 26 feet), was commissioned for the Spanish Pavilion in the 1937 World’s Fair in Paris and was completed by Picasso in under a month. In it, the artist depicted a catastrophic incident from the Spanish Civil War, wherein the Nazis conducted carpet bombing experiments on the town of Guernica, in the Basque region of Spain.
Historically, Spain had been ruled by a monarchy up until the 1930s, at which time it was replaced by a republican government that promised social and economic reform and a redistribution of goods and land. Spanish conservatives disliked this idea and headed by General Francisco Franco, they launched an insurrection that led to the Spanish Civil War. Aided by the Fascists and Nazis, General Franco assumed dictatorship of the country and ruled until his death in 1975.
During this time of turmoil, Picasso was not in Spain but working in Paris.
This is important to note when considering his choice of palette. He would have been paying attention to the events taking place in his native country largely through newspapers, transforming the black and white newsreel into a large scale canvas. Also, by choosing a dichromatic colour scheme, Picasso allowed the subject matter to stand out over colour.
Prominently positioned in this work is the Minotaur (a half-bull/half-man monster), an important symbol for Spanish people representing the tyranny of General Franco and his Nazi and Fascist supporters. Picasso used distortion in the imagery and figures to portray the horrors and suffering of innocent civilians massacred by the carpet bombing. This, in combination with the palette, evokes in the viewer the sensation of a stark nightmare, tying the work to the surrealist movement.
On a final note, Picasso was adamant that this work not be displayed in Spain until democracy was restored.
On loan to the Museum of Modern Art in New York, Guernica was returned to Spain in 1981. For the Silo, Eve Yantha.
Who is Sir Norman Foster? A British born architect world renowned for his ground-breaking interpretations of neo futuristic and post-modern design, that’s who.
Perhaps most famously known for designing and constructing “The Gherkin” tower in London, England at a cost of 138 million pounds. This office building is sure to turn the heads of tourists and Londoners alike.
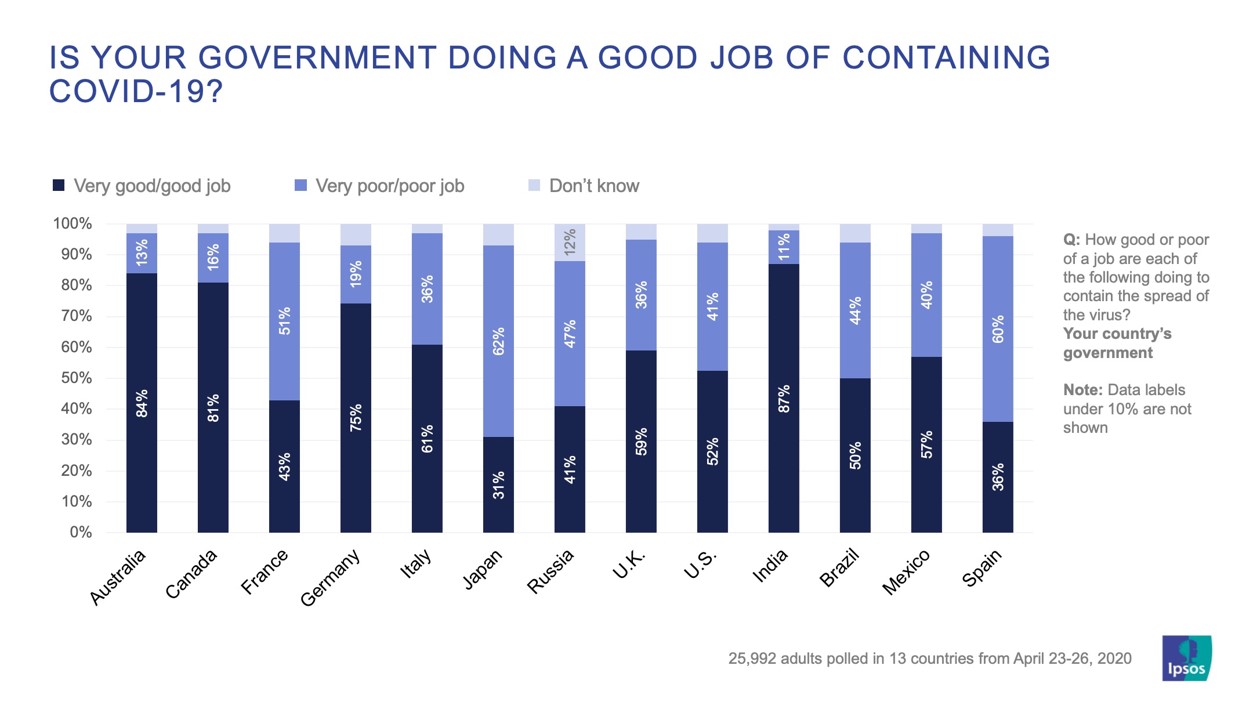
Paris, France May, 2020 — Sentiment over whether governments are doing a good job of containing the coronavirus pandemic has swung in a number of countries over a month, according to the latest Ipsos poll.
A majority of people in nine out of 13 countries feel their government is doing a good job of containing the spread of COVID-19 in a survey of nearly 26,000 respondents conducted on April 23 to 26. People in India (87%), Australia (84%), Canada (81%), Germany (75%) and Italy (61%) are most likely to say this, while those in Japan (62%) and the hard-hit European countries of Spain (60%) and France (51%), and Russia (47%) were most likely to cite a poor job by their government.
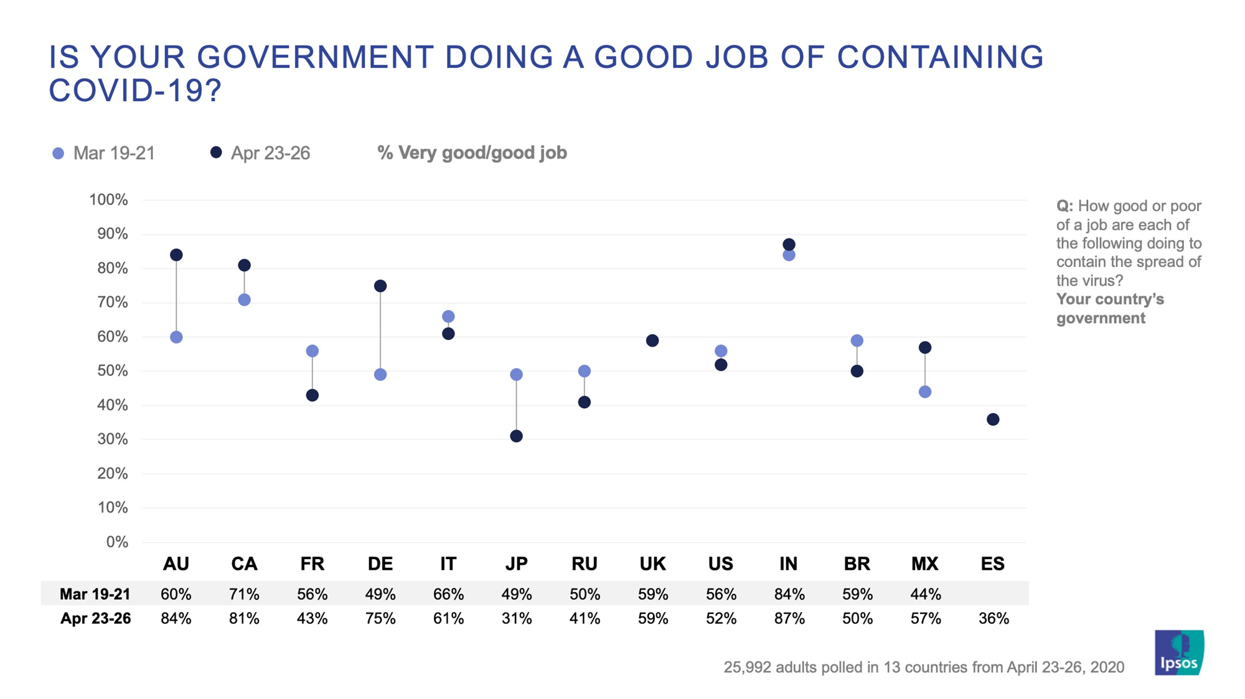
But when you look back to polling results from more than a month ago – March 19 to 21 – sentiment has fallen the most in some key countries at the center of the outbreaks. Japan is at the top with their view of government response down 18 percentage points, followed by France (-13), Brazil and Russia (-9), Italy (-5), and the United States (-4).
On the other end, a positive view of the government’s work has increased in Germany (+26 points), Australia (+24 points), Mexico (+13), and Canada (+10) since March. Sentiment in the United Kingdom has remained unchanged with three in five people (59%) happy with the government response.
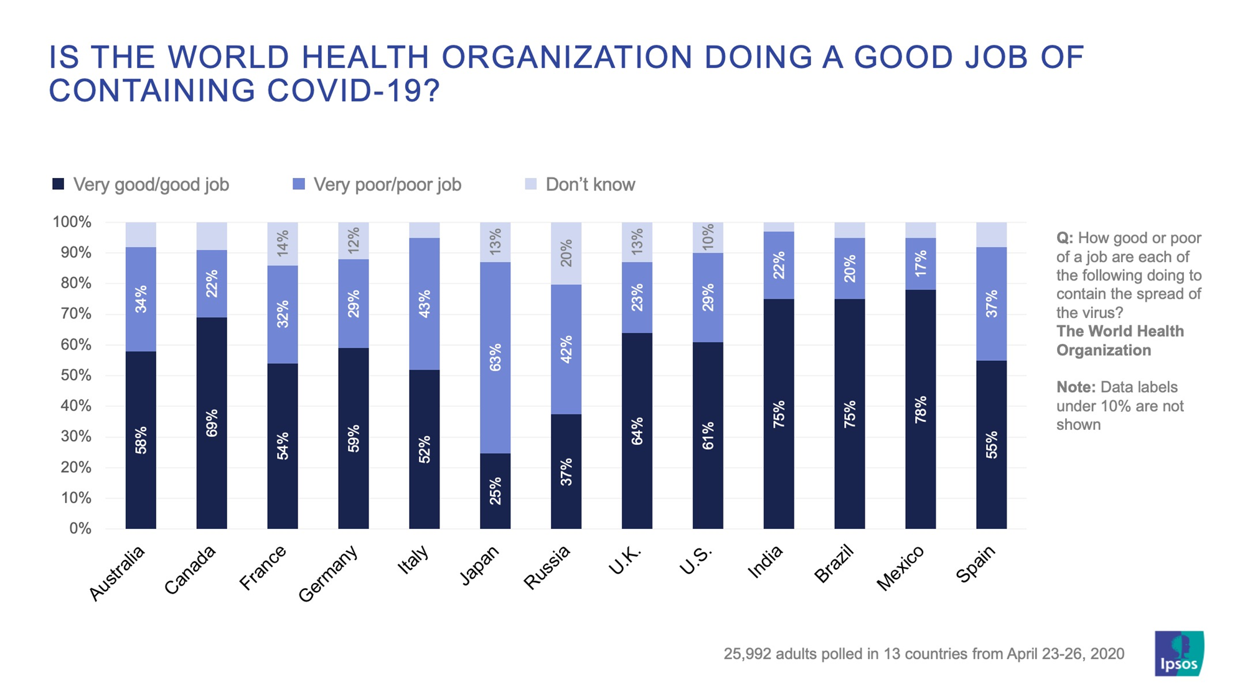
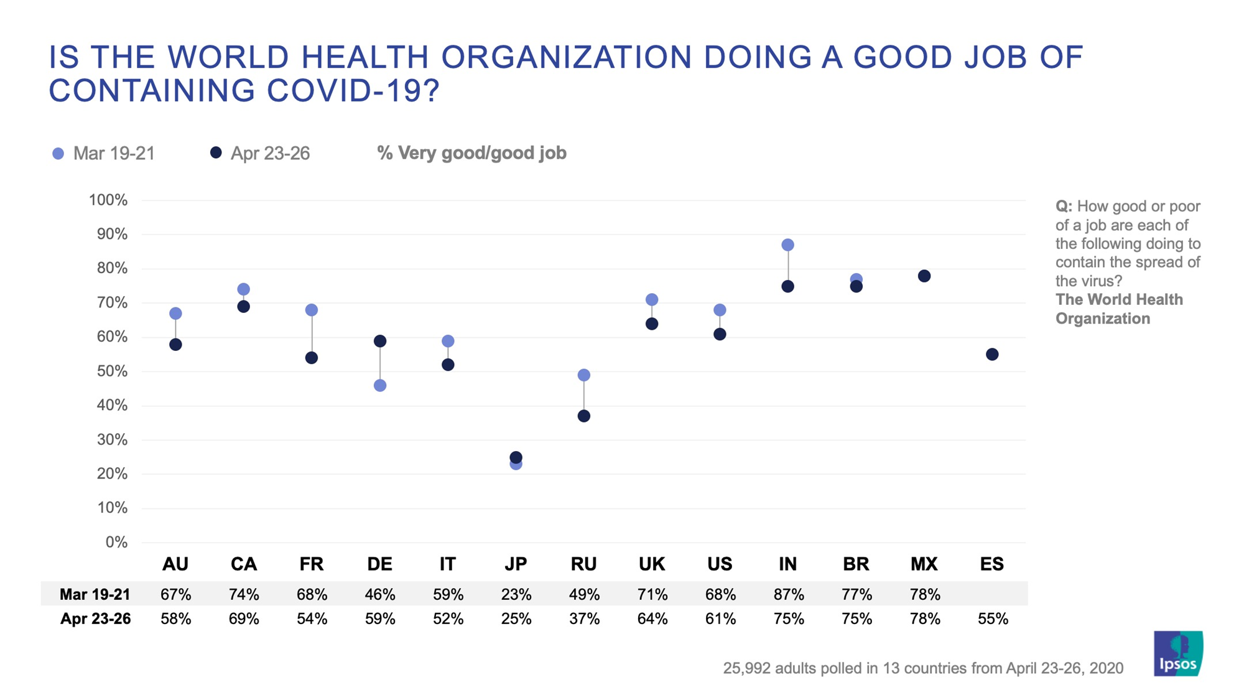
In terms of how people view the work of an international agency – the World Health Organization – a majority of people in 11 out of the 13 countries surveyed think the WHO is doing a good job in containing the spread of COVID-19, but this sentiment has fallen since March in nine out of 12 countries where Ipsos has tracked opinions.
People in the emerging markets of Mexico (78%), India and Brazil (75%) are most likely to be satisfied with the WHO’s response, followed by the developed nations of Canada (69%) and the U.K. (64%). The only two countries where more people disagree with the job done by the WHO are Japan (63%) and Russia (42%).
Other Ipsos research shows when respondents are asked about the performance of institutions in preventing the spread of the virus other aspects of the issue, including the economic effects of shutdowns, also influence how they evaluate institutional performance relative to containing the spread of COVID-19.
The countries seeing the biggest decline in regard for the WHO’s response are France (-14), India and Russia (-12) and Australia (-9). Germany (+13) and Japan (+2) are the only countries where satisfaction with the WHO’s role has increased.
These are the results of an Ipsos survey conducted April 23rd to 26th, 2020 on the Global Advisor online platform among 25,992 adults aged 18-74 in Canada and the United States and 16-74 in Australia, Brazil, France, Germany, Italy, India, Japan, Mexico, Russia, Spain and the United Kingdom. Where available, tracking results from previous studies, conducted through April and March and selected results from February are referenced by date.
The sample for April 23rd to 26th consists of approximately 2,000 individuals in each country. The samples in Australia, Canada, France, Germany, Italy, Japan, Spain, the U.K. and the U.S. can be taken as representative of these countries’ general adult population over age 16 or 18 (as above) and under the age of 75. The sample in Brazil, India, Mexico, Russia, and is more urban, more educated and/or more affluent than the general population and should be viewed as reflecting the views of the more “connected” segment of the population. The data is weighted so that each market’s sample composition best reflects the demographic profile of the adult population according to the most recent census data.
Where results do not sum to 100 or the ‘difference’ appears to be +/-1 more/less than the actual, this may be due to rounding, multiple responses or the exclusion of don’t knows or not stated responses. The precision of Ipsos online polls are calculated using a credibility interval with a poll of 1,000 accurate to +/- 3.5 percentage points. For more information on the Ipsos use of credibility intervals, please visit the Ipsos website (www.Ipsos.com).
For the Silo, Darrell Bricker, PhD CEO, Ipsos Global Public Affairs
About Ipsos
Ipsos is the world’s third largest market research company, present in 90 markets and employing more than 18,000 people.
Our passionately curious research professionals, analysts and scientists have built unique multi-specialist capabilities that provide true understanding and powerful insights into the actions, opinions and motivations of citizens, consumers, patients, customers or employees. We serve more than 5000 clients across the world with 75 business solutions.
Founded in France in 1975, Ipsos is listed on the Euronext Paris since July 1st, 1999. The company is part of the SBF 120 and the Mid-60 index and is eligible for the Deferred Settlement Service (SRD).
ISIN code FR0000073298, Reuters ISOS.PA, Bloomberg IPS:FP www.ipsos.com Featured image: Philippe Lopez/AFP/Getty Images/CNN
School has ‘been in’ for awhile now. Does your child’s school lunches sound healthy to you? How do you think it compares to school dinners from around the world? And how much do school meals affect energy levels for post-lunch learning and does that have an impact on PISA test results?
Check out this infographic to discover what the school meals of other countries look like and how each nation scores on the PISA test. For the Silo, Dinah Makani.
2018 Weed Index Study reveals the cost of marijuana and highlights the number of grow and head shops in 120 cities around the world:
With a total of 156, Los Angeles, USA has the most headshops.
Madrid, Spain has the largest amount of growshops, with a total of 68.
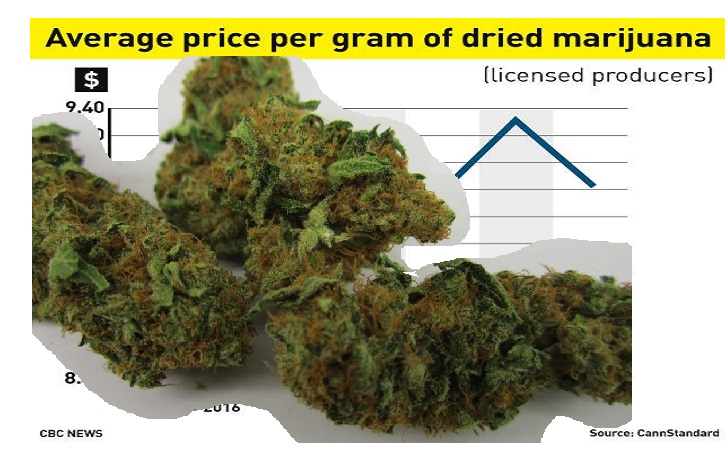
Tokyo, Japan has the most expensive cannabis, at 32.66 USD per gram, while Quito, Ecuador has the least expensive marijuana, at 1.34 USD per gram.
Based on the average US marijuana tax rates currently implemented, New York City could generate the highest potential tax revenue by legalising weed, with 156.40 million USD per year. New York City also has the highest consumption rate of cannabis, at 77.44 metric tons per year.
Berlin, Germany, 20/04/2018 – ABCD, a data-driven media campaign outlet, has released new data which reveals the number of marijuana head and growshops in 120 cities around the world. This research, which builds on the 2018 Cannabis Price Index released earlier this year, reveals which locations around the world are ready to embrace cannabis legalisation. The aim of the study is to illustrate the continuous need for legislative reform on cannabis use around the world, and to determine if there are any lessons to be learned from those cities at the forefront of marijuana legalization. By including extra data on the number of head and growshops in each city, this new research can be utilized to indicate which cities are prepared for an imminent cannabis reform, while also highlighting which cities are in opposition of marijuana legalisation.
The initial study began by selecting 120 cities across the world, including locations where cannabis is currently legal, illegal and partially legal, and where marijuana consumption data is available. Then, they looked into the price of weed per gram in each city. To calculate how much potential tax a city could make by legalising weed, ABCD investigated how much tax is paid on the most popular brand of cigarettes, as this offers the closest comparison. They then looked at what percentage marijuana is currently taxed in cities where it’s already legalised in the US.
ABCD decided to conduct the extra research in order to to further the discussion around the medical and recreational use of cannabis, and the potential industry and business opportunities that would follow legalisation. By identifying the number of headshops as well as growshops, this study serves as an indicator to a city’s existing cannabis infrastructure and willingness to accept such reform on a larger scale. As an indicating factor, the more head shops and grow shops a city has, the more positive their state’s and general public’s attitude towards the cannabis-related industry is likely to be.
The table below reveals a sample of the results for the 13 US cities featured in the study:
#
City
Legality
Price per gram, US$
Total possible tax collection, if taxed at cigarette level, mil US$
Total possible tax collection, if taxed at average US marijuana taxes, mil US$
Total consumption in metric tons
Headshops
Growshops
1
Washington, DC
Partial
18.08
47.51
20.96
6.18
20
8
2
Chicago
Partial
11.46
119.61
52.77
24.54
91
10
3
Philadelphia
Partial
11.30
68.37
30.16
14.22
41
3
4
Boston
Legal
11.01
28.59
12.61
6.10
49
4
5
New York
Partial
10.76
354.48
156.40
77.44
59
7
6
Dallas
Partial
10.03
51.01
22.5
11.95
80
6
7
Houston
Partial
10.03
89.13
39.32
20.89
125
14
8
Phoenix
Partial
9.35
58.26
25.71
14.65
72
9
9
Miami
Partial
9.27
16.24
7.16
4.12
67
25
10
San Francisco
Legal
9.27
30.94
13.65
7.85
61
3
11
Los Angeles
Legal
8.14
124.88
55.10
36.06
153
46
12
Denver
Legal
7.79
20.53
9.06
6.20
61
21
13
Seattle
Legal
7.58
20.59
9.08
6.39
46
10
The table below shows the top 10 most and least expensive cities for cannabis:
Top 10 Most Expensive Cities
Top 10 Least Expensive Cities
#
City
Country
Legality
Price per gram, US$
#
City
Country
Legality
Price per gram, US$
1
Tokyo
Japan
Illegal
32.66
1
Quito
Ecuador
Partial
1.34
2
Seoul
South Korea
Illegal
32.44
2
Bogota
Colombia
Partial
2.20
3
Kyoto
Japan
Illegal
29.65
3
Asuncion
Paraguay
Partial
2.22
4
Hong Kong
China
Illegal
27.48
4
Jakarta
Indonesia
Illegal
3.79
5
Bangkok
Thailand
Partial
24.81
5
Panama City
Panama
Illegal
3.85
6
Dublin
Ireland
Illegal
21.63
6
Johannesburg
South Africa
Illegal
4.01
7
Tallinn
Estonia
Partial
20.98
7
Montevideo
Uruguay
Legal
4.15
8
Shanghai
China
Illegal
20.82
8
Astana
Kazakhstan
Illegal
4.22
9
Beijing
China
Illegal
20.52
9
Antwerp
Belgium
Partial
4.29
10
Oslo
Norway
Partial
19.14
10
New Delhi
India
Partial
4.38
The table Below shows the top 10 cities with the most growshops:
#
City
Country
Legality
Growshops
1
Madrid
Spain
Partial
68
2
Buenos Aires
Argentina
Partial
48
3
Los Angeles
USA
Legal
46
4
Toronto
Canada
Partial
37
5
Melbourne
Australia
Partial
31
6
Miami
USA
Partial
25
7
London
UK
Illegal
23
8
Barcelona
Spain
Partial
23
9
Denver
USA
Legal
21
10
Berlin
Germany
Partial
20
The table Below shows the top 10 cities with the most headshops:
#
City
Country
Legality
Headshops
1
Los Angeles
USA
Legal
156
2
Houston
USA
Partial
125
3
Chicago
USA
Partial
91
4
Dallas
USA
Partial
80
5
Phoenix
USA
Partial
72
6
Miami
USA
Partial
67
7
San Francisco
USA
Legal
61
8
Denver
USA
Legal
61
9
New York
USA
Partial
59
10
Boston
USA
Legal
49
The table below shows the top 10 cities who could generate the most potential tax by legalising cannabis, if taxed at the same rate as the most popular cigarette brand:
#
City
Country
Legality
Price per gram, US$
% of cigarette tax
Possible tax revenue, mil US$
1
Cairo
Egypt
Illegal
16.15
73.13
384.87
2
New York
USA
Partial
10.76
42.54
354.48
3
London
UK
Illegal
9.20
82.16
237.35
4
Sydney
Australia
Partial
10.79
56.76
138.36
5
Karachi
Pakistan
Illegal
5.32
60.7
135.48
6
Melbourne
Australia
Partial
10.84
56.76
132.75
7
Moscow
Russia
Partial
11.84
47.63
128.97
8
Toronto
Canada
Partial
7.82
69.8
124.15
9
Chicago
USA
Partial
11.46
42.54
119.61
10
Berlin
Germany
Partial
13.53
72.9
114.77
N.B. % of cigarette tax refers to the tax percentage on the most popular brand. Possible tax revenue refers to the total possible tax collection per year, if taxed at cigarette level. For a full explanation of how the study was conducted, please see the methodology at the bottom of the press release.
The table below shows the top 10 cities who could generate the most potential tax by legalising cannabis, if taxed at the average US marijuana tax rate:
#
City
Country
Legality
Price per gram, US$
Possible tax revenue, mil US$
1
New York
USA
Partial
10.76
156.4
2
Cairo
Egypt
Illegal
16.15
98.78
3
London
UK
Illegal
9.20
54.22
4
Chicago
USA
Partial
11.46
52.77
5
Moscow
Russia
Partial
11.84
50.82
6
Sydney
Australia
Partial
10.79
45.75
7
Melbourne
Australia
Partial
10.84
43.9
8
Karachi
Pakistan
Illegal
5.32
41.89
9
Houston
USA
Partial
10.03
39.32
10
Toronto
Canada
Partial
7.82
33.38
N.B. Possible tax revenue refers to the total possible tax collection per year, if taxed at average US marijuana tax rate.
The table below shows the top 10 cities with the highest and lowest consumption of cannabis, per year:
Highest Consumers of Cannabis
Lowest Consumers of Cannabis
#
City
Country
Legality
Price per gram, US$
Total consumption, metric tons
#
City
Country
Legality
Price per gram, US$
Total consumption, metric tons
1
New York
USA
Partial
10.76
77.44
1
Singapore
Singapore
Illegal
14.01
0.02
2
Karachi
Pakistan
Illegal
5.32
41.95
2
Santo Domingo
Dominican Rep.
Illegal
6.93
0.16
3
New Delhi
India
Partial
4.38
38.26
3
Kyoto
Japan
Illegal
29.65
0.24
4
Los Angeles
USA
Legal
8.14
36.06
4
Thessaloniki
Greece
Partial
13.49
0.29
5
Cairo
Egypt
Illegal
16.15
32.59
5
Luxembourg City
Luxembourg
Partial
7.26
0.32
6
Mumbai
India
Partial
4.57
32.38
6
Panama City
Panama
Illegal
3.85
0.37
7
London
UK
Illegal
9.20
31.4
7
Reykjavik
Iceland
Illegal
15.92
0.44
8
Chicago
USA
Partial
11.46
24.54
8
Asuncion
Paraguay
Partial
2.22
0.46
9
Moscow
Russia
Partial
11.84
22.87
9
Colombo
Sri Lanka
Illegal
9.12
0.59
10
Toronto
Canada
Partial
7.82
22.75
10
Manila
Philippines
Illegal
5.24
0.6
N.B. Total consumption is calculated per annum.
Further findings:
Shanghai, China has a large population of 24.15 million, has however no headshops or growshops in the city, underlining a resistance against cannabis reform.
On average, the status of legality (e.g. Legal, Partial or Illegal) coincides with the amount of headshops and growshops found in each city. The favourable the laws, the better the cannabis infrastructure
New York City, USA has the highest consumption rate of cannabis, at 77.44 metric tons per year.
Boston, USA has the most expensive cannabis of all the cities where it’s legal, at 11.01 USD, while Montevideo, Uruguay has the least expensive at 4.15 USD.
While Tokyo, Japan has the most expensive cannabis of all cities where it’s illegal, at 32.66 USD, Jakarta, Indonesia has the least expensive at 3.79 USD, despite being classed as a Group 1 drug with harsh sentences such as life imprisonment and the death penalty.
For cities where cannabis is partially legal, Bangkok, Thailand has the most expensive at 24.81 USD, while Quito, Ecuador has the least expensive at 1.34 USD.
Bulgaria has the highest tax rates for the most popular brand of cigarettes, at 82.65%, while Paraguay has the lowest, with rates of 16%.
Cairo, Egypt would gain the most revenue in tax if they were to legalise cannabis and tax it as the same rate as cigarettes, at 384.87 million USD. Singapore, Singapore would gain the least, at 0.14 million USD, due in part to the city’s low consumption of marijuana at 0.02 metric tons per annum.
Based on the average US marijuana tax rates currently implemented, New York City could generate the highest potential tax revenue by legalising weed, with 156.4 million USD per year. Singapore, Singapore would gain the least, at 0.04 million USD.
The full results of the 2018 Cannabis Price Index:
#
City
Country
Legality
Price per gram, US$
Taxes of cigarettes, % of the most sold brand
Total possible tax collection, if taxed at cigarette level, mil US$
Total possible tax collection, if taxed at average US marijuana taxes, mil US$
Total Consumption in metric tons
1
Tokyo
Japan
Illegal
32.66
64.36
32.14
9.37
1.53
2
Seoul
South Korea
Illegal
32.44
61.99
31.61
9.57
1.57
3
Kyoto
Japan
Illegal
29.65
64.36
4.64
1.35
0.24
4
Hong Kong
China
Illegal
27.48
44.43
19.72
8.33
1.62
5
Bangkok
Thailand
Partial
24.81
73.13
99.11
25.44
5.46
6
Dublin
Ireland
Illegal
21.63
77.80
29.31
7.07
1.74
7
Tallinn
Estonia
Partial
20.98
77.24
22.13
5.38
1.37
8
Shanghai
China
Illegal
20.82
44.43
49.12
20.75
5.31
9
Beijing
China
Illegal
20.52
44.43
43.10
18.21
4.73
10
Oslo
Norway
Partial
19.14
68.83
19.28
5.26
1.46
11
Washington, DC
USA
Partial
18.08
42.54
47.51
20.96
6.18
12
Cairo
Egypt
Illegal
16.15
73.13
384.87
98.78
32.59
13
Reykjavik
Iceland
Illegal
15.92
56.40
3.97
1.32
0.44
14
Belfast
Ireland
Illegal
15.81
77.80
13.55
3.27
1.10
15
Minsk
Belarus
Illegal
15.80
51.15
9.08
3.33
1.12
16
Athens
Greece
Partial
14.95
79.95
7.42
1.74
0.62
17
Auckland
New Zealand
Partial
14.77
77.34
106.03
25.73
9.28
18
Munich
Germany
Partial
14.56
72.90
50.90
13.10
4.80
19
Helsinki
Finland
Partial
14.42
81.53
27.12
6.24
2.31
20
Singapore
Singapore
Illegal
14.01
66.23
0.14
0.04
0.02
21
Berlin
Germany
Partial
13.53
72.90
114.77
29.55
11.64
22
Stuttgart
Germany
Partial
13.50
72.90
20.20
5.20
2.05
23
Thessaloniki
Greece
Partial
13.49
79.95
3.17
0.75
0.29
24
Stockholm
Sweden
Illegal
13.20
68.84
15.06
4.11
1.66
25
Vienna
Austria
Partial
12.87
74.00
59.21
15.02
6.22
26
Copenhagen
Denmark
Partial
12.47
74.75
20.65
5.18
2.22
27
Moscow
Russia
Partial
11.84
47.63
128.97
50.82
22.87
28
Hamburg
Germany
Partial
11.64
72.90
50.16
12.92
5.91
29
Chicago
USA
Partial
11.46
42.54
119.61
52.77
24.54
30
Philadelphia
USA
Partial
11.30
42.54
68.37
30.16
14.22
31
Bucharest
Romania
Partial
11.18
75.41
17.23
4.29
2.04
32
Cologne
Germany
Partial
11.14
72.90
28.51
7.34
3.51
33
Geneva
Switzerland
Partial
11.12
61.20
5.90
1.81
0.87
34
Boston
USA
Legal
11.01
42.54
28.59
12.61
6.10
35
Adelaide
Australia
Partial
10.91
56.76
41.60
13.75
6.72
36
Istanbul
Turkey
Partial
10.87
82.13
21.79
4.98
2.44
37
Melbourne
Australia
Partial
10.84
56.76
132.75
43.90
21.58
38
Sydney
Australia
Partial
10.79
56.76
138.36
45.75
22.59
39
New York
USA
Partial
10.76
42.54
354.48
156.40
77.44
40
Düsseldorf
Germany
Partial
10.70
72.90
15.82
4.07
2.03
41
Brisbane
Australia
Partial
10.63
56.76
66.88
22.12
11.09
42
Hanover
Germany
Partial
10.51
72.90
13.46
3.47
1.76
43
Prague
Czech Rep.
Partial
10.47
77.42
63.95
15.50
7.89
44
Frankfurt
Germany
Partial
10.29
72.90
18.06
4.65
2.41
45
Wellington
New Zealand
Partial
10.11
77.34
19.53
4.74
2.50
46
Dallas
USA
Partial
10.03
42.54
51.01
22.50
11.95
47
Houston
USA
Partial
10.03
42.54
89.13
39.32
20.89
48
Vilnius
Lithuania
Illegal
10.00
75.76
5.20
1.29
0.69
49
Zurich
Switzerland
Partial
9.71
61.20
10.33
3.17
1.74
50
Montpellier
France
Illegal
9.70
80.30
12.21
2.85
1.57
51
Canberra
Australia
Partial
9.65
56.76
10.96
3.63
2.00
52
Zagreb
Croatia
Partial
9.43
75.26
24.35
6.07
3.43
53
Nice
France
Illegal
9.40
80.30
15.80
3.69
2.09
54
Phoenix
USA
Partial
9.35
42.54
58.26
25.71
14.65
55
Paris
France
Illegal
9.30
80.30
102.25
23.90
13.69
56
Miami
USA
Partial
9.27
42.54
16.24
7.16
4.12
57
San Francisco
USA
Legal
9.27
42.54
30.94
13.65
7.85
58
London
UK
Illegal
9.20
82.16
237.35
54.22
31.40
59
Colombo
Sri Lanka
Illegal
9.12
73.78
3.98
1.01
0.59
60
Riga
Latvia
Illegal
9.00
76.89
10.23
2.50
1.48
61
Bratislava
Slovakia
Illegal
8.92
81.54
7.24
1.67
1.00
62
Milan
Italy
Partial
8.85
75.68
46.06
11.42
6.88
63
Varna
Bulgaria
Illegal
8.83
82.65
4.84
1.10
0.66
64
Marseille
France
Illegal
8.69
80.30
36.23
8.47
5.19
65
Glasgow
UK
Illegal
8.65
82.16
15.21
3.47
2.14
66
Toulouse
France
Illegal
8.62
80.30
18.67
4.36
2.70
67
Birmingham
UK
Illegal
8.58
82.16
27.73
6.34
3.93
68
Kuala Lumpur
Malaysia
Illegal
8.54
55.36
6.61
2.24
1.40
69
Monterrey
Mexico
Partial
8.45
65.87
4.17
1.19
0.75
70
Edinburgh
UK
Illegal
8.41
82.16
12.22
2.79
1.77
71
Lisbon
Portugal
Partial
8.36
74.51
4.69
1.18
0.75
72
Strasbourg
France
Illegal
8.35
80.30
11.13
2.60
1.66
73
Warsaw
Poland
Partial
8.31
80.29
29.27
6.84
4.39
74
Lyon
France
Illegal
8.20
80.30
19.45
4.55
2.95
75
Los Angeles
USA
Legal
8.14
42.54
124.88
55.10
36.06
76
Liverpool
UK
Illegal
7.94
82.16
10.86
2.48
1.67
77
Amsterdam
Netherlands
Partial
7.89
73.40
20.94
5.35
3.61
78
Manchester
UK
Illegal
7.88
82.16
58.99
13.48
9.11
79
Rome
Italy
Partial
7.86
75.68
88.16
21.86
14.82
80
Toronto
Canada
Partial
7.82
69.80
124.15
33.38
22.75
81
Denver
USA
Legal
7.79
42.54
20.53
9.06
6.20
82
Naples
Italy
Partial
7.75
75.68
29.82
7.40
5.08
83
Leeds
UK
Illegal
7.67
82.16
16.93
3.87
2.69
84
Seattle
USA
Legal
7.58
42.54
20.59
9.08
6.39
85
Madrid
Spain
Partial
7.47
78.09
93.40
22.45
16.01
86
Calgary
Canada
Partial
7.30
69.80
52.23
14.05
10.25
87
Luxembourg City
Luxembourg
Partial
7.26
70.24
1.62
0.43
0.32
88
San Jose
Costa Rica
Partial
7.23
69.76
7.84
2.11
1.56
89
Buenos Aires
Argentina
Partial
7.13
69.84
25.32
6.81
5.09
90
Brussels
Belgium
Partial
7.09
75.92
15.50
3.83
2.88
91
Santo Domingo
Dominican Rep.
Illegal
6.93
58.87
0.67
0.21
0.16
92
Graz
Austria
Partial
6.84
74.00
4.81
1.22
0.95
93
Budapest
Hungary
Illegal
6.74
77.26
7.70
1.87
1.48
94
Sofia
Bulgaria
Illegal
6.66
82.65
12.83
2.91
2.33
95
Ottawa
Canada
Partial
6.62
69.80
35.43
9.53
7.67
96
Vancouver
Canada
Partial
6.40
69.80
23.44
6.30
5.25
97
Sao Paulo
Brazil
Partial
6.38
64.94
68.55
19.81
16.55
98
Rotterdam
Netherlands
Partial
6.33
73.40
12.75
3.26
2.74
99
Ljubljana
Slovenia
Partial
6.32
80.41
3.43
0.80
0.67
100
Barcelona
Spain
Partial
6.23
78.09
39.59
9.51
8.14
101
Montreal
Canada
Partial
6.15
69.80
60.52
16.27
14.10
102
Kiev
Ukraine
Partial
6.00
74.78
14.73
3.70
3.28
103
Abuja
Nigeria
Illegal
5.88
20.63
7.40
6.73
6.10
104
Lima
Peru
Partial
5.88
37.83
12.28
6.09
5.52
105
Mexico City
Mexico
Partial
5.87
65.87
22.58
6.43
5.84
106
Cape Town
South Africa
Illegal
5.82
48.80
2.47
0.95
0.87
107
Karachi
Pakistan
Illegal
5.32
60.70
135.48
41.89
41.95
108
Manila
Philippines
Illegal
5.24
74.27
2.32
0.59
0.60
109
Rio de Janeiro
Brazil
Partial
5.11
64.94
28.82
8.33
8.69
110
Mumbai
India
Partial
4.57
60.39
89.38
27.78
32.38
111
New Delhi
India
Partial
4.38
60.39
101.20
31.45
38.26
112
Antwerp
Belgium
Partial
4.29
75.92
4.10
1.01
1.26
113
Astana
Kazakhstan
Illegal
4.22
39.29
1.78
0.85
1.07
114
Montevideo
Uruguay
Legal
4.15
66.75
19.54
5.50
7.06
115
Johannesburg
South Africa
Illegal
4.01
48.80
3.76
1.45
1.92
116
Panama City
Panama
Illegal
3.85
56.52
0.81
0.27
0.37
117
Jakarta
Indonesia
Illegal
3.79
53.40
1.92
0.68
0.95
118
Asuncion
Paraguay
Partial
2.22
16.00
0.16
0.19
0.46
119
Bogota
Colombia
Partial
2.20
49.44
15.80
6.00
14.53
120
Quito
Ecuador
Partial
1.34
70.39
0.56
0.15
0.60
Methodology
Selection of the cities:
To select the cities for the study, Seedo first looked at the top and bottom cannabis consuming countries around the world. Then they analysed nations where marijuana is partially or completely legal, as well as illegal, and selected the final list of 120 cities in order to best offer a representative comparison of the global cannabis price.
Data:
Price per gram, US$ – Crowdsourced city-level surveys adjusted to World Drug Report 2017 of the United Nations Office on Drugs and Crime.
Taxes on Cigarettes, % of the most sold brand – Taxes as a percentage of the retail price of the most sold brand (total tax). Source: Appendix 2 of the WHO report on the global tobacco epidemic, 2015.
Annual possible tax collection is calculated in the following way:
Population: latest available local population data sources.
Annual Prevalence (percentage of population, having used weed in the year). Source: World Drug Report 2017 of the United Nations Office on Drugs and Crime
Average Consumption of weed per year in grams (people who consumed weed at least once in the previous year).
Estimation, with the assumption, that one use of weed on average means one joint.
One joint is assumed to have 0.66 grams of weed as in the paper of Mariani, Brooks, Haney and Levin (2010).
The distribution of use during the year is assumed to be the same as in Zhao and Harris (2004), where the yearly usage varies from once or twice a year to everyday.
Population: latest available local population data sources.
Annual Prevalence (percentage of population, having used weed in the year). Source: World Drug Report 2017 of the United Nations Office on Drugs and Crime
Average Consumption of weed per year in grams (people who consumed weed at least once in the previous year).
Estimation, with the assumption, that one use of weed on average means one joint.
One joint is assumed to have 0.66 grams of weed as in the paper of Mariani, Brooks, Haney and Levin (2010).
The distribution of use during the year is assumed to be the same as in Zhao and Harris (2004), where the yearly usage varies from once or twice a year to everyday.
US tax level – Average tax level in the states of US where weed is legal: Alaska, California, Colorado, Maine, Massachusetts, Nevada, Oregon and Washington. Includes retail sales taxes, state taxes, local taxes and excise taxes.
Growshops – Sourced via Google Maps Listings 2018
Headshops – Sourced via Google Maps Data Listings 2018
Legality
Legal, if possession and selling for recreational and medical use is legal.
Illegal, if possession and selling for recreational and medical use is illegal.
Partial, if
Possession of small amounts is decriminalised (criminal penalties lessened, fines and regulated permits may still apply)
OR medicinal use legal
OR possession is legal, selling illegal
OR scientific use legal
OR usage allowed in restricted areas (e.g. homes or coffee shops)
OR local laws may apply to legality (e.g. illegal at federal level, legal at state level)
First quote: Based on New York City Council’s free lunch initiative which began in September 2017, with 1.1 million public school children, at a cost of $1.75 per child per day.
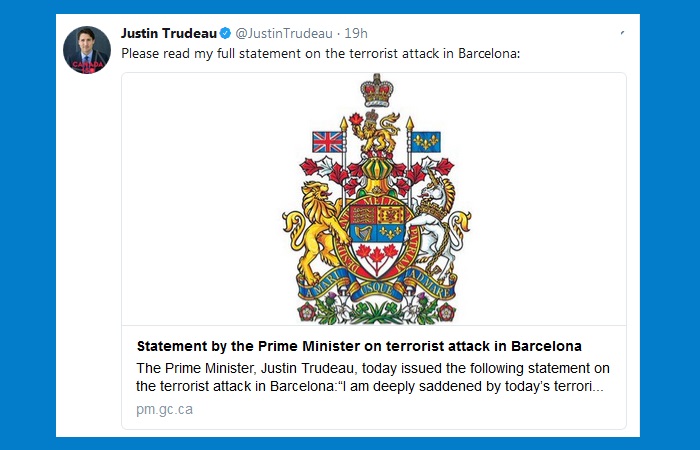
“Sophie and I join all Canadians in offering our sincere condolences to the families and friends who have lost loved ones, and our best wishes for a fast and full recovery to those injured [yesterday].
“While we cannot ignore the outrage we feel, together we must renew our commitment to protect the freedom found in societies that promote unity, openness and inclusion.
“Spain, we grieve with you and denounce hate and violence in all of its forms. Canada will continue working with the international community to fight terrorism and build a world where we can all feel safe and secure.”