Working with thousands of clients over the years as an online dating coach, I’ve seen so many simple errors intelligent singles make that hamper their chances with online dating.
Before you say online dating does not work (it does), or it will not work for me (why not?), or my friends tell me horror stories (believe me, they are doing something wrong—it’s them, not the app/site), here are some things to think about:
A unique Profile
Short and Sweet sells. No one wants to read a long monologue. Here’s an excerpt of a profile I wrote for a male client that got great traction….and a relationship:
NO: beets, videoconference dates, whining about online dating apps, Red Wings, selfishness, arrogance, snakes. I can’t grow a bougainvillea to save myself. It grows like a weed here and I can’t keep it alive for 10 days.”
We had trouble keeping up with the responses he got!
Your Profile It must be grammatically perfect with no mistakes. Yes, people read these and if they see you using “there” and “their” wrong, they very well may skip right over you. Spellcheck is your BF!
Messages If I hear one more woman tell me the man should reach out first, I’ll lose it!. Men love when you make the first move. If they do send a message, it can be one of two big mistakes:
It’s a short generic message
It’s a 3-paragraph novella where you are cross-eyed by the end with way too much information. Nobody will read this.
The Phone thing Pre-date, why do you need to chat on the phone? Here are the issues with that: A. A 45–60-minute call—client all excited as they have so much in common and the first date expectations have risen astronomically. Very few dates can measure up now.
B. A short, awkward call and no date ensues. This is a bummer because the other person may just not be good on the phone—perhaps a bit reserved, shy, etc. This could have been the right person for you!
Ok, the only time I encourage a phone call is if there is significant distance.
You live within 20 minutes of each other. Go on the date. It’s coffee or a drink. Get dressed and go!
Your photos Nobody, yes, nobody goes to your profile first. Photos make or break you.
If you are serious about online dating and going on good dates or perhaps beginning a relationship, 5-6 great photos are a necessity. And by that I do not mean filtered, air-brushed, highly edited photos. I just mean you at your very best. And current—as in from the past year. And what you will look like when you show up on your date.
Action shots sell. I had a NYC Wall Street-type juggling in a pic. Plus, he bowls. (I guess no one bowls and that grabbed a bit of attention). Not the stereotypical private equity guy, right?
I hope this helps you a bit—I love what I do and enjoy my one-on-one contact with clients. It’s one of the reasons that I sold It’s Just Lunch (I founded it in 1991 and sold out to Private Equity when we had 110 locations globally) as I missed client contact. Remember, it only takes one! For the Silo, Andrea McGinty.
Take it from our friends at rennlist, Porsche has built some truly remarkable engines over the years. The air-cooled 911/83 engine that powered the 1973 911 2.7L Carrera RS is just one example. But if you were asked to go on and list the ten all-time greatest Porsche engines there is a good chance the list would be dominated by various Mezger engines.
The 12-cylinder found in the Le Mans-winning Porsche 917? That’s a Mezger. The 3.6L flat six in the 996 GT3? That’s a Mezger. The 4.0L in the 997 GT3 RS 4.0? That’s a Mezger.
How about going all the way back to the original 901/911 engine? Yup, that’s a Mezger.
But what is a Mezger engine, and why are they so special? That is what we are going to discuss here today. We have come up with 9 reasons why the Mezger engine is so special. And there is no other place to begin the discussion than the legendary man behind these engines, Hans Mezger.
1. Hans Mezger
A single slide can in no way capture all that the legendary Hans Mezger accomplished. He joined Porsche back in October of 1956. He loved Porsche sports cars, but his first job was working on diesel engine development. In 1960, he began to work on the type 753 flat-eight engine for Porsche’s first Formula 1 car. Soon after he designed the 6-cylinder boxer engine for the 901/911. He was then promoted to the head of race car design. He was responsible for the 917 and the 12-cylinder engine that powered it to Porsche’s first Le Mans victory in 1970. He then was responsible for the turbocharged 917/10 and 917/30 cars that dominated Can Am. He designed and developed the six-cylinder turbo engines for the Type 935 and 936 race cars.
Mezger designed the 1.5L V6 engine known as the TAG Turbo that powered the McLaren Formula 1 cars to championships in 1984, 1985 and 1986. His engines would eventually be found in the most performance-oriented Porsche road cars such as the 996 GT3, GT2 and Turbo. Mezger remained closely connected with the Porsche brand until he passed away on June 10, 2020, at the age of 90.
2. Motorsport Pedigree
Mezger built engines for the most demanding races in the world. His engines that were put into Porsche road cars have the same engineering approach. These engines are designed for long-term high performance. They are essentially overbuilt for road use. These engines were not designed to meet a certain price point. They were designed to provide the best performance. There were no corners cut with any Mezger engine.
3. Birth of the GT3
Many people view the 911 GT3 models as the pinnacle of the 911 range. One of the main reasons why is because of the track-focused, high-revving flat-six engine out back. It all started with the M96.79 engine found in the 996 GT3. The European market got the GT3 a few years before us and had the M96.76 engine, but the point is the same. The GT3 legend began in large part because of the incredible engine that powered it. This dry sump engine could rev to 8,200 rpm all day long. The engine was derived from the Porsche 911 GT1-9,8 which happened to win a little race called the 24 Hours of Le Mans. The street version of this engine is nearly bulletproof,f and the GT3 legend was born.
4. Turbocharged Versions
If the GT3 was just not powerful enough for you, Porsche had a solution. The GT2 and Turbo also used Mezger engines, but with a pair of turbochargers. They are not as high-revving as the normally aspirated units, but they offer more power and a lot more torque. And these engines are just as reliable.
5. Reliability
The Mezger engines are not just more powerful but also more reliable. The knock on the M96 and M97 engine series has long been the IMS bearing. But the Mezger versions don’t have the same design. Instead, they use plain bearings that are pressure-fed engine oil for lubrication. These bearings don’t fail. That alone makes the Mezger significantly more reliable.
6. Sound
Even if these engines were not more durable and powerful, people would buy them for their sound alone. It is not just their high-revving nature in naturally aspirated form. But the design of the engine itself, with features such as dual timing chains that give these engines a more characterful sound. They are more gravely and “motorsporty” sounding than the non-Mezger engines.
7. Power Upgrades
These engines were overbuilt and as such, are typically able to comfortably handle more power if you want to modify them. The turbo versions can easily be tuned to reliably make more power. Of course, every engine has its limitations, but the Mezger engine is robust enough to make more power without hurting reliability.
8. The 997 GT3 RS 4.0
Many people consider the 997 GT3 RS 4.0 to be the best Porsche 911 road car of all time. It just so happens to be equipped with the last Mezger engine. A 4.0L jewel making nearly 500 naturally aspirated horsepower. The engine revs to 8,500 rpm and has more character in it than an entire truckload of new 992.2 Carreras. The 4.0L marked the end of an era. It is the last and possibly the best road-going Mezger engine ever produced.
9. Rarity and Desirability
Not every Porsche got a Mezger engine. Technically, all the air-cooled 911s have a Mezger-designed engine, but they have been out of production for over a quarter of a century now. Only a small percentage of water-cooled Porsche engines were a Mezger design. And Porsche is not building any more of them. So, what is out there today is all that will ever be out there. These engines are found in the most desirable Porsche models, and these cars are collectible today and will continue to be collectible for the foreseeable future. If you buy a Porsche with a Mezger engine today, the chances are good that it will be worth the same or even more tomorrow. For the Silo, Joe Kucinski.
May, 2025 – Canada cannot rely on immigration alone to address the challenges posed by its ageing population and relentless decline in fertility rates [ see Canada’s Soaring Housing and Living Costs Stop Baby Making CP], according to a new report from our friends at the C.D. Howe Institute. Without a broader population strategy, rising immigration could fuel rapid growth while straining housing, healthcare, and infrastructure – without fully resolving rising old-age dependency ratios or labour force pressures.
In this post, Daniel Hiebert confronts an important policy dilemma: although immigration increases overall population and helps address short-term labour gaps, the long-term trade-offs are significant. Without corresponding investment and planning, rising immigration risks compounding the very pressures it aims to alleviate.
“This is a particularly opportune moment to reflect on how immigration fits into Canada’s long-term demographic strategy, especially as both permanent and temporary immigration surged between 2015 and 2024, and are now being scaled back,” says Hiebert. “We need to think ahead about what kind of future we are building — and how we get there.”
Based on current patterns, it takes five new immigrants to add just one net new worker, once dependents and added consumer demand are factored in — a reality that undermines assumptions about immigration as a direct fix for labour shortages.
Hiebert argues that Canada must move beyond short-term immigration planning and adopt a long-range population strategy — one that combines immigration with other tools like delayed retirement, increased workforce participation, and stronger productivity growth. The alternative, he warns, is a “population trap”: a scenario where growth outpaces the country’s capacity to support it, undercutting prosperity in the process.
The report also calls on governments to coordinate immigration levels with long-term planning in housing, healthcare, education, and infrastructure.
“There’s no question that immigration is integral to Canada’s future,” says Hiebert. “But assuming it can carry the load alone ignores the structural pressures we’re facing — and the investments we need to make today to ensure future stability.”
Balancing Canada’s Population Growth and Ageing Through Immigration Policy
Canada faces twin demographic pressures: an ageing population and rapid population growth driven by immigration. The report argues that immigration levels must strike a careful balance – sufficient to offset some effects of low fertility and an ageing workforce, but not so high as to outpace infrastructure and economic capacity.
A sustainable population strategy requires coordinated planning across immigration, infrastructure, workforce participation, and capital investment. The report calls for long-term planning that aligns immigration policy with economic and social goals and emphasizes the need to manage absorptive capacity to avoid overburdening housing, healthcare, and public services.
Introduction
Declining fertility is a global trend and is especially pronounced in countries with high levels of economic development. These countries share the common challenge of ageing populations, with rising old-age dependency ratios (OADRs)1 and a shrinking portion of the population in prime working age. Several policy responses have been established to deal with this emerging reality, including pronatalist and other family-based social programs, efforts to enhance automation and productivity, incentivization of a larger proportion of the population to enter the formal labour force, delaying retirement benefits, and increasing the rate of immigration. The success of these approaches has varied, raising critical questions for policymakers: which strategies are the most efficient? What are their costs? And which policies offer the best balance between risk and reward?
This Commentary explores the potential role and limitations of immigration in alleviating Canada’s challenges of low fertility and ageing. This is a particularly opportune moment to consider such an issue given that both permanent and temporary immigration strongly increased between 2015 and 2024 and will be reduced for the 2025 to 2027 period.
Using custom demographic projections, this paper examines how various immigration scenarios – ranging from historical rates to the peak of 2024 – will affect Canada’s demographic outlook over the next 50 years. The analysis investigates the role immigration could play in mitigating the effects of an ageing population, while also acknowledging the associated trade-offs, including pressures on infrastructure and rapid population growth. The findings highlight that Canada’s immigration policy, while important, should be framed within a long-term population strategy that aligns immigration policy with broader economic and social goals – including capital investment, productivity, delayed retirement, and expanded social infrastructure – to ensure sustainable growth and enhanced prosperity for all Canadians.
Canada’s Demographic Challenge and Recent Immigration Policy Responses
Canada’s current demographic challenge is the product of two primary factors: low fertility and the ageing and retirement of the Baby Boom generation. Canada’s fertility rate first rapidly declined from the peak of the Baby Boom (1950s) to the early 1970s, when it first fell below the replacement level. Since then, it has continued with a slower, though persistent decline, interrupted by occasional slight recoveries. Most recent calculations reveal that Canada’s fertility rate is now at 1.26 – a level unprecedented in Canadian history and among the lowest globally. The consequences of low fertility are particularly pronounced today due to the ageing of the Baby Boom generation. In 2025, this cohort ranges in age from 59 to 79 years old, while the average age of retirement in Canada was 65.1 in 2023. Around two-thirds of boomers have already reached the age of 65, with the remaining third expected to follow in the coming years. The impact of this demographic shift is therefore ongoing and continues to affect the labour market and economy at large.
Throughout its history, Canada has turned to immigration to resolve demographic challenges (Hiebert 2016). From the late 1940s to the mid-1980s, Canada admitted an average of 150,000 permanent residents annually, though numbers fluctuated. By the end of that period, concerns over low fertility began to be articulated. This prompted the government to increase annual immigration levels to 250,000, a figure that was quite consistent over the following 30 years, with annual rates ranging from the low to high 200,000s. By the end of the 20th century, immigration accounted for over half of Canada’s population growth and labour force expansion.
The most recent shift in immigration policy began in late 2015 under the Liberal government, which pursued an expansionary strategy. Annual immigration targets and admission levels increased – save for the 2020 pandemic year – leading to a target of 500,000 for 2025. However, this target will no longer be realized following the revised plan announced at the end of 2024. Along with increased permanent immigration, the government had adopted a more facilitative approach to temporary migration, leading to rapid growth in the number of international students, temporary foreign workers, and other non-permanent residents. In 2023, the Canadian population expanded by 1.27 million, representing an annual growth rate of 3.2 percent, which is highly unusual among advanced economies. For example, the average population growth rate of the other G7 countries in 2023 was less than 0.5 percent (Scotiabank 2023).2
Given Canada’s low fertility, 98 percent of this growth stemmed from net immigration, both temporary and permanent (Statistics Canada 2024a). Today, Canada is approaching a point where all population growth and most of the impetus for population renewal (Dion et al. 2015) will come from immigration. However, the “big migration” trajectory of 2015 to 2024 has shifted. While public opinion historically supported ambitious immigration targets, this sentiment changed sharply in 2024. Concerns about housing shortages, infrastructure strain, and what has been termed a “population trap” – where population growth outpaces capital investment capacity – have fueled resistance to current immigration levels. These pressures clearly influenced the 2025 to 2027 plan, which curtails permanent immigration targets by approximately 20 percent and tightens restrictions on temporary migration programs.
Short- and Long-Term Immigration Policy
Before focusing on the relationship between immigration and demography, it is instructive to explore a fundamental tension in immigration policy: should the Government of Canada prioritize the “maximum social, cultural and economic benefits of immigration”3 for today or for the future? These goals may not always align: satisfying the needs of today may have long-term consequences – a trade-off familiar to anyone who has managed a budget.
It has been long underappreciated that Canada’s immigration policy is built around a combination of short- and long-term goals. Economic selection practices provide a helpful example. Since the introduction of the points system nearly 60 years ago, selection priorities have oscillated between addressing short-term labour market needs (e.g., incorporating and/or prioritizing job offers in selection criteria) and building the human capital of the future workforce, under the assumption that highly skilled individuals can adapt and drive productivity, and therefore prosperity. Striking the right balance between these priorities is challenging and requires careful planning.
The balance between short- and long-term immigration perspectives is reflected in the combination of the economic selection system and levels planning. The former – which includes permanent skilled immigration – involves trade-offs between filling immediate labour shortages and building future human capital.4 The latter determines the scale and composition of Canada’s permanent immigration system. In contrast, temporary migration programs are almost entirely shaped by short-term planning horizons – with the partial exception of the International Student Program, which operates in accordance with a medium-term planning horizon in five-year increments.5
These issues are pivotal to considerations of the relationship between immigration and demography. The impact of immigration extends beyond the number of admissions. If immigrants are selected to enhance the human capital of Canada’s workforce and integrate productively, they can potentially raise per capita GDP and mitigate the challenges of an ageing population (Erkisi 2023; Montcho et al. 2021). Conversely, if the system prioritizes lower-skilled individuals, fails to utilize the skills of highly educated immigrants, or admits newcomers at a scale that exceeds the economy’s capacity to absorb them, it risks lowering per capita GDP and compounding demographic challenges (Smith 2024).
Immigration, therefore, has both scale and compositional effects. Scale impacts include changes to population size, age structure, and regional distribution, which directly affect housing demand and social services. Compositional impacts include broader socioeconomic outcomes such as income inequality, productivity, and trade relationships. While this paper focuses on scale impacts, readers should bear these compositional effects in mind.
Another critical consideration is the relationship between admission levels and the expected economic outcome of admitted immigrants. In Canada’s Express Entry system, admission thresholds are adjusted based on the number of entries. Larger admission cohorts tend to lower the points threshold, potentially reducing the overall human capital of entrants (Mahboubi 2024).
Immigration and Canada’s Demographic Challenge
This paper argues that long-term considerations should play a larger role in immigration levels planning. Immigration decisions made today shape Canada’s demographic structure for decades, as immigrants become part of the population, contribute to fertility, enter the workforce, and eventually retire. These stages must be incorporated into demographic projections and policy planning, yet they are often overlooked due to the focus on immediate needs and political cycles.
To illustrate the long-term demographic impact of immigration, consider two extreme scenarios. In the first, Canada’s fertility rate declines to 1.0 (the 2023 rate in British Columbia) and net migration falls to zero, implying no population growth from migration. Under these conditions, Canada’s population would shrink from 40 million in 2023 to 12.3 million by 2100. In the second scenario, the extraordinary 2023 growth rate of 3.2 percent continues indefinitely, with rising migration levels. By 2100, Canada’s population would reach 452 million.
While neither of these scenarios is realistic, they illustrate the decisive influence that fertility and migration have in shaping the future scale of Canada’s population. Despite their seemingly preposterous nature, the key point remains: with fertility rates remaining low,6 the state is entirely responsible for determining the scale of the Canadian population. Decisions about temporary visas and permanent residence serve as the primary levers of control. Policymakers must recognize that the choices made today will have profound and lasting effects on Canada’s demographic and economic future.
Population Projections and Their Implications
Statistics Canada produced a recent population projection for various scenarios in January 2025, covering the period of 2024 to 2074.7 Across the scenarios, total fertility rates range from 1.13 to 1.66, permanent immigration rates vary from 0.70 to 1.2 percent per year, and net temporary migration figures are assumed to decline in the short term before stabilizing. The selected scenarios suggest that the projected population of Canada would range from 45.2 to 80.8 million in 2074 – a difference of over 35 million people, roughly equivalent to Canada’s current population. The scale of infrastructure and social investments needed to accommodate such growth would be enormous.
Beyond sheer numbers, government policy also affects the age structure of Canada’s future population. The OADR is expected to rise, and increased immigration is often proposed as a solution. However, the retirement age is, to an important extent, a social construct and this paper explores the efficiency of changing Canada’s retirement age compared with adjusting immigration levels to address the issue.
While migration can temporarily mitigate low fertility effects by maintaining a larger workforce, it cannot fully offset population ageing (Robson and Mahboubi 2018). Even doubling Canada’s population through immigration would only reduce the average age by five years, as immigrants’ average age is close to that of the receiving population (around 30 versus 40).8 Doyle et al. (2023) argue that increasing immigration could delay ageing impacts but would require continuously higher volumes, becoming unsustainable.9 Immigrants are typically concentrated in the labour force ages (25-40) but, in 30-35 years, this group will be approaching retirement, creating an economic challenge similar to the Baby Boom generation’s retirement. Unless increasing rates of immigration are in place continuously (an unrealistic scenario), at some point society must adjust to a smaller, older population.
Moreover, there appear to be additional costs to rapid population growth that are driven by high immigration. Doyle et al. (2023 and 2024) contend that when the labour force expands faster than investment in capital and infrastructure, the result is a dilution of capital per worker, reducing Canada’s productivity and living standards. This concern highlights not only the pace of immigration-driven growth but also Canada’s historically low levels of business and infrastructure investment, suggesting a need to boost investment alongside population growth.10
Research shows that while larger immigration targets increase real GDP through a larger labour supply, they could also reduce GDP per capita (El-Assal and Fields 2018).11 Indeed, in recent years of very high population growth through net international migration (2022-2023), Canada’s level of real GDP per capita has been stagnant.12
Furthermore, house price escalation associated with a surge in demand may negatively affect fertility decisions, particularly for families renting homes (Dettling and Kearney 2014; Fazio et al. 2024). In other words, compensating for low fertility through high rates of immigration may indirectly contribute to additional fertility decline.
Studies show that immigration alone has a limited impact on altering age composition (Robson and Mahboubi 2018). Even doubling immigration rates would only slightly improve the OADR (Beaujot 2001). All of the immigrants admitted by Canada between 1951 and 2001, for example, are believed to have reduced the median age of Canadians in 2001 by only 0.8 years.
The effect of younger immigrants, as seen in Australia’s approach, would improve outcomes,13 but Guillemette and Robson (2006) found that this impact would still be modest. An unintended consequence of focusing on younger immigrants is that it contrasts with Canada’s economic selection system, which rewards human capital development. Half of the 2022 Express Entry applicants were 30 or older (IRCC 2022), challenging the idea that immigration could rapidly reduce the average age of the population.14
A Custom Glimpse of the Future
To update our understanding of the role immigration could play in Canada’s demography, this section explores the results of a special population projection, using Statistics Canada’s microsimulation model called Demosim, to assess the impact of varying immigration rates on the Canadian population in the future. Two demographic outcomes are highlighted in this analysis: population size and the OADR.
While population size is a straightforward measure, the exclusive focus on the OADR – without also considering the youth dependency ratio (YDR) – may raise questions about the completeness of the analysis. After all, both young and older people place disproportionate demands on social services. One could also argue that increasing the rate of immigration (depending on the age profile of newcomers, other things being equal) could reduce the OADR while increasing the YDR. There are two major reasons for focusing on the OADR in this analysis. First, it is the most widely used indicator of the ageing population and has particularly profound impacts on the cost of healthcare, Canada’s most expensive social program.15 Second, while the YDR and OADR reflect dependency burdens, they have very different long-term implications: a high YDR represents a short-term fiscal cost but also an investment in the future workforce. In contrast, a rising OADR signals a more permanent shift in the age structure of the population, with fewer economic offsets. For these reasons, and to maintain analytical clarity and focus, the YDR has been omitted from this analysis.
Demographic variables used in the projection, except for the immigration rate, were either held constant (e.g., fertility rate at the 2023 level of 1.33 and the temporary resident population assumed to remain constant at around two million after 2021) or based on assumptions from recent Statistics Canada projections (e.g., emigration rate, life expectancy).16 Using the 2021 base population,17 projections were provided for 50 years. Six scenarios were created based on annual permanent immigration rates ranging from 0.3 percent to 1.8 percent. These correspond to immigration levels in 2025 between around 125,000 and 750,000, based on the 2024 Q4 population estimate of 41.5 million. From 2000 to 2015, the immigration rate averaged 0.6 percent per year (Scenario 2), rising to nearly 1.2 percent per year by 2024 (Scenario 4). The 2025-2027 immigration plan aligns with Scenario 3, at a rate of around 0.9 percent. In essence, the scenarios reflect both current and recent immigration rates, allowing for expansion or contraction, as shown in Table 1.
Population projections vary significantly across the scenarios (Figure 1). As Canada’s natural population growth is rapidly approaching zero and is expected to turn negative in the coming years – and with emigration remaining steady – an immigration rate of 0.3 percent of the population would result in virtually no net international migration. Under this scenario, the population would begin to decline slightly. At the same time, Canada’s OADR would more than double, rising from 29.5 retirees (65 and older) per 100 working-age individuals (18-64) to 48.2 in 2046 and 61.6 in 2071 (Figure 2).18 Such a demographic structure would be unprecedented and pose a significant challenge to economic prosperity. For context, Japan currently has the highest OADR globally, at approximately 48 per 100.19
The second scenario, reflecting Canada’s immigration levels from 2000 to 2015, would add 4.6 million to the population by 2046 and another two million by 2071. The OADR would rise to 44.5 by 2046 and 55.8 in 2071. The third scenario most closely aligns with the 2025 to 2027 immigration plan (though it excludes the projected reduction in temporary residents). If immigration remains at 0.9 percent of the population for the next 50 years, the national population would reach 55.6 million in 2071, and the OADR would be 50.8. The fourth scenario extends the higher 1.2 percent immigration rate from 2024, projecting a population of 67.2 million by 2071. Despite this growth, the OADR would still rise to 46.5 by 2071 – similar to Japan’s current level. Reducing the immigration target from 1.2 percent to 0.9 percent in the 2025-27 plan would result in 11.6 million fewer people by 2071, assuming a stable rate. The sixth scenario, though ambitious, is instructive. If IRCC raised the permanent immigration target to 1.8 percent annually and maintained it for 50 years, Canada’s population would increase to nearly 62 million by 2046 and exceed 91 million by 2071. Even with this growth, the OADR would still rise to 39.5 by 2071. A visual scan of the relevant figure suggests that it would take an immigration rate of around 2.7 percent per year to hold the dependency ratio constant. Moreover, it would be challenging to sustain Canada’s high-human-capital selection threshold in the Express Entry system under this scenario.
Note another important trend. Figure 1 shows that the population diverges across the six scenarios over time, demonstrating the growing efficiency of immigration rates in changing Canada’s population growth over time. In contrast, the OADRs across the scenarios in Figure 2 remain roughly parallel after 2046 and begin to converge a little in the later years, illustrating that immigration ultimately becomes less efficient at altering the age structure of the population over time. Why? A population with low fertility receiving a steady flow of younger immigrants will, in the short term, have a younger average age due to the immigrants’ youth. However, as the immigrant population ages, its average age eventually surpasses that of the receiving population, making the overall population older in the long term.20 Therefore, the effect of steady immigration on the age structure diminishes over time, and only a continuous increase in immigration would prevent this.
Further, it is also important to acknowledge that once there is a sustained period of high immigration (i.e., the case of Canada between 2015 and 2024), a dramatic reduction in the rate of immigration will result in a demographic “bulge” with a large cohort followed immediately by a smaller one – akin to the relationship between the Baby Boom and Generation X. This would ultimately set in motion the same demographic dynamic that Canada faces today, with the larger generation eventually retiring and the OADR increasing. The demographic lesson is clear: shocks in the age structure of a population – whether through dramatic increases or declines in fertility or through major changes in the rate of net migration – place stress on infrastructure and, if they are large, may challenge the long-term stability of the welfare state.
Before reflecting further on these findings, consider the impact of varied immigration rates on the cultural composition of the Canadian population (Vézina et al. 2024). In 2021, approximately 44 percent of the Canadian population had an immigrant background – either as non-permanent residents, immigrants, or individuals with at least one immigrant parent (see Table 2). Under the third scenario, which aligns with the 2025 to 2027 immigration plan, this proportion would nearly reverse by 2046 and change even more dramatically by 2071, with nearly two-thirds of all Canadians being persons with an immigrant background.21
Such a shift would redefine immigrant integration and public perceptions of multiculturalism. Whether this level of cultural change would be widely accepted remains uncertain. If the high 2024 immigration rate was sustained, nearly three-quarters of Canadians in 2071 would be either immigrants or children of immigrants.
Immigration and Other Policy Levers in Addressing Population Ageing
This section assesses how immigration compares to other policy tools in addressing the demographic challenges of an ageing population. Governments have several policy tools to either shape demography directly or mitigate societal consequences. The key concern in an ageing society is the impact of a shrinking labour force on the ability to sustain social services such as healthcare, education, and pensions. The principal direct policies are encouraging fertility and increasing immigration (Lee 2014). Governments can also address the fiscal impact of ageing by: boosting workforce participation among working-age adults; delaying retirement and enlarging the working-age population; raising tax rates; reducing expenditures – especially those related to the elderly population; and increasing the productivity of labour (Lee et al. 2014; Beaujot 2017). Some of these choices are more efficient than others. Pronatalist policies have been established in some 60 countries, yet none have been successful in restoring fertility to a replacement level (UNFPA 2019). Moreover, their effects tend to be short-lived.22
How efficient is immigration in mitigating population ageing and its effects? The data explored so far indicate that while increasing the rate of immigration is highly effective at generating population growth, it is less effective at significantly changing the age composition of the population. A recent analysis by British Columbia Ministry of Advanced Education and Skills Training provides additional depth on this issue.23 Their study presents a simple but informative labour force participation ratio: for every 10 permanent immigrants admitted to the province, six will find work relatively quickly, while the remaining four will be too young or old, pursuing education, or not immediately ready to join the labour market. This reflects the broader reality that approximately half of all economic-class immigrants are spouses and dependents and that only around 60 percent of immigrants are admitted through the economic class to begin with.
It would be tempting, but also simplistic, to see this as the direct impact of immigration on the labour force (i.e., 10 newcomers equate to six net new workers), but there is an important additional dimension that must be considered. Adding 10 people to the population generates consumer demand for goods and services including shelter, food, transportation, and many other things. Meeting this demand requires four additional workers. These four additional workers expand the scale of the economy but do not create net new workers (Fortin 2025).
When 10 newcomers are admitted, given that four will not immediately enter the labour force and another four workers will be required to satisfy extra consumer demand, only two net new workers are added. That is, to add one net new worker to the labour force requires five new permanent immigrants (and therefore approximately two additional dwellings). This is nicely summarized in a ratio: 10-6-4-2. There is no reason to expect that this ratio would be appreciably different in other provinces or Canada as a whole. Just as immigration is more efficient at increasing the size of the population than it is at changing the age structure, the same holds true for the relationship between immigration and net workers added to the labour force.
An example can help illustrate this point. Imagine an ageing society with a population of one million and 1,000 doctors. As more doctors retire than can be replaced through domestic training, the government looks to immigration to fill the gap. It estimates that 100,000 newcomers must be admitted, since only a small fraction of new immigrants will be doctors. This produces the desired effect, and the number of doctors remains stable. However, the population has grown to 1.1 million, and to preserve the same level of access to care, 1,100 doctors are now required. Simply stabilizing the labour force while adding population is an insufficient way to resolve emerging labour shortages because it ignores the additional demand created by population growth (Fortin 2025). This mirrors the earlier point: immigration adds workers, but it also adds consumers. As a result, the net gain to the labour force is much smaller than the headline number of newcomers might suggest.
It is beyond the scope of this paper to investigate the efficiency of all the other measures in mitigating the effects of ageing or increasing the size of the labour force. However, Figure 3 illustrates the demographic impact of one such lever – delaying the average retirement age to 70, compared to maintaining it at 65 – as an example to demonstrate how different policies vary in their ability to influence the OADR.
Figure 3 shows that, under this policy shift, maintaining immigration at the rate of the 2025 to 2027 plan (Scenario 3) would be sufficient to stabilize the OADR to 2046 – keeping it just below 30, similar to its level in 2021. None of the immigration scenarios alone achieve this outcome if the retirement age stays at 65. While the OADR increases over time in all scenarios, delaying retirement significantly slows both the pace and magnitude of this rise.24 However, the purpose of this example is not to propose a specific change. Instead, it highlights the relative effectiveness of this particular lever and emphasizes the need for a multifaceted strategy to address demographic challenges.
In summary, Canada’s demographic challenges stem from low fertility and the retirement of the Baby Boom generation. Immigration can delay and mitigate the effects of ageing but cannot fully counteract them without immediate and dramatic increases. As long as immigration remains within historical levels, ensuring a sufficient workforce will require a combination of immigration and complementary policies.25
Demography and Levels Planning
The policy dilemma implied by demographic realities is both straightforward and immensely complex: it is now impossible to maintain the age composition of the Canadian population while also maintaining its size without turning back the clock more than 50 years in terms of fertility. At the extremes, there are two stark policy choices: maintain the current size of the Canadian population but adjust expectations to accommodate a vastly higher OADR (approximately that of Scenario 1); or maintain the age structure of the Canadian population and plan for a vastly larger population (larger than any projected in the scenarios used in this study). The real policy choice will lie somewhere between these extremes and will require a combination of accommodations.
Table 3 summarizes more realistic options by showing the level of population increase and the different OADRs projected for 25 and 50 years forward. It compares the scenarios that most closely approximate Canada’s permanent immigration targets for the recent past – Scenario 2 (pre-2015 consensus), Scenario 4 (2024 rate), and Scenario 3 (2025 to 2027 plan). Had the Liberal government maintained the earlier rate of immigration after 2015 (that is, maintaining the 0.6 percent rate of immigration), Canada’s population would have grown by around 7.5 million by 2071, but with an OADR higher than any country today (55.8 senior citizens per 100 working-age people). By shifting to, and maintaining, a 1.2 percent annual immigration rate between 2015 and 2024, the population would grow much faster – by 29 million more people over half a century – while the OADR would be lower, at 46.5 per 100. Notice that the change in policy would lead to nearly four times the population growth compared to the reduction in the OADR, which improves by only 17 percent. Scaling back the rate of permanent immigration in 2025 to 2027 moderates both the population increase and the OADR improvement. Nevertheless, it would still yield a population growth of over 17 million in the next 50 years, with Canada’s OADR surpassing that of contemporary Japan.
Regardless of the choice being made, Canada will be both larger and older in the coming decades. This shift has significant implications and calls for strategic long-term planning. For example, the country will need to invest simultaneously in child benefits and new schools, as well as in elder care facilities. Housing demand will continue to mount unless significant changes occur in housing investment policies and outcomes. It also means investing in infrastructure to sustain key public services – such as increasing hospital capacity and expanding public transit. Without these adjustments, the quality of life for Canadians would decline. Crucially, this must occur while public finances are adjusted in light of a rising OADR (or the retirement age is raised).26 It also necessitates a continuing cultural diversification of the population through immigration and temporary migration. Ongoing and growing investments in social inclusion will be required.
The greatest challenge for government is to decide on the optimum balance between ageing and growth while securing public buy-in for immigration policies.27 All of this must occur against the backdrop of other pressing issues such as global climate change, geopolitical instability, technological change, and political polarization – not to mention the need to be mindful of the relationship between immigration, ethnocultural diversity, linguistic and religious groups, Indigenous Peoples, and other equity-seeking groups. Assiduous attention must be paid to Canada’s demographic challenge, despite these powerful intersecting concerns.
Consider financial investment, where growth is based on compounded rates of interest. One of the most common recommendations made by financial advisors is to harness the power of compounded growth by starting to invest early in one’s life. Even small amounts invested in one’s twenties can pay remarkable dividends forty years later. The same logic applies to population management; demographic choices today will have far-reaching consequences in subsequent decades. Adding four to five million to Canada’s population over the next decade cannot simply be undone at the end of that period. The same ageing pressures will remain, but with a larger population that may require even higher immigration levels. As long as fertility remains well below replacement, this issue will persist – regardless of Canada’s population size. There will always be the looming threat of population decline and its consequences.
Short and Long Policy Horizons
Population change is cumulative and difficult to reverse, making it imperative to consider the long-term implications of both temporary and permanent immigration together. This requires viewing them as components of the same system – particularly given the many pathways that allow temporary residents to transition to permanent status, and the increasing reliance on temporary residents within Canada’s permanent immigration system (Crossman et al. 2020). In recent years, temporary migration has increasingly become a kind of “down payment” to Canada’s permanent immigration system, a shift that has transformed Canada’s immigration system into a more fluid, two-step process, although this flow-through process may be interrupted given the latest levels plan (i.e., there is a large gap between the number of temporary residents in Canada and the “room” accorded to that population in the new plan). A comprehensive approach also demands that levels plans, which currently establish expectations for a three-year period, be developed with longer time horizons in mind.28 In other words, immigration levels should reflect Canada’s immediate priorities as well as its long-term goals, including the potential for future population renewal. The focus on present needs should not overshadow a forward-looking vision for the country, as current policies play a decisive role in shaping Canada’s future.29
A common point made in public discussion of Canadian immigration policy is that levels planning should pay more attention to absorptive capacity. This means aligning the number of both temporary and permanent residents with the growth of social services – notably education and healthcare – as well as housing and other infrastructure. The concept of absorptive capacity can be interpreted in passive or active terms. Under a passive approach, levels planning would be guided by the current state of social services and infrastructure including housing, which would determine the appropriate level of immigration (e.g., based on an acceptable range of physicians, housing completions, etc., per 1,000 persons). Conversely, an active approach would flip the direction of causality and establish the parameters of social spending and infrastructural investment based on population growth which, in an era of low fertility, is essentially a function of the scale of temporary and permanent immigration. In this latter situation, IRCC would play a more central role in national planning, as immigration targets would shape the long-term scale of government spending across a wide range of responsibilities. This process would be greatly facilitated by a conscious, long-term population strategy at the heart of levels planning. In such a framework, all sectors of society – government, private business, and non-profit social services – could make informed decisions to guide their investments with far more assurance of long-term patterns of demand. This would be a potent indirect benefit of a population-based approach to migration and immigration management.
There are important tradeoffs between these approaches. A passive approach may be more cautious and politically feasible in the short term, but risks underestimating long-term needs and perpetuating reactive policymaking. An active approach, by contrast, allows for proactive investment and planning – but only if there is full follow-through. If governments commit to population growth targets without ensuring that social and physical infrastructure keep pace, the result could be increased strain on housing, healthcare, and public trust.
While this paper supports an active approach, its core aim is to push for long-term thinking and to encourage an informed public conversation about the choices ahead.
Regardless of which approach is chosen, the issue of social license is key. As noted earlier, a majority of Canadians have recently come to believe that population growth generated by immigration has outstripped the development of social and physical infrastructure. In 2023, this growing perception led to a substantial shift in public support for the number of newcomers that were being admitted. The government must ensure that population growth, infrastructure capacity, and capital investment are aligned – and clearly communicated to the public. This means developing a population strategy alongside an economic strategy. These are not competing priorities, but complementary and mutually reinforcing goals.
Conclusion
Given its low fertility, Canada’s demographic and economic future would be bleak in the absence of immigration. Even under low immigration scenarios (0.3 and 0.6 percent of the population per year), Canada would enter uncharted territory with respect to its OADR. At the same time, immigration is more efficient at increasing the population size than it is at either adding net new workers to the economy or fundamentally altering the age structure of the population. Higher rates of immigration may address short-term labour shortages, provide important skills, and stimulate economic activity (a higher GDP), but their effect on prosperity (GDP per capita) depends on whether they are accompanied by robust productivity growth, capital investment, and innovation. Moreover, they present challenges to Canada’s infrastructure, particularly in housing supply and healthcare availability. Without such complementary investments, rapid population growth could lead to a population trap – where population growth outpaces investment capacity – ultimately lowering prosperity, and potentially worsening fertility rates.
Canada’s demographic future depends on policy decisions made today, which carry long-term consequences that require careful planning and adaptation. While immigration level planning includes multi-year targets and considers a range of factors, in practice it often focuses on managing short-term pressures rather than shaping a long-term population vision. With fertility rates at historic lows, Canada’s reliance on immigration for population growth is intensifying. While immigration is a relevant tool for mitigating population ageing, it cannot prevent Canada from ageing on its own. This impasse highlights the need for a comprehensive population strategy that aligns with a long-term economic strategy – recognizing that growth and economic planning are complementary, not competing, goals. The strategy must also balance population growth with the challenges of an ageing society and address social priorities, including ethnocultural diversity and inclusion, Canada’s linguistic landscape, and Indigenous reconciliation.
A sustainable path forward must integrate immigration with policies to boost workforce participation, promote productivity, incentivize capital investment, and consider measures such as delayed retirement, all while recognizing the potential social and economic trade-offs involved. Without a clear and proactive strategy, Canada risks mounting economic and social pressures. A well-managed, long-term population plan, grounded in both economic realities and social capacity, will be essential to maintaining prosperity and ensuring that growth benefits all Canadians. For The Silo, Daniel Hiebert -Emeritus Professor of Geography at the University of British Columbia.
References
Adcerà, Alicia, and Ana Ferrer. 2013. “The Fertility of Recent Immigrants to Canada.” IZA Discussion Paper Series 7289: 1-21. https://docs.iza.org/dp7289.pdf.
___________. 2017. “Canada: The case for stable population with moderately low fertility and modest immigration.” Canadian Studies in Population 44(3-4): 185-190.
Dettling, Lisa J., and Melissa Schettini Kearney. 2014. “House prices and birth rates: The impact of the real estate market on the decision to have a baby.” Journal of Public Economics 110(c): 82-100. https://ideas.repec.org/a/eee/pubeco/v110y2014icp82-100.html.
Dion, Patrice, Éric Caron-Malenfant, Chantal Grondin, and Dominic Grenier. 2015. “Long-Term Contribution of Immigration to Population Renewal in Canada: A Simulation.” Population and Development Review 41(1): 109-126. https://doi.org/10.1111/j.1728-4457.2015.00028.x.
Dungan, Peter, Tony Fang, Morley Gunderson, and Steve Murphy. 2023. “Macroeconomic Impacts of Immigration in the Canadian Atlantic Region: An Empirical Analysis Using the Focus Model.” IZA Institute of Labor Economics 16527: 1-25. https://docs.iza.org/dp16527.pdf
Fazio, Dimas, Tarun Ramadorai, Janis Skrastins, and Bernardus Ferdinandus Nazar Van Doornik. 2024. “Housing and Fertility.” SSRN Electronic Journal. https://dx.doi.org/10.2139/ssrn.5046571.
Fortin, Pierre. 2025. The Immigration Paradox: How an Influx of Newcomers Has Led to Labour Shortages. Commentary 677. Toronto: C.D. Howe Institute. February.
Laplante, Benoît. 2018. “The Wellbeing of Families in Canada’s Future.” Canadian Studies in Population 45(1-2): 24-32. https://doi.org/10.25336/csp29376.
Lee, Ronald D. 2014. “Macroeconomic Consequences of Population Aging in the United States: Overview of a National Academy Report.” American Economic Review 104(5): 234-239. https://www.aeaweb.org/articles?id=10.1257/aer.104.5.234.
Lee, Ronald, et al. 2014. “Is low fertility really a problem? Population aging, dependency, and consumption.” Science 346(6206): 229-234. https://doi.org/10.1126/science.1250542.
Montcho, Gilbert, Julien Navaux, Marcel Mérette, and Yves Carrière. 2021. “Comparing Public Transfers between Immigrants and Natives: A National Transfer Accounts Approach.” SSRN Electronic Journal. https://ssrn.com/abstract=3968396.
Romaniuk, Antole. 2017. “Stationary population, immigration, social cohesion, and national identity: What are the links and the policy implications? With special attention to Canada, a demographer’s point of view.” Canadian Studies in Population 44(3-4): 165-178. https://journals.library.ualberta.ca/csp/index.php/csp/article/view/29290.
Smith, Philip. 2024. “Accounting for the decline in Canada’s Real GDP Per Capita since Mid-2022.” International Productivity Monitor 46: 83-100. https://www.csls.ca/ipm/46/IPM_46_Smith.pdf.
Zhang, Haozhen, Jianwei Zhong, and Cédric de Chardon. 2020. “Immigrants’ net direct fiscal contribution: How does it change over their lifetime?” Canadian Journal of Economics/Revue canadienne d’économique 53(4): 1642-1662. https://doi.org/10.1111/caje.12477.
Hello AI Tinkerers and welcome to the latest Sci-Tech article here at The Silo. Get ready, You will want to pay attention because the spotlight is on this Dude because he knows how to get around ‘bad ai prompting’. Just recently, he has helped spin out 40 startups using one core skill. Can you guess which one? Yep. Prompting.
In the One-Shot video below, Kevin Leneway breaks down his real workflow for shipping AI products fast — using markdown checklists, agent coding, rubric-based UI design, and zero Figma.
“I don’t need Figma. I just prompt my way to a working front end.” — Kevin Leneway
While most people are still asking ChatGPT to write code snippets, Kevin is building full-stack products using nothing but prompts. In this One-Shot episode, he reveals the exact system he’s used to launch over 40 startups at Pioneer Square Labs. We break down:
How he writes BRDs and PRDs that don’t suck
Why vibe coding fails and how to actually use AI agents
The markdown checklist that replaces a product team
How to go from idea to working app with zero context switching
His open-source starter kit that makes Cursor and Claude 3.5 feel like magic
“I’ve helped launch six startups including Singlefile (singlefile.io, $24M raised), Recurrent (recurrentauto.com, $24M raised), Joon (joon.com, $9.5M raised), Gradient (gradient.io, $3.5M raised), Genba (genba.ai, acquired May 2022) and Enzzo (enzzo.ai, $3M raised).”
If you’re a builder, this will change how you work. No gimmicks. Just a ruthless focus on speed, clarity, and shipping. Watch now. Learn the system. Steal it. For the Silo, Joe at aitinkerers.org
It’s hard to believe it’s been almost fifteen years since I did some work recording for Statistics Canada. The job required door-to-door visits to all the homes in a designated area, interesting because I had a chance to see what people do in their yards. One residence in particular left a strong impression on me and it continues to resonate now in 2025 all these years later.
It was a beautiful home, probably 40 years old, on a fairly large estate.
The lawns were nicely manicured and the architectural evergreens were tastefully placed. It looked like a photo in a 1970’s Better Homes and Gardens.
This architectural sketch of a late 1970’s “Dream Green Home” at least shows a bit of “greenery” and a tree. image: public domain
But as I walked to the front door, I realized that there was no movement.
Nothing swayed in the afternoon breeze. There were no herbaceous plants, no flowers, and worse, no bees, no butterflies, no birds. This place had as little movement as my imaginary magazine photo. It struck me as being uninteresting and unnatural. Land without life.
In my experience we show ourselves at our best when we interact and connect with nature and even find a kind of fulfillment in it. This completion has been lost for many of us, but paradise can be regained at any time.
There are all kinds of small ways to re-connect and to bring restoration, not just to the land, but to ourselves as well. I encourage everyone to put in a garden of some kind. A vegetable garden is of course the most practical and immediately useful. Start small and easy if you have never had a garden before.
If the practicality of a vegetable garden isn’t appealing, then plant something in to nourish your soul.
‘Miss Ruby’ Butterfly Bush-Buddleia image: www.green-living-made-easy.comRick’s home butterfly garden photo: M. Larmand
A couple of years ago I put in a no-maintenance garden specifically to attract hummingbirds. The thank-you’s come at dusk when increasing numbers of my little buddies do their end-of-day rounds. Scarlet runner beans, red monarda, salvia, tithonia, and crocosmia – they did the trick.
And copying the garden of a friend , I have also put in a small butterfly garden.
Milkweed, Echinacea, and butterfly bush (Buddleia) are good starter plants. I’m doing my small part to help save the monarch butterfly population. The nice thing about both these gardens is that they require almost no attention, just observation and enjoyment.
I’ve often thought about theme gardens. “There’s rosemary, that’s for remembrance…” Ophelia’s mad scene in Hamlet is a great starting point for a Shakespearean garden and a study of plant symbolism in literature. A biblical garden would also be an interesting exercise, though the plants themselves would be local approximations of Mediterranean species but the life lessons would be endless. Consider the lilies of the field. What about a cutting garden, a scented garden, a night garden?
Poets and painters have found inspiration in gardens. Like them, let nature take your breath away. Start small. To quote the American poet, Emily Dickinson:
To make a prairie it takes a clover and one bee. One clover, and a bee. And reverie. The reverie alone will do, If bees are few.
It doesn’t take much to make a prairie – or your own personal sanctuary.For the Silo, Rick Posavad.
Our usual milsurp article is a bit different this time around- a little less about gear in the typical sense and more about the introduction of a side project our friends at kommandostore.com have been working on for months:The long-awaited return of EDC “Range Notes”, now better than ever in any weather. It might be nearing the end of April but let’s face it rainy weather never really goes away and if you are planning on an outdoor adventure the odds are you will need to plan for the possibility of getting wet.
Why this makes sense
Maybe you are a writer or a journaling die hard or the sort of person that likes to jot things down while they are outside. Perhaps the elements stir something and help fuel your creativity. I get it. There may be waterproof smartphone screens out there but nothing beats the mind-thought-write -it-down connection between good old fashioned paper and pencil (or pen).
KommandoNotes V2 have arrived!
Do you need to write in the rain? Or when you’re covered in warm, viscous liquids, preferably non-human in origin? Look no further than KommandoNotes waterproof range notes! Seriously, DON’T KEEP LOOKING. With ten times the autism and twice the schizo-posting capacity (double the pages!) of comparable field notes, you can record far more information than anyone needed or wanted no matter where you go, and it’ll survive the sweaty, unventilated confines of your flecktarn (check out my quick review of one of my favs here)parka pocket.
The binding is a heavy-duty spiral that lets pages flip easily, even with gloves on, and the cover is a thick, weather-resistant plastic printed with our sharply honed autism. Each notebook measures 4.75″ x 7″, with gridded pages for precision mapping or quick notes. This lightweight notebook is light enough to toss in your pack and sturdy enough to take endless beatings. Whether you’re scoping out land to squat or tracking recalcitrant livestock, KommandoNotes keep your data dry and legible (if you write legibly–that’s really on you).
Specs
Weather-resistant coated paper with plastic “pretty much everything-proof” cover
4.75″ x 7″ (12 x 18 cm for non-moon visiting nations)
64 sheets (128 pages)
Land Navigation & Military Grid Reference System Cheat Sheet by Redbeard Tactical
Spiral bound
Ruler edge, land nav guide, and compass rose for orientation and measurements
Available in “A Magical Place,” STALKER, and Cashel Valley Bean Man designs
Encouraging children to participate in physical activity can have a significant impact on their health, mental well-being, and social skills. As parents, guardians, and mentors, it’s vital to provide support that not only helps young athletes excel but also aids in their overall development.
Below we are going to discuss some effective strategies to inspire your child to thrive at their favorite sport. Let’s begin!
Foster a Love for the Game
One of the most important aspects of supporting youth athletes is helping them develop a genuine love for their sport. Encourage exploration by introducing them to various activities and attending local games/tournaments together.
It’s also crucial to discuss the positive aspects of sports, such as teamwork, discipline, and the joy of participating (rather than focusing on winning). When children enjoy the process, they are more likely to remain committed and motivated.
Emphasize the Importance of Practice
Practice is key to improvement. Encourage your child to dedicate time to honing skills outside of regular team practices. You may want to create a routine that includes a mix of skill-building, drills, and casual play.
For children who are showing a keen interest, consider signing them up for various training programs and camps. These not only help improve their skills but also allow them to form relationships with like-minded individuals.
Searching for Basketball Clubs Edmonton? Youth Hoops is an excellent choice to kickstart their personal development journey.
Model a Positive Attitude
Children often look to their parents and mentors for guidance on how to approach challenges. By modeling a positive attitude towards sports and competition, you can instill a growth mindset in your child.
Encourage them to view setbacks as opportunities for learning rather than failures. You should also share your own experiences, highlighting the importance of determination. Your enthusiasm can inspire them to adopt a similar approach to their athletic endeavors.
Promote a Balanced Lifestyle
While sports are important, it’s crucial to promote a balanced lifestyle that includes academics, social interactions, and relaxation. You want your child to not just excel in athletics but also in their studies and other interests.
Help them manage their time effectively to balance practice, homework, and leisure. A well-rounded lifestyle contributes to overall well-being and prevents burnout.
Set Realistic Goals
Lastly, setting goals is essential for any young athlete, but it’s also important to ensure they are realistic and attainable. Help your child establish both short-term and long-term objectives, such as improving their skills, making a team, or achieving a personal best.
Break these goals down into smaller, more manageable steps to maintain motivation and track progress. This approach helps build resilience and teaches children the value of perseverance and hard work.
Final Words
As you can see, supporting young athletes involves many different steps. By implementing the strategies above, you can inspire your child to thrive in sports while helping them develop valuable life skills that will benefit them both on and off the field.
The Butchart Gardens, Canada, is the seventh most beautiful spring flower spot in the world, according to a new study.
#7 worldwide- Butchart Gardens, Victoria, British Columbia.
With springtime (seemingly- it is Canada after all) here, there are beautiful gardens all around the world filled with flowers getting ready to bloom. But which of these spots deserve a place on your travel bucket list?
Looking at flower locations across the globe, our friends and experts at Japan Rail Pass analyzed a variety of factors – including Google reviews and ratings, Instagram hashtags, and the vibrancy of the flowers in spring – to give an overall score and determine which flower spots you absolutely should not miss this spring.
The most beautiful spring flower spots around the world
According to the research, the most beautiful flower spot in the world is the Keukenhof Tulip Gardens of Lisse, Netherlands, which has exhibited spring flowers to the public since 1950.
The tulips in spring achieve an almost perfect vibrancy score of 9.96/10, proving just how bright and colourful these stunning gardens are.
Shinjuku Gyoen, Tokyo, Japan – 9.3/10
Credit – Sutterstock_Benny Marty
Next in the rankings, is the beautiful Shinjuku Gyoen in Tokyo, Japan. From the wide variety of cherry blossoms in the national garden, it is the Somei (Yoshino cherry) that bloom in spring.
The beautiful Japanese garden has over 856,000 Instagram hashtags, more than any other spot in the top 10, with people all over the world travelling to view the cherry blossoms.
Royal Botanic Gardens, Kew, London, UK – 9.2/10
Credit – Sutterstock_Charles Bowman
The third most beautiful spring flower spot according to the study is in London, England: The Royal Botanic Gardens, Kew.
With almost as many Instagram hashtags as Shinjuku Gyoen (764,996) and 44,465 reviews, it is clear that the flowers found here,cherry blossom, bluebells, and magnolias to name a few, are beloved by many.
Nabana no Sato, Mie, Japan – 9.0/10
Credit – Sutterstock_martinho Smart
In fourth place is the Nabana no Sato flower park, located in the Nagashima resort in Mie, Japan.
The spot is known for its illuminations throughout the park in winter through to spring, as well as the blooming cherry blossoms and tulips which scored a 9.34/10 for vibrancy in the study.
Dubai Miracle Garden, UAE – 8.9/10
Credit – Sutterstock_Sergii Figurnyi
The fifth most beautiful spring flower spot in the study was found to be the Dubai Miracle Garden in the United Arab Emirates, which occupies over 72,000 square metres, making it the largest natural flower garden in the world.
With over 75,000 reviews since its opening in 2013, and a vibrancy score of 8.78/10, it is clear that this impressive garden deserves its place in the top five rankings.
Methodology:
1. Japan Rail Pass wanted to find out which are the best flower spots around the world to see in Spring.
2. To do this they collected data on 25 popular flower locations around the world including the following variables:
Google ratings and reviews.
Instagram hashtags (using all relevant hashtags including where applicable local language versions)
This post is a response to the comic book article found at popuniverse which begins like this:
“The comic book industry is the launchpad for one of the most unique and innovative storytelling mediums ever created. Powered by imaginative creators highly skilled in the written and visual arts. Forged by businesspersons who recognize the power of ideas to make an iconic impression on a global scale. Propelled by readers and fans who support the industry and the people who make the stories. The comic book industry is the source of multimedia interpretations of mythic and personal stories that inspire people, entertain the world, and ignite lifelong careers.
It is the adventure of a lifetime.
The comic book industry is a ruthless Darwinian landscape of cronyism, narcissism, and power moves. Its main fodder is the creators who are the engines of its continued existence. Full of flair and pomp, colors and characters both fictional and real-life. A road to hell paved with landmines, bear traps, and the opportunity to work on high-profile, profitable media while living on the precipice of poverty. The industry is fueled by organizations with finite funds and infinite hubris.“
“The comics industry is the illusory world of grenades disguised as dreams.“
The issue I see (and our comic illustrator household has personally experienced) in the comics and illustration / publishing industry is that the original contract terms were never set up fairly to compensate the artists and illustrators. While photographers and videographers retain the rights to their original images, and someone must pay them usage rights fees based on the size of the audience per usage, the artists are never granted that same fair compensation.
While actors get residuals when their TV shows play on in perpetuity, and musicians earn their royalty checks with every needle drop, the comics publishers can repurpose an illustrator’s iconic cover art in perpetuity and make millions from the image—on puzzles, lunch boxes, hoodies, sweatpants, and pajamas in my husband’s particular case—while the artist never sees a dime beyond the initial ANEMIC work-for-hire fee in these insanely unfair, one-sided deals. And if the artist DARES to complain? The smear merchants are only too happy to start their whisper campaigns, blackballing the artist as “too difficult to work with” and completely destroying their already financially challenged lives with nuisance law suits.
When I think back on how Ghost Rider co-creator Gary Friedrich was made the industry scarecrow in the last years of his life as greedy lawyers descended upon him like buzzards picking the last flecks of flesh from his bones, it sickens me.
This impoverished, unwell, elderly man was just trying to eke out the last days of his hard-scrabble life by selling sketches of his OWN co-creation at comic-cons. There’s nothing I despise more than anyone preying on the vulnerable. It’s appalling how Gary was treated.
And then we have AI “art” apps exploiting my husband’s already way underpaid art to create new, derivative works, but only GETTY Images can afford to lawyer up and go after these apps…because the photography world always negotiated image usage the CORRECT and fair way from the start.
The sobering truth is that if illustrators (and line artists, colorists, and letterers) were paid as well as photographers, every comic would sell for $100 per floppy and that would be the final nail in the #comics industry’s coffin.
…DAVE DORMAN… told me at dinner tonight that someone was selling AI art at SDCC last week and was summarily kicked out of Artists Alley. It gave me a brief glimmer of hope…I imagined a deafening crescendo of cheering as the non-talent skulked away, tail between his/her legs. That takes some gall to occupy the highly competitive table space of an ACTUAL hard-working artist (who’s paying off about $100k in art school student loans) with some Mid-Journey derivative crap. Wowzers. For the Silo, Denise Dorman.
French scientists have discovered one of the following wines offers up to 10X more cancer-protective and cardio-protective effects than the rest…
Plus, this one wine also supports significantly improved metabolism when you drink it a certain way.
But which one? Is it…
(Click on the wine image you think is right.)
HINT – Researchers point to one wine above to explain the French Paradox. So, if you want to be lean AND still drink wine, it should definitely be THIS.
A whole generation of Americans (and Canadians!) grew up staring out of their high school class windows and imagining invading Soviet paratroopers landing outside. Many of them (a few decades older and wiser) are reliving the past through interesting throwback fashion choices and in extreme cases- full on cosplay.
If you have always wanted a Calumet High Varsity jacket or one of those cool Russian camo coats that the Wolverines eventually commandeer and rebelliously wear as their own- our friends at kommandostore.com have some good news for you.
But first here is a mini-review written waaaay back in 2002 that does a good job of explaining the believable paranoia vibe of Red Dawn.
“Someone else before me wrote that a lot of people don’t understand how believable this movie was in it’s day. I have to agree with the author. I remember this movie as being pretty scary and pretty violent. I haven’t seen it in a while but there’s a lot of scenes that haunt me. One in particular is when several of the kids look for their parents at a concentration camp. Harry Dean Stanton gives a powerful performance that serves to show that he’s a genuine actor. That scene is heartbreaking, as well as a scene that follows with Patrick Swayze breaking down in the snow covered woods. C. Thomas Howell vs. the helicopter. The ritual of the deer blood. Powers Boothe. The final battle and resolution. Yeah, it’s a little much and these days, it wouldn’t exactly fly but dammit Jim, I dug it at the time and I still do. I think everyone should see it, just so you can either remember or learn what it was like to live in a time when the general thinking was a little paranoid. I think the movie manages to capture at least that, being what it is, a paranoid fantasy of someone who probably has a huge gun collection in his concrete reinforced cellar.” Mr. Parker via imbd.com
The Bad Guy Look
The Good Guy Look. Well one of them anyway.
Now if only we could find that 1977 Chevy Cheyenne Cayenne step-side that Jed drove the hell out of escaping those pesky Russkies.
Fun Facts from the Movie via imdb
Five of the 36 paratroopers in the beginning of the film got blown as much as a mile off-course during filming. One got stuck in a tree, and had to convince locals that he wasn’t really an enemy soldier.
C. Thomas Howell had been a rodeo cowboy. He helped teach the rest of the cast to ride horses.
The plot, a Soviet and Cuban invasion from Mexico, was based on C.I.A. and War College studies of U.S. weaknesses at the time.
Patrick Swayze got frostbite during filming. A few years later, he said it still felt like someone shoving toothpicks up his fingernails when he got too cold.
The film contains no computer graphics effects, chroma key composites, or miniatures. All of the explosions are real, and actual size.
The film made the Guinness Book of Records for the most acts of violence in any film up to that time. According to their calculations, 135 acts of violence occur per hour, or 2.23 per minute.
The actors trained using real weapons so that they wouldn’t make mistakes using the prop ones. Lea Thompson recalled, “We went to a firing range and there was every kind of gun you could imagine.”
The cast underwent an intensive eight-week military training course before filming started.
Lea Thompson said that this is the best time she’s ever had on a movie.
Real Green Berets helped with the actors’ boot camp training.
William Smith didn’t receive any special language training for his role. Thanks to years of military service, and work with the C.I.A. and N.S.A., Smith was already fluent in Russian and several other languages.
Patrick Swayze stayed in character throughout filming. He said, “I became Jed Eckert.”
The story was originally to be set in the real town of Calumet, Michigan. It was moved to a fictionalized version of Calumet, Colorado. It was a more central location within the United States, which better fit the story. In real life, Calumet, Colorado is a tiny former mining town abandoned in the 1970s.
“Red Dawn” was the code name for the military operation that captured Saddam Hussein on December 13, 2003. Writer and director John Milius felt honored by that.
The original trailer, on the LaserDisc release, includes a scene in which a tank rolls up to a McDonald’s where enemy soldiers are eating. The scene did not appear in the final cut, and was likely removed due to a mass shooting at a McDonald’s in San Ysidro, California, a few weeks before the film opened.
This was the first film released with a MPAA PG-13 rating, on August 10, 1984. The Flamingo Kid (1984), the first film to get a PG-13 rating, sat on the shelves for five months before release.
Two C.I.A. agents came to the set, investigating reports of Russian tanks in the area. They were relieved to hear the tanks were for a movie.
A more involved love story between Jed and Toni was cut because Patrick Swayze didn’t feel it would work in the context of the film’s plot. Swayze and Jennifer Grey later appeared in Dirty Dancing (1987).
As it got colder, the actors and actresses had to adapt to freezing temperatures, often well below 0°F (-17.7°C).
This movie was initially banned in Finland due to excessive violence, disagreements with Finland’s foreign policy, and being “too anti-Soviet.” It was eventually released on video there.
While generative AI transforms how Americans shop, it’s also quietly powering a counterfeit crisis now spiraling out of control. A groundbreaking new report from Red Points and OnePoll, The Counterfeit Buyer Teardown, reveals that AI is no longer just helping consumers find the best deals—it’s helping them find fakes. From influencer-driven “dupe culture” to hyper-realistic fake storefronts, the study exposes a booming underground economy that’s been supercharged by technology. With 28% of counterfeit buyers now using AI tools to seek out knock-offs, and fraudulent social media ads spiking 179% in just one year, the findings deliver a wake-up call for brands, regulators, and shoppers alike. Red Points execs are available to break down the data, discuss solutions, and explain why this rapidly evolving trend is both a technological and ethical crisis for the digital marketplace. Interest here as we hope?
AI Supercharging U.S.and Other E-Commerce Counterfeit Crisis
An explosive new report, “The Counterfeit Buyer Teardown, ” paints a concerning picture of a rapidly evolving and increasingly sophisticated counterfeit goods market, driven by a new factor: Artificial Intelligence. Forget the back alleys; findings from the research—conducted by market research firm OnePoll and AI company Red Points in February 2025—highlight that the future of fakes is digital, AI-assisted, and alarmingly mainstream.
The convergence of technology, social media, and shifting consumer mindsets is reshaping e-commerce—and not always for the better. As AI accelerates both the spread and appeal of counterfeit goods, the challenge is no longer just spotting fakes—it’s confronting a counterfeit economy that’s growing smarter, faster, and harder to contain.
“As counterfeiters adopt advanced tools like AI, the fight against fakes is becoming more complex and more urgent,” said Laura Urquizu, CEO & President of Red Points. “We’re now seeing AI shape both the threat and the solution. In 2024 alone, our firm detected 4.3 million counterfeit infringements online—an alarming 15% increase year-over-year.”
Alarming indeed. Here are 5 key revelations from the study.
1. AI is the New Enabler of Counterfeiting – A Two-Sided Threat:
The Counterfeiters’ Edge: AI is dramatically lowering the barrier to entry for bad actors. They can now mimic brand listings, and impersonate social media accounts with unprecedented ease and speed. They can also effortlessly create professional-looking fake websites—a situation that, according to Red Points’ data, is projected to surge 70% in 2025.This isn’t just about cheap knock-offs anymore; it’s about sophisticated deception at scale.
The Consumers’ Assistant: Shockingly, 28% of online shoppers who bought fake goods used AI tools to find them. This isn’t a fringe behavior; it’s a growing trend, especially among Gen X, suggesting consumers are actively leveraging AI in their pursuit of cheaper alternatives. This fundamentally shifts the narrative – it’s not just about being tricked; some are actively seeking fakes with AI’s help.
2. Accidental Counterfeiting is a Major Problem – Trust Signals are Being Hijacked:
1 in 4 luxury counterfeit purchases are unintentional. This shatters the perception that buyers knowingly seek out high-end fakes. Realistic pricing, secure payment promises, and active (but fake) social media presence are successfully deceiving consumers. AI-generated legitimacy cues are becoming indistinguishable from the real deal.
Brands are Paying the Price for These Mistakes: A staggering one in three shoppers stop buying from the genuine brand after an accidental counterfeit experience. This highlights the significant damage to brand loyalty and future sales, even when the brand isn’t directly selling the fake. High-trust categories like luxury and toys are particularly vulnerable.
3. The “Dupe Economy” is Real and Influencer-Driven:
Nearly a third (31%) of intentional counterfeit buyers were swayed by influencer promotions. Social media is driving the demand for “dupes” – budget-friendly replicas. Authenticity is taking a backseat to price and perceived identical appearance, especially among younger demographics.
This isn’t just about saving money; it’s a shift in consumer mindset. The report suggests a growing acceptance of fakes as clever alternatives, fueled by social validation and influencer endorsements.
4. Marketplaces Remain Key, But Social Media and Fake Websites are Surging:
Marketplaces (both US and China-based) are still the primary channels for counterfeit purchases. However, fake websites (accounting for 34% of unintentional purchases) and social media are rapidly gaining ground as sophisticated avenues for distribution, amplified by AI’s ability to create convincing facades.
Social media ads redirecting to infringing websites saw a massive 179% year-over-year growth. This highlights the increasing sophistication of counterfeiters in leveraging advertising platforms to drive traffic to their fake storefronts.
5. Younger Generations are More Vulnerable in Key Categories:
Millennials are significantly more likely to have their personal data stolen after purchasing from fake websites (44% vs. 34% average). This suggests a higher susceptibility to sophisticated phishing scams disguised as legitimate e-commerce sites.
Gen Z and Millennials are 2-4 times more likely to accidentally purchase counterfeit luxury goods and toys compared to Baby Boomers. Their online savviness might be a double-edged sword, making them more exposed to deceptive listings.
This study serves as both a consumer alert and a brand wake-up call. The rise of AI as a tool for both counterfeiters and consumers is a seismic shift that demands urgent attention. With compelling data and a clear-eyed look at accidental purchases, influencer-driven “dupe culture,” and the growing sophistication of fake storefronts, the findings paint a stark warning for the future of online shopping.
“Counterfeiting poses a serious and evolving threat to innovative businesses and consumer safety,” notes Piotr Stryszowski, Senior Economist at the Organization for Economic Co-operation and Development (OECD). “Criminals constantly adapt, exploiting new technologies and shifting market trends—particularly in the online environment. To effectively counter this threat, policymakers need detailed, up-to-date information. This study makes an important contribution to our understanding of how counterfeiters operate and how consumers behave online.” Ultimately, The Counterfeit Buyer Teardown report underscores a new reality: counterfeiting is no longer confined to shady sellers or easily spotted scams—it’s embedded in the very technologies shaping modern commerce. As AI continues to blur the lines between real and fake, the pressure is on for brands, platforms, and policymakers to respond with equal speed and sophistication. Combating this growing threat will require more than just awareness—it demands collaboration, innovation, and a commitment to restoring trust in the digital marketplace before the counterfeit economy becomes the new normal. For the Silo, Merilee Kern.
Merilee Kern, MBA is a brand strategist and analyst who reports on industry change makers, movers, shakers and innovators: field experts and thought leaders, brands, products, services, destinations and events. Merilee is a regular contributor to the Silo. Connect with her at www.TheLuxeList.com and LinkedIN www.LinkedIn.com/in/MerileeKern.
She designed a sanctuary for herself. Unfortunately, it turned out to be a modern masterpiece. E.1027 Eileen Gray and the House by the Sea
Opens May 16 at the IFC Center in New York City & May 23 at Laemmle Theatres in Los Angeles
Director Beatrice Minger will attend the New York and Los Angeles premieres and is available for interviews.
In 1929, Irish designer Eileen Gray created E.1027 on the sun-soaked Côte d’Azur – a bold and hidden gem of avant-garde architecture. This striking house was meant to be a personal refuge.
But when the legendary architect Le Corbusier stumbled upon it, fascination turned to obsession. He covered its walls with his murals, completely disregarding Gray’s wishes and her vision. His defiant act ignited a battle for creative control, with Gray demanding restitution for the destruction of her work, He ignored her wishes and instead built his famous Cabanon house directly behind E.1027.
E.1027 – Eileen Gray and the House By the Sea is an unusual hybrid docu-fiction film that tells a story about the power of one woman’s creative expression and a man’s desire to control it.
“Eileen Gray was a creative genius and the first woman to conquer the world of architecture at a time when men controlled it all. This new film reflects on Gray’s impressive career and her stunning modernist house on the Cote d’Azur.” – Meredith Taylor, Finito World
“The directors put architecture in dialogue with cinema in order to bring to life the sensibility of a woman who was a visionary yet is too rarely celebrated. Elegant and well thought-out, the film uses the cinematic medium to enrich a discourse.” – Giorgia Del Don, Cineuropa
“Based on the memoirs of Eileen Gray, this meticulously crafted docu-drama, where poetry slips into frames, angles and tones, almost feels like a hallucination.”– Le Monde
“As more women have the opportunity to make films, a distinct form of female narrative based on a particular female gaze and female sensitivity is being developed.” – Melita Zajc, Modern TImes Review
A First Run Features / Architecture & Design Film Festival Release E.1027 – Eileen Gray and the House By the Sea Written & Directed by Beatrice Minger Co-Directed by Christoph Schaub With Natalie Radmall-Quirke, Axel Moustache & Charles Morillon 90 minutes, color, 2024 | English & French w/English subtitles
The Canadian Wood Council has released new Environmental Product Declarations for 5 Canadian manufactured wood products.
“The release of these new EPDs reinforces our commitment to transparency and sustainability in the wood products sector.”
The Canadian Wood Council (CWC) is pleased to announce the release of five new Environmental Product Declarations (EPDs) for Canadian softwood lumber, oriented strand board (OSB), plywood, trusses, and prefabricated wood I-joists. These EPDs provide comprehensive, transparent environmental data on the potential impacts associated with the cradle-to-gate life cycle stages of these essential wood products.
“The release of these new EPDs reinforces our commitment to transparency and sustainability in the wood products sector,” said Peter Moonen, National Sustainability Manager at the Canadian Wood Council. “By providing robust, science-based environmental information, we’re equipping the industry with the tools needed to demonstrate the environmental benefits of wood and support low-carbon construction.“
Developed as Type III declarations by region for business-to-business use across the Canadian industry, they comply with the most stringent international standards, including ISO 21930, ISO 14025, ISO 14040, ISO 14044, applicable product category definition rules, and ASTM’s general program instructions for Type III EPDs. This ensures complete and credible information on the environmental impact that has been verified by an external source. The new EPDs will be able to help designers, construction companies and decision-makers make informed choices about sustainable materials.
“The publication of the new Environmental Product Declarations reinforces our commitment to transparency and environmental responsibility in the wood sector,” says Peter Moonen, National Director of Sustainability for the Canadian Wood Council. “By providing reliable, science-backed environmental data, we are giving industry the tools to demonstrate the environmental benefits of wood and to support low-carbon construction.”
For the Silo, Sarah Hicks.
Environmental Product Declarations can be downloaded from the Canadian Wood Council’s Digital Resource Centre:www.cwc.ca.
Based in Saint-Petersburg, on the shores of the Baltic Sea, Raketa Watch Factory has been creating watches for sailors, submariners, and divers for more than half a century. Raketa presents today a new version of its model for divers – Amphibia.
While preserving both the spirit and identity of its predecessors, this iconic model is now in conformity with all the modern requirements for diving, both in terms of design and functionality:
case made from stainless steel and capable of withstanding pressures at 200 metres depth.
a screw-incrown securing the movement from any water entry.
a unidirectional bezel with a 15-minute scale and luminescent indexes, producing clear clicking sound for error-free adjustment with no risk of accidental misalignment. The start marker is embossed as part of a functional design.
a high-contrast dial with large indexes and hands, easy to read and enhancing dive control. The luminescent coating ensures a bright and long-lasting glow. At greater depths, where visibility is often low and light conditions vary, orange stands out more effectively than any other color because its wavelength is less absorbed by water.
a brightly colored silicone strap crafted for comfort in aquatic environments: with its full-length perforations, you may adjust the size for a snug fit with your wetsuit and prevent water build-up beneath the strap. A second strap in black silicone is included, and swapping is easy with a quick-release system.
The heart of Raketa Amphibia is its automatic movement, manufactured from A to Z at the Raketa Watch Factory in St. Petersburg. The movement’s rotor is adorned with an image of a mermaid designed in the style of illustrations from Russian fairy tales. It reminds every diver of his secret dream — to encounter a beautiful mermaid under the sea.
Price
The cost is 2200 EUR / 3397 CAD (including VAT). For the comfort of customers, Raketa watches are delivered worldwide free of charge by DHL directly up to the front door.
Specifications:
Manufacture:
Raketa Watch Factory (Saint-Petersburg)
Movement:
Calibre:
2615
Functions:
Automatic
Number of jewels:
24
Testing positions:
4
Average rate (s/d):
-10+20
Average running time (h):
40
Frequency/hour:
18.000 / 2.5 Hz
Decoration:
Printing
Case:
Material:
Stainless steel
Size:
41.6 mm
Dial glass:
Sapphire
Back glass:
Sapphire
Water resistance:
20 АТМ
Bezel:
Superluminova
Hands:
Superluminova
Dial:
Superluminova
Straps:
Material:
Silicone
Strap width:
22 mm
Sex:
Male
FR
Raketa Amphibia –Une Raketa pour l’immersion totale
Située à Saint-Pétersbourg, aux bords de la mer Baltique, la manufacture horlogère Raketa a toujours créé des montres pour marins, sous-mariniers et plongeurs. Raketa présente aujourd’hui une version actualisée de sa légendaire Amphibia pour plongeurs.
Tout en conservant l’esprit et l’identité de ses prédécesseurs, le design et les caractéristiques de ce modèle répondent à toutes les exigences modernes d’une montre de plongée :
son nouveau boîtier en acier inoxydable est capable de résister à des pressions jusqu’à 200 mètres de profondeur ;
sa couronne filetée et vissée protège le mouvement de toute pénétration d’eau ;
sa lunette unidirectionnelle avec des index luminescents et à l’échelle de 15 minutes, produit des clics audibles assurant un réglage sans erreur et sans risque de désalignement accidentel. Le repère de départ est en relief ce qui rend son utilisation encore plus pratique ;
son cadran à contraste élevé avec des index et des aiguilles de grande taille, assure une lecture facile et permet d’améliorer le contrôle de la plongée. Le, revêtement luminescent assure une brillance intense et durable. À grande profondeur, où la visibilité est souvent faible et les conditions de luminosité variables, l’orange ressort mieux que toutes les autres couleurs car sa longueur d’onde est moins absorbée par l’eau ;
son bracelet en silicone de couleur vive est conçu pour le confort en milieu aquatique : grâce à ses perforations sur l’ensemble de la longueur, on peut ajuster la taille pour qu’elle s’adapte parfaitement à la combinaison de plongée et éviter l’accumulation de l’eau sous le bracelet. Un autre bracelet en silicone noir est inclus, et le changement de bracelet est très facile grâce au système d’attache rapide.
Le cœur de la Raketa Amphibia est son mouvement automatique, fabriqué de A à Z à la manufacture horlogère Raketa à Saint-Pétersbourg. Son rotor est orné de l’image d’une sirène inspirée par les illustrations des contes folkloriques russes. Elle nous rappelle le rêve secret de tous les plongeurs : rencontrer une magnifique sirène sous la mer.
Coût
Le prix est de 2200 Euros (TVA comprise). Pour le confort de nos clients, les montres sont livrées gratuitement jusqu’à leur porte par DHL.
Haldimand and Norfolk Counties in Ontario, Canada have become an attractive area to explore for marine fossils.
The Great Lakes Basin, once inundated by a vast ancient, shallow sea that covered much of central North America, is today revealing an abundance of fossil corals, invertebrates, and marine organisms found within many limestone formations uncovered by glaciers and erosion.
Haldimand and Norfolk County have especially become an attractive area to explore for fossils of marine organisms by both scientists and amateur fossil collectors who can travel to local locations such as Rock Point Provincial Park near Dunnville, Ontario.
However, these fossils represent more than just evidence of unique life forms that once numbered in the tens of thousands of species co-existing in a marine ecosystem. They are scientific evidence of marine ecosystems in ecological transition, shifting continents, changing climates, and a record of our planets’ every day rotation around the sun.
Many fossil corals found in Haldimand and Norfolk County date around 410 to 360 million years ago. It is a time geologically known as the “Devonian Period”, the “Devonian Reef” or the “Age of Fishes”. During this period, fishes of many different species became abundant in the fossil record. A partly submerged North America, or as yet to be formed Great Lakes Basin, was colliding with Europe close to the equator. Reef building environments began to develop and produce some of the largest reef complexes in the world.
The reef complexes were in large areas of shallow equatorial seas that existed between the continents.
Evidence of a saltwater sea supporting a vast coral reef system once covering southern Ontario over 400 million years ago in the form of fossilized coral deposits support the theory that a coral reef system existed for a very long time. It was in the basins of these former shallow seas that great quantities of rock salt, gypsum, and other types of minerals precipitated, and today, mining industries dig well below the lowest depths of Lake Erie to recover these minerals.
The “Heliophylum halli” is a fossil particular to the Great Lakes region and studies of its growth rings revealed 400 days in one Earth year when this coral was alive.
Exposure of reef basins varies and depends on how glaciers or water erosion has pushed or washed soil off bedrock. Under these conditions, a geologist’s field magnifying glass can help find very small fossils such as radiolarians and diatoms. Otherwise, larger fossils such as different varieties of bivalves (clams), trilobites, and even large fragments of fossilized coral are exposed. In some case, there are discoveries of fossilized marine organisms that are both rare and some times difficult to identify.
The fossilized remains of a Devonian Reef. Rock Point Provincial Park, Ontario.
Rock Point provincial park- exposed fossilized reef system holds an incredibly amount of fossils.
What ended these reef complexes and created one of the greatest mass extinction events of earth’s biota is not completely understood but was a combination of events that took place over a period of 25 million years.
Since species rely on a warm water marine ecosystem for their survival it would seem that a slow and gradual continental shift north from the equator would over time impact a large variety of marine species, including those supported by coral reefs. Therefore, events such as shifting continents, lowering of sea levels, climatic changes influencing land and sea ecologies, and/or possibly a glaciation had significant roles in the extinction of earth’s biodiversity.
The large deposits of fossil corals and invertebrates found in Norfolk and Haldimand County has been of great interest to scientists and fossil collectors for many decades. However, fossil collecting took on a new importance in the last 50-60 years when it was determined there was a connection between growth rings of coral skeletons with the number of days in a year.
Scientists studying samples of coral skeletons from contemporary coral reef systems discovered growth rings on the outer surface of coral skeletons.
By studying a large sample of coral skeletons and determining how many growth rings represented a year’s growth of calcium carbonate, scientists were able to calculate an average of 360 rings per year. Thereby, approximately one growth ring represented one day’s growth for each day of the year. Taking this new information, scientists began collecting large numbers of exceptionally well-preserved coral fossils belonging to the Late Devonian Period. One particular species, found in the Great Lakes region, called a “Heliophylum halli” (see above) exhibited many growth rings developing in one year during this period. The result surprised even scientists.
Fossil coral showed there were approximately 400 growth rings per year 370 million years ago. Therefore, there were about 400 days in a year in the Devonian Period. Astronomers who have calculated that our earth’s rotation has been slowing at a rate of about 2 seconds every 100,000 years have since supported the new information.
Exposures of ancient reef basins can be discovered in dried up stream beds and even under farmers fields.
Despite Haldimand and Norfolk County being a small example of a region once holding a thriving coral reef system, existing over 400 million years ago, the number of fossils of different species exposed is vast. Fossil corals, invertebrates, and species of marine organisms exist in many different shapes, sizes, and can be very fragile. Therefore, whether you are a scientist or amateur fossil collector, the next time you take a walk across the landscape to explore and search for fossils be sure to take along a fossil guide. You never know what new fossil discoveries you might make just walking across the countryside for an afternoon. For the Silo, Lorenz Bruechert.
The Metropolitan Museum of Art to Receive Major Gift of Relief Prints by renowned Inuit printmakers from René Balcer and Carolyn Hsu-Balcer.
(New York, March, 2025)—The Metropolitan Museum of Art announced today the landmark gift of the René Balcer and Carolyn Hsu-Balcer Inuit Print Collection, which features over 500 relief prints by renowned Inuit printmakers from multiple regions across Nunavut and Nunavik, the semiautonomous Arctic homeland of Canada’s Inuit population. This important collection, gifted to The Met by René Balcer and Carolyn Hsu-Balcer, is among the strongest examples of Inuit graphic art in the United States. With works ranging from the mid-1940s to the present day, it includes major works by some of the most influential Indigenous women artists in history and will significantly enhance The Met’s collections of Inuit objects. The Balcer Collection represents diverse Inuit printmaking methods, including sealskin and paper stencils; monoprints; and carved stone, or stone-cuts, on paper, and features imagery of birds, animals, Inuit peoples, transformative figures, dreams, cosmologies, and hunting scenes.
Kenojuak Ashevak’s drawings and prints feature fantastical creatures and bold colors and forms. This captivating image of an arctic owl was among the first prints produced by the West Baffin Eskimo Cooperative. It quickly became a Canadian icon, and in 1970 the print was chosen for the country’s commemorative stamp.
“We are deeply grateful to René Balcer and Carolyn Hsu-Balcer for this extraordinary gift, which is a leading collection of Inuit masterworks in a U.S. museum,” said Max Hollein, The Met’s Marina Kellen French Director and Chief Executive Officer. “Mr. and Mrs. Balcer’s dedication to the support of Inuit artists is evident in this magnificent and comprehensive collection that celebrates the remarkable artistry of Native and Indigenous individuals and communities, and we are thrilled to be able to share these prints with visitors in our American Wing galleries.”
René Balcer began collecting Inuit art in Montreal, Canada, in the late 1970s. The René Balcer and Carolyn Hsu-Balcer Inuit Print Collection highlights the famous artists’ collective and printmaking studio at Baffin Island’s Cape Dorset, the source of Inuit printmaking that was established in the 1950s. The original artists working at Cape Dorset collectively identified as the West Baffin Eskimo Co-operative, and in 1960 they released their first official catalogued collection of 41 prints to great critical acclaim. The René Balcer and Carolyn Hsu-Balcer Inuit Print Collection includes some of the most celebrated Inuit artists associated with the collective, such as Jessie Oonark (1906–1985) and Kenojuak Ashevak (1927–2013), whose print The Enchanted Owl (1960) was featured on a commemorative Canadian postal stamp in 1970 and was on view in The Met exhibition A Decade on Paper: Recent Acquisitions, 2014–2024(August 26, 2024–February 23, 2025). Looking ahead, select works in the Balcer Collection will be included as part of ongoing annual rotations in the Art of Native America installation in the Museum’s American Wing.
“This is an aesthetically and culturally significant gift, and it has been an absolute pleasure to work with René Balcer and Carolyn Hsu-Balcer in our mutual goal to more strongly represent Inuit artists in The Met collection,” said Patricia Marroquin Norby (P’ urhépecha), Associate Curator of Native American Art in the American Wing. “The arrival of this beautifully curated collection aligns with our departmental vision to prioritize previously underrepresented artists and the presence, voices, and experiences of peoples and communities who have contributed greatly to our cultural and national identities. We look forward to collaborating with Inuit communities and individual artists to highlight these works in our galleries and programming.”
René Balcer and Carolyn Hsu-Balcer said, “One of the greatest challenges the Inuit face vis-à-vis the southern world is invisibility. At best, the Inuit and their brethren in the Circumpolar region are an abstraction to the rest of the world, glimpsed mostly through the distorted lens of pop history. At worst, the reaction the Inuit get when meeting non-Indigenous people is, ‘Oh, I thought you all died off years ago.’ It is our modest hope that this collection will demonstrate that the Inuit and their culture are very much alive and very much engaged in the modern world (to wit, see the following image of Annie Pootoogook’s Watching Jerry Springer from 2003). My wife, Carolyn, and I are very grateful to The Met for accepting the collection and committing its vast resources and reach to showcase to the world the creative brilliance, wisdom, and humor of Inuit artists.”
About René Balcer and Carolyn Hsu-Balcer
René Balcer is an Emmy-winning writer, producer, and creator of critically acclaimed TV series and documentaries. René’s engagement with the Canadian North began as a teenager working in lumber mills, hydro projects, and construction on airstrips in remote communities, often alongside First Nations and Inuit coworkers.
Among other artistic endeavors across North America and Asia, René and Carolyn recently organized and participated in a multiyear artist’s residency with Chinese artist Wu Jian’an and Inuit artists at the Uqqurmiut Centre for Arts and Crafts in Pangnirtung, Nunavut, and with renowned artists Shuvinai Ashoona, Ningiukulu Teevee, and Qavavau Manumie at Kinngait Studios (Cape Dorset). René’s poignant photographs of the Arctic have been featured in gallery exhibitions in New York and appear in his recently published portfolio, Seeing As (ACC Art Books UK). For the Silo, Meryl Cates/ The Metropolitan Museum of Art.
(above) Sample pages from Rene’s “Seeing As” Artbook
About The Met
The Metropolitan Museum of Art was founded in 1870 by a group of American citizens—businessmen and financiers as well as leading artists and thinkers of the day—who wanted to create a museum to bring art and art education to the American people. Today, The Met displays tens of thousands of objects covering 5,000 years of art from around the world for everyone to experience and enjoy. The Museum lives in two iconic sites in New York City—The Met Fifth Avenue and The Met Cloisters. Millions of people also take part in The Met experience online. Since its founding, The Met has always aspired to be more than a treasury of rare and beautiful objects. Every day, art comes alive in the Museum’s galleries and through its exhibitions and events, revealing both new ideas and unexpected connections across time and across cultures.
Feature Image: Kenojuak Ashevak. “Untitled (red woman/birds/wings/feet),”Drawing, pencil and ink 10x14in, 25.4×35.6 cm. Waddington, 9/18/20. René Balcer and Carolyn Hsu-Balcer Collection, Gift of René Balcer and Carolyn Hsu-Balcer, 2024 Kenojuak Ashevak. “Untitled (red woman/birds/wings/feet),”Drawing, pencil and ink 10x14in, 25.4×35.6 cm. Waddington, 9/18/20. René Balcer and Carolyn Hsu-Balcer Collection, Gift of René Balcer and Carolyn Hsu-Balcer, 2024
One of only two McLaren F1 road cars finished in the striking Marlboro White exterior
Attractive interior configuration with light blue Alcantara driver’s seat and dark blue/grey leather and Alcantara passenger seats
Incredibly low mileage with just 1,291 kilometers (802 miles) from new
Unaltered and maintained exclusively by McLaren Special Operations in Woking throughout its life
Received a fuel cell replacement in 2021, followed by comprehensive recent maintenance in November 2024
Documented ownership history from new, beginning with Japanese racing team owner Kazumichi Goh
Complete with original owner’s manuals, fitted luggage set, tool roll, and Facom toolchest
Chassis No. SA9AB5AC6S1048053
The McLaren F1 emerged from what might be the most consequential airport delay in automotive history. In 1988, following the Italian Grand Prix, TAG-McLaren Group executives Ron Dennis and Mansour Ojjeh found themselves stranded at Linate Airport alongside McLaren’s Technical Director Gordon Murray and head of marketing Creighton Brown. Their conversation turned to creating the ultimate road car—not just another supercar, but in Dennis’s words, “…the finest sports car the world had ever seen.”
In May 1992 at Le Sporting Club Monaco, the McLaren F1 redefined the supercar genre upon its unveiling. Built around a carbon fiber monocoque—a world first for a production road car—and powered by a bespoke 6.1-liter BMW Motorsport V12 engine, the F1 delivered 627 horsepower and a power-to-weight ratio of 550 horsepower per ton. Its unique central driving position, gold-lined engine bay, and no-compromise approach to performance and driver engagement set new standards that remain unmatched to this day. Limited to just 106 examples across all variants, only 64 were built as standard road cars, making them the most revered and sought after supercar of the modern era.
This superlative example of the F1, chassis number 053, was ordered on 31 March 1995, and assigned production sequence 044. Assembly began on 28 July 1995, with the car being officially delivered “ex-works” on 27 November 1995, showing just 193 kilometers on the odometer. The original purchaser was Kazumichi Goh, the Japanese businessman behind Team Goh, which would go on to win the All Japan Grand Touring Car Championship (JGTC) in 1996 with a pair of McLaren F1 GTRs sponsored by Philip Morris cigarette brand Lark.
Chassis 053 featured a highly distinctive specification highlighted by its Marlboro White exterior finish—one of only two F1 road cars to wear this color. The cabin was finished with a unique blue-themed interior featuring dark blue/grey leather with pierced blue/grey Alcantara cloth central panels for the passenger seats, while the central driver’s seat was entirely covered in light blue Alcantara. This bespoke specification was completed with blue Wilton carpet, light blue Alcantara headlining, and an optional black suede steering wheel. The car was also delivered with a matching bespoke luggage set in dark grey leather with a blue Alcantara strip carrying the embossed chassis number. Factory driver settings were configured with the steering wheel at height position A (highest), pedals at position C (long), reach at position A (near), clutch foot rest at position D (extra long), and standard seat with extra long rails.
In 2004, chassis 053 was purchased by another Japanese collector. By late 2006, the car showed just 432 kilometers when it was sold by WHA Corporation of Nagoya, Japan, to dealer SPS Automotive Ltd. (Hong Kong) on 28 November. The car subsequently came to Europe in 2007 when it was acquired by dealer Lukas Huni AG in Switzerland on behalf of a European client with a recorded mileage of 482 kilometers. On 14 March 2014, chassis 053 was sold via Morris & Welford to collector in the United States. During this ownership, the car spent time in both the U.S. and U.K., and the mileage had increased to 1,108 kilometers. On 16 November 2016, the car was acquired by its next long-term European owner via McLaren Special Operations in Woking and subsequently registered in the U.K. with the appropriate license plate “53 MCL.”
Throughout its life, chassis 053 has been meticulously maintained by McLaren Special Operations. The service book records regular maintenance with all work completed at McLaren’s Woking headquarters on December 12, 2006 (481 kilometers), 14 June 2010 (998 kilometers), 25 October 2016 (1,185 kilometers), 24 April 2018 (1,238 kilometers), and most recently on 12 November 2024 (1,290 kilometers). In July 2021, the car received a comprehensive fuel cell service at McLaren Special Operations totaling £52,061.55 (excluding VAT), which included £31,624.50 in labor charges and £15,472.74 for the fuel cell unit itself. A covering letter from McLaren Heritage Manager Thomas Reinhold noted the return of a “favourite F1” to MSO, an F1 that also “drives extremely well.”
Further work was carried out in November 2021, including replacement of various pipes, fittings, suspension rose-joints and bushes, plus a new water pump at a cost of £23,992.05 (excluding VAT). Most recently, the car returned to MSO in late 2024 for a “3 Year Life Items” service, during which the steering wheel battery, instrument binnacle battery, key fob battery, air conditioning receiver dryer, engine oil and filters, gearbox oil, and coolant were all replaced. The car also underwent a full suspension set-up and headlamp alignment at a cost of £4,861.10 (excluding VAT). Heritage Manager Michael Wrigley’s covering email following this most recent service summed up the car’s exceptional condition: “It’s a truly lovely example so there is very little of note to comment on!”
With just 1,291 kilometers recorded from new, chassis 053 represents one of the lowest mileage and most original McLaren F1 road cars in existence. Its unique color combination, low mileage, comprehensive documentation, complete set of factory tools, owner’s manuals, and fitted luggage make it an unparalleled example of Gordon Murray’s masterpiece. Maintained throughout its life without regard to cost and exclusively serviced by McLaren Special Operations, this McLaren F1 offers its next custodian the opportunity to acquire the ultimate modern collector car in truly museum-quality condition.
A RIG THAT’S SEEN IT ALL (And would probably rather not have)
Born in the 50s for the People’s Liberation Army, the type 56 Chicom Chest Rig is without a doubt a Cold War Legend of the East. The Viet Cong rocked it in Vietnam, Soviet Spetsnaz snagged it in Afghanistan, and every commie-aligned rebel and LARP-ist from Rhodesia to the borders of South Africa copied it.
Naturally the Type 56 caught the attention of the US Special forces in Vietnam and other Western countries too. The US used the rig in conjunction with the family of AKMs borrowed from downed VCs & blend in with the enemy as much as a 6’4 Iowan MACVSOG commando could – it’s high speed and ease of use changed the western world’s opinions on belt-mounted kit as a means of combatting Insurgency.
A spiritual evolution to the bandoleers of old, the Type 56 would go on to inspire the Russian Lifchik, and spread the gospel of chest-stowed-ammo to the western world via Soldiers of Fortune in Rhodesia & South Africa. It still saw use deep within enemy territory in the past few decades. And of course, we could even credit the USA’s very own Pattern 84 rig to the Type 56’s legacy.
To us Zoomers It’s been made famous again by its depictions in cyberspace and on the big screen – CoD Black Ops, Escape from Tarkov, and hit films like Apocalypse Now & Platoon all show the influence of the OD canvas OG.
So stay loaded, unhinged and within the limits of Xi Jinping’s social credit system with the type 56.Or go hog wild and modify it. It’s only $30usd / $42.94cad from our friends at kommandostore.com and is great to get your sewing and seam ripping practice in. Just make sure the party isn’t watching, they don’t like when us filthy capitalists misuse their gear, we wouldn’t want a Cold War II: 电动布加洛.
In case this message is seen by CCP members: Zǎo shang hǎo zhōng guó! Xiàn zài wǒ yǒu Chicom rig—wǒ hěn xǐ huān! We love TEMU, Alibaba, and Xiaohongshu!
Boulder, Colorado, March, 2025 – PS Audio announces the release of The Audiophile’s Guide, a comprehensive 10-volume series on every aspect of audio system setup, equipment selection, analog and digital technology, speaker placement, room acoustics, and other topics related to getting the most musical enjoyment from an audio system. Written by PS Audio CEO Paul McGowan, it’s the most complete body of high-end audio knowledge available anywhere.
The Audiophile’s Guide hardcover book series is filled with clear, practical wisdom and real-life examples that guide readers into getting the most from their audio systems, regardless of cost or complexity. The book includes how-to tips, step-by-step instructions, and real-world stories and examples including actual listening rooms and systems. Paul McGowan noted, “think of it as sitting down with a knowledgeable friend who’s sharing hard-won wisdom about how to make music come alive in your home.”
The 10 books in the series include:
The Stereo – learn the essential techniques that transform good systems into great ones, including speaker placement, system matching, developing critical listening skills, and more.
The Loudspeaker – even the world’s finest loudspeakers will not perform to their potential without proper setup. Master the techniques that help speakers disappear, leaving the music to float in three-dimensional space.
Analog Audio – navigate the world of turntables, phono cartridges, preamps and power amplifiers, and vacuum tubes, and find out about how analog sound continues to offer an extraordinary listening experience.
Digital Audio – from sampling an audio signal to reconstructing it in high-resolution sound, this volume explains and demystifies the digital audio signal path and the various technologies involved in achieving ultimate digital sound quality.
Vinyl – discover the secrets behind achieving the full potential of analog playback in this volume that covers every aspect of turntable setup, cartridge alignment, and phono stage optimization.
The Listening Room – the space in which we listen is a critical yet often overlooked aspect of musical enjoyment. This volume tells how to transform even challenging spaces into ideal listening environments.
The Subwoofer – explore the world of deep bass reproduction, its impact on music and movies, and how to achieve the best low-frequency performance in any listening room.
Headphones – learn about dynamic, planar magnetic, electrostatic, closed-back and open-air models and more, and how headphones can create an intimate connection to your favorite music.
Home Theater – enjoy movies and TV with the thrilling, immersive sound that a great multichannel audio setup can deliver. The book explains how to bring the cinema experience home.
The Collection – this volume distills the knowledge of the above books into everything learned from more than 50 years of Paul McGowan’s experience in audio. Like the other volumes in the series, it’s written in an accessible style yet filled with technical depth, to provide the ultimate roadmap to audio excellence and musical magic.
Volumes one through nine of The Audiophile’s Guide are available for a suggested retail price of $39.99 usd , with Volume 10, The Collection, offered at $49.99 usd. In addition, The Audiophile’s Guide Limited Run Collectors’ Edition is available as a deluxe series with case binding, with the books presented in a custom-made slipcase. Each Collectors’ Edition set is available at $499.00 usd with complimentary worldwide shipping.
About PS Audio Celebrating 50 years of bringing music to life, PS Audio has earned a worldwide reputation for excellence in manufacturing innovative, high-value, leading-edge audio products. Located in Boulder, Colorado at the foothills of the Rocky Mountains, PS Audio’s staff of talented designers, engineers, production and support people build each product to deliver extraordinary performance and musical satisfaction. The company’s wide range of award-winning products include the all-in-one Sprout100 integrated amplifier, audio components, power regenerators and power conditioners.
ArtyA unveils an avant-garde horological creation:
“Purity Wavy HMS Mirror” A fully in-house caliber reimagined through masterful handcraftsmanship. The perfect union of design and comfort, encased in the groundbreaking Wavy case, crafted from titanium with a transparent protective DLC coating. The first-ever mirror casebackStairway To Heaven: The Movement At the heart of this exceptional timepiece, ArtyA’s latest in-house caliber: Stairway To Heaven HMS. This manual-winding movement embodies the Manufacture’s dedication to both visual spectacle and horological excellence: • Microbead-frosted and hand-chamfered minute wheel train and balance bridges. • Pulsing at 4 Hz, the spectacularly “starified” escapement is positioned like a podium centerpiece, suspended in mid-air. • Traditional fine regulation – a hallmark of haute horlogerie that ensures optimal precision. This process involves meticulously adjusting the balance wheel’s inertia using peripheral weights (inertia blocks) to maintain the hairspring’s steady and consistent oscillation. The result: optimized caliber performance and lasting chronometric stability. • Twin barrels, working in parallel, equipped with longer, finer mainsprings for a more stable and linear energy release. The polished barrel blade reduces friction for improved efficiency. The redesigned drum barrels, with fluid, curving lines, seamlessly integrate with the bold bridge architecture of the movement. Proudly bearing the manufacture’s name and caliber designation, this subtle detail completes the movement’s refined aesthetic. Wavy Titanium Case A bold evolution in the Wavy collection, this is the first case crafted from grade 5 titanium, a material prized for its strength and lightness. • Ultra-light yet incredibly strong, titanium embodies both modernity and innovation, delivering exceptional comfort without compromising durability. • The matte finish results from meticulous hand polishing, followed by microbead frosting for a refined texture. • A transparent DLC coating boosts resistance to scratches, shocks, and fingerprints. For comparison, stainless steel has a Vickers hardness of 200 HV, titanium 400 HV, and transparent DLC-treated titanium an impressive 1,200 HV (1,800 HV for the black DLC version). • A mirror-polished lug-to-lug contour adds a discreet yet sophisticated touch, enhancing the timepiece’s elegance without diluting its avant-garde appeal. This meticulous finish – exceptionally complex to achieve on titanium – creates a striking contrast with the case’s matte surface, balancing power with refinement. • Designed by Jérémie Arpa, son of Yvan Arpa, the case embodies independent, family-driven watchmaking at its finest. Its flowing, organic contours evoke the power of ocean waves, an effect heightened by titanium’s natural opacity – delivering a case design unlike anything seen before in haute horlogerie.
Mirror Effects The Wavy Titanium’s mirror caseback introduces an unprecedented innovation, a world first in watchmaking: • A fully reflective surface that offers a striking new way to experience the movement. • From the front, seeing through to the mirrored bottom creates the illusion of depth, with the movement seemingly floating in space, enhancing the ethereal purity of the skeletonized caliber’s aesthetic. • From the back, the one-way mirror effect teases the complexity of the movement without fully revealing it complexity, adding an element of mystery and sophistication.
Limited Edition of 99 pieces Case Grade 5 titanium, satin-finished, mirror-polished lug-to-lug contour Transparent or black DLC protective coating Diameter40 mm Thickness13 mm Water resistance50 meters Caseback Screw-in, engraved, fitted with a one-way mirror Crystal Sapphire, triple ant-reflective coating, laser-engraved chapter ring Hands Brushed and diamond-polished Crown Engraved with the ArtyA signet Caliber ArtyA Purity Stairway To Heaven HMS in-house movement Winding Manual Indications Hours, minutes, and central seconds Power reserve Minimum 72 hours, thanks to twin parallel barrels Frequency 4 Hz (28,800 vph) Finishes Fine regulation through precision adjustment of inertia blocks on the balance wheelMicrobead-frosted minute wheel train and balance bridgesHand-chamfered edgesPolished mainsprings to optimize friction in the barrel assemblies Strap Alligator or grey nubuck leather Buckle ArtyA pin buckle, available with or without black DLC coating Swiss Made Entirely designed and crafted between Geneva and the Swiss Jura Price (excluding VAT)Titanium & Black Titanium CHF 25,900 (reference price) EUR 27,900 (subject to exchange rate) USD 29,900 (subject to exchange rate) CAD 42,754 Also available with transparent, hued or NanoSaphir case From CHF 44,900 (reference price) From EUR 47,900 (subject to exchange rate) From USD 50,900 (subject to exchange rate) VERSION FRANÇAISE
If you have them should you keep them? Read on via this interesting article from our friends at Hagerty.
The nuts and bolts that make up our beloved automobiles have not changed that much over the last 150 years. But the tools needed to maintain them? Those have changed a lot. Software has cemented itself as part of a service technician’s day-to-day regimen, relegating a handful of tools to the history books. (Or, perhaps, to niche shops or private garages that keep many aging cars alive and on the road.)
How many of these now-obsolete tools do you have in your garage? More to the point, which are you still regularly using?
Though spark-plug gap tools can still be found in the “impulse buy” section of your favorite parts store, these have been all but eliminated from regular use by the growing popularity of iridium and platinum plugs. These rare-earth metals are extremely resistant to degradation but, when it comes time to set the proper gap between the ground strap and electrode, they are very delicate. That’s why the factory sets the gap when the plug is produced.
These modern plugs often work well in older engines, meaning that gapping plugs is left for luddites—those who like doing things the old way just because. Nothing wrong with that; but don’t be surprised if dedicated plug-gapping tools fade from common usage fairly quickly.
Verdict: Keep. Takes up no real space.
Dwell meter
sodor/eBay
50 years ago, a tuneup of an engine centered on the ignition system. The breaker points are critical to a properly functioning ignition system, and timing how long those points are closed (the “dwell”) determines how much charge is built up in the ignition coil and thus discharged through the spark plug. Poorly timed ignition discharge is wasted energy, but points-based ignition systems disappeared from factory floors decades ago, and drop-in electronic ignition setups have never been more reliable (or polarizing—but we’ll leave that verdict up to you.)
Setting the point gap properly is usually enough to keep an engine running well, and modern multifunction timing lights can include a dwell meter for those who really need it. A dedicated dwell meter is an outdated tool for a modern mechanic, and thus most of the vintage ones are left to estate sales and online auction sites.
Verdict: Toss once it stops working. Modern versions are affordable and multifunctional.
Distributor wrench
Snap On tools
When mechanics did a lot of regular timing adjustments and tuning, a purposely bent distributor wrench made their lives much easier. However, much like ignition points, distributors have all but disappeared. Thanks to coil-on-plug ignition systems and computer-controlled timing, the distributor is little more than a messenger: It simply tells the computer where the engine is at in its rotation.
Timing adjustments have become so uncommon that a job-specific tool is likely a waste of space. If you’ve got room in your tool chest, keep yours around; but know that a standard box-end wrench can usually get the job done and is only fractionally less convenient than the specialized version.
Verdict: Keep if you have them. No need to buy if you don’t.
Prior to the required standardization of on-board diagnostic computers by the U.S. in 1996, a single car could host a wild mix of analog and digital diagnostic methods. OBDII, which stands for On-Board Diagnostic II, wasn’t the first time that a small computer was used to pull information from the vehicle via an electronic connection; it merely standardized the language.
Throughout the 1980s and early 1990s each OEM had its own version of a scan tool. Now those tools can be reverse-engineered and functionally spoofed by a modern computer, allowing access to diagnostic info tools that, at the time, were only available to dealers. Since many pre-OBDII cars are now treated as classics or antiques and driven far less frequently, the need for period-correct diagnostic tools is dropping.
Verdict: Keep. These will only get harder to find with time, and working versions will be even rarer.
Distributor machine
A distributor is simple in concept. Trying to balance the performance and economy of the ignition system, with the distributor attached to a running engine, and achieving proper operation starts to get pretty complicated. That’s where a distributor machine comes in.
A distributor is attached to the apparatus and spun at engine speed by an electric motor. This allows you to literally see how the points are opening and closing. You can also evaluate the function of vacuum or mechanical advance systems. These machines are still great but the frequency that this service is needed these days is few and far between, especially when trying to justify keeping a large tool around and properly calibrated.
Verdict: Keep, if you are a specialty shop or tool collector.
Engine analyzer
ajpperant
Even a casual enthusiast can see there is a lot more information that can be gleaned from a running engine than whatever readouts might be on the dash. Enter the engine analyzer, a rolling cabinet of sensors and processors designed to fill in the data gaps between everything that is happening in a car and what its gauges report.
An engine analyzer is essentially a handful of additional instruments packaged into a small box hanging around the bottom of your tool drawers. It can also house a lot of sensors in a giant cabinet, which was likely wheeled into the corner of the shop in 1989 and left to gather dust. Now engine analyzers can be found listed online for as cheap as $200usd/ $287cad.
The funny thing is that many of the sensors in these engine analyzers are often the same systems that come built into modern dynamometer tuning systems. In a dyno, the sensors allow the operator to see more than max power; they also show how changes to an engine’s tune affect emissions. Maybe engine analyzers didn’t disappear so much as change clothes.
Verdict: Toss. The opportunity cost of the space these take up can be tough for most home garages. Sensors went out of calibration decades ago so the information you might get from one is dubious at best.
Most pneumatic tools (for home shops)
Ingersoll Rand
Air tools hold an odd place in the hearts of many gearheads. For many years the high-pitched zizzzz and chugging hammers of air-driven die grinders and impact drills were the marks of a pro. Or, at least, of someone who decided that plumbing high-pressure air lines around the shop was easier than installing outlets and maintaining corded tools. Air tools are fantastic for heavy use, as they are much easier to maintain and can be rebuilt and serviced.
Those tools can really suffer in lack of use, though, since pneumatic tools rely on seals and valves, neither of which deal well with dry storage. Battery tools have caught up to air tools for most DIY folk. No more air lines or compressors taking up space in the shop—and requiring additional maintenance—and, in return, a similarly sized yet more agile tool.
Verdict: Keep, if you already have the compressor. Don’t have one? Invest in battery tools.
Babbitt bearing molds/machining jigs
Every engine rebuild has to have bearings made for it in some fashion. Today’s cars use insert bearings that are mass-produced to surgical tolerances for a multitude of applications. If you wanted—or more accurately needed—new bearings in your Model T circa 1920, you needed to produce your own … in place … inside the engine. Welcome to Babbitt bearings.
The process is a true art form, from the setup of the jigs to the chemistry of pouring molten metal and machining the resulting orbs to actually fit the crankshaft and connecting rods. Now there are newly cast blocks for your T that replace the Babbitt with insert bearings. Since those antique Ford engines just don’t get abused the way they used to, and lead fairly pampered lives, they need rebuilding far less often than they did in-period. Modern oils also do a better job of protecting these delicate bearings. Since they are less and less in demand, the tooling and knowledge to make Babbitt bearings are difficult to find, and precious when you do.
Verdict: Keep. It’s literally critical to keeping a generation of cars alive.
Split-rim tire tools
Universal Rim Tool Company
Among the realm of scary-looking tools that have earned their infamy, split-rim tools hold court. The concept is simple: The rim is sectioned, allowing it to contort into a slight spiral that can be “screwed” into a tire. (This is almost the reverse of a modern tire machine, which stretches the tire around a solid wheel rim.) When tires needed tubes, both tire and rim were relatively fragile, and the roads were rough, split rims were popular—and for good reason. Now the tooling for drop-center wheels is ubiquitous and shops often won’t take on split-rim work. Success is hard to guarantee, even if techs are familiar with split rims—and they rarely are.
Verdict: Keep. No substitute for the right tools with this job.
These tools might not make much sense in a dealership technician’s work bay, but that doesn’t mean they should disappear forever. Knowing how to service antiquated technology is as important as ever, whether using old tools or new ones. If you’ve got any of these items, consider it your responsibility to document what the tool does and how to safely use it. Keeping alive the knowledge of where our modern tools came from is powerful.
JG O’Donoghue imagines a ‘versus’ scenario to demonstrate the struggle of ‘languages at risk’
There is a mass decline in linguistic diversity happening all over the planet and in places geographically far apart and I think that if things don’t change, the loss of language diversity will be immense.
In the book, Irish in the globalcontext, Suzanne Romaine mentions that linguists believe 50 to 90 % of the world’s estimated 6,900 languages will simply vanish over next 100 years.
At this moment in time, 85% of the world’s languages have fewer than 100,000 speakers and over half of the world’s remaining languages are spoken by just .2 % of the world’s population. These facts have informed my work and have become the wider subject of my illustrations, specifically the linguistic decline of the Irish language.
In some ways the battle between the Irish and the English languages is one of the defining features in modern Irish culture, but it is Irish which defines this island more, and the Irish language tells the entire history of Ireland in its influences and in its form.
Ruairí Ó hUiginn said in his book The Irish language: you have influences of Latin from the Christianization of Ireland in ecclesiastical words, influences from Viking invasions in words for “seafaring, fishing and trade”, influences from the militaristic Normans [ French CP] in words for “architecture, administration and warfare”, and from English colonialism you get English in every day words.
“To create my intended mood, the english words are given a general typography while the Irish words are given a distinctive script reminiscent of Geoffrey Keating’s book Foras Feasa ar Eirinn”
Each influence shows an aspect of Irish culture. What people forget to realize is that a language is much more than something spoken to express oneself. Ancient peoples created language in an attempt to describe the world around them and the world within them, in other words their worldview.
An example in Irish is- you don’t say ‘I’m angry’, you say ‘tá fearg orm’, which means ‘I have an anger on me’.
Nevertheless, Irish is important internationally too, and Irish is the third oldest written language in Europe, after Latin and Greek, and as a spoken language it may even be older than both.
How should an artist illustrate a language? And more specifically the struggle of one language with another? I choose nature as my metaphor, from the ancient forests of Ireland, mostly gone now, to Islands which stand for thousands of years but are slowly worn away by the tide. The words that make up these landscapes are either ‘for’ or ‘against’.
My illustrations therefore visualize the real life drama of ancient language versus modern language.
I imagine a “versus” scenario. On the “against” side I chose English words plucked from peoples statements in online forums and in letters to newspapers. On the “for” side I chose Irish words, and they were chosen from recent investigations into the creation of the ancient Irish language. Irish words in my illustrations such as “dúchas (heritage), tír (country), litríocht(literature), and stair(history)” reflect the Irish language’s cultural importance, while “Todhchaí(future), féinmhuinín(self-confidence), beatha(life), and anam(soul)” reflect its importance in a metaphysical way to Ireland.
The Irish language forest- An Coill Teanga Gaeilge
The english ‘against’ words can range from the practical benefits of english within subjects such as “tourism, movies, business, and comics,” to words that reflect the interaction of English speakers with Irish. To illustrate the concept, I chose words like “conform, bend, harass, and adapt”.
To create my intended mood, the english words are given a general indistinctive typography reflecting uniform mono-linguilism, while the Irish words are given a distinctive Irish manuscript/Gaelic script reminiscent of Geoffrey Keating’s 17th century book- Foras Feasa ar Éirinn/History of Ireland.
The core message in my illustrations is a positive one, the sun is rising for a new day as the Irish language holds on, like a lot of minority languages. It is diminished but not beyond hope. I believe it can make a comeback, and this is exactly what is happening all over this country today, because of the work of people far more dedicated than myself. I hope my work can help reinforce linguistic diversity as well as all forms of heritage. I have the will to preserve these for future generations, so they too can live in a world full of diversity spending their lives discovering and exploring it in all its beautiful variety.
In 2024, Canada’s labour market showed modest growth, with job creation continuing but lagging rapid population growth. This led to an increase in the unemployment rate, reflecting a mismatch between labour force expansion and job creation rather than a decline in sector-specific labour shortages.
Ongoing challenges persist, such as declining labour productivity, sector-specific labour shortages, underemployment, demographic shifts and disparities, and regional imbalances.
Our international comparisons show that Canada typically ranks at or below the Organisation for Economic Co-operation and Development (OECD) average in terms of labour force participation and employment rates for certain population segments. This is largely due to weaker performance in specific regions, such as the Atlantic provinces, and pension policies that incentivize early retirement.
This labour market review emphasizes the need for tailored policies to improve labour market outcomes for seniors and immigrants. Recommendations include gradually increasing the retirement age, offering high-quality training support, and easing labour mobility barriers.
Introduction
The labour market is where economic changes most directly affect working-age Canadians, influencing their job opportunities and income. The supply of labour also determines the availability of Canadians’ skills and knowledge to employers who combine them with capital to produce goods and services that drive our national income and its distribution among income classes. Therefore, the labour market is one of the most important components of Canada’s – or any – economy.
In 2024, Canada’s labour market saw moderate growth, with employment rising to 20.7 million jobs. However, the employment rate declined to 61.3 percent, down from 62.2 percent in 2023, and remains below the pre-pandemic level of 62.3 percent in 2019. While over 1.7 million employed persons have been added since 2019, employment growth has lagged behind population growth, partly due to an aging population, despite high levels of immigration.1 The unemployment rate also increased, reflecting a gap between job creation and labour force expansion, partly due to limited absorptive capacity to keep pace with population growth.
Job vacancies have decreased since mid-2022, but over half a million positions remained unfilled during the third quarter of 2024 (12 percent higher than the pre-pandemic level). Of these vacancies, the majority were full-time (432,810 positions), with more than 31 percent remaining vacant for the long term – persisting for over 90 days. Despite high full-time vacancies, more than half a million workers were underemployed in 2024, seeking full-time work while employed part-time, indicating mismatches between the skills needed by employers and the skills offered by job seekers. Among sectors facing labour shortages, factors such as better relative wages and working conditions appear to be helping, particularly in industries like construction. Healthcare, on the other hand, may benefit from raising wages and reducing training costs to better attract and retain workers.
Further, Canada faces declining labour productivity, which can be attributed to factors such as stagnant capital investment and automation, high reliance on temporary foreign workers to fill low-paying positions, underemployment (including immigrants’ overqualification), a growing public sector with lower productivity, and shifts in industry composition.
This inaugural C.D. Howe Institute labour market review highlights major differences in the labour market across provinces and sectors and among socio-economic groups. It shows that labour force participation and employment of older workers and recent immigrants still have room for improvement.
Canada needs targeted workforce development policies to improve labour market participation and outcomes for diverse population groups and encourage a longer working life (Holland 2018 and 2019). Our recommendations are to:
Gradually raise the normal retirement age from 65 to 67 and delay pension access.
Support older workers with flexible work, part-time options, and self-employment, especially in the Atlantic provinces.
Invest in high-quality training programs for underrepresented groups, focusing on digital skills and job search strategies.
Streamline credential recognition and licensure for skilled immigrants and ease labour mobility in regulated occupations while maintaining the quality of professional services.
Enhance settlement strategies for immigrants, including workplace-focused language training.
Businesses should integrate automation and artificial intelligence (AI) to boost productivity while improving retention and encouraging later retirement by offering training2 and flexible scheduling (Mahboubi and Zhang 2023).Finally, better informing Canadians about learning and training opportunities and addressing financial and non-financial barriers would improve their training participation rates and empower them to acquire the skills needed in a changing labour market.
Overview of Canada’s Labour Market
Canada’s labour market has undergone major changes over time, influenced by factors such as the COVID-19 pandemic, globalization, technological progress, and demographic shifts. These forces have affected the functioning of the labour market, with demographic changes playing a particularly important role. This section reviews key indicators (i.e., labour-force participation, employment and unemployment) and highlights the major trends and disparities in provincial and national labour markets.
The labour force has grown steadily since 1976 but experienced a decline in 2020 due to the pandemic. The lockdowns and public health measures significantly reduced worker participation, especially among women, in the labour market. However, once the restrictions were lifted, workers returned, and the labour force fully recovered. By 2024, Canada had 22.1 million people in the labour force, an increase of about 1.9 million from 2019, mainly driven by the expansionary immigration policy that the country has followed until recently.3 Immigrants accounted for 56 percent of this increase in the labour force, while non-permanent residents made up 32 percent.4
Although the labour force has grown over time, the labour force participation rate (LFPR) has trended downward over the last two decades. This trend is largely driven by an aging population, as participation rates drop sharply after age 54 and continue to decline with age. While the LFPR among prime-aged workers (25-54) reached a record high in 2023, the overall rate remained below pre-pandemic levels and declined further in 2024, reaching 65.5 percent despite high levels of immigration.5 Three factors contributed to this decline compared to pre-pandemic levels: a lower participation rate among youth, a substantial increase in the older population (aged 55 and over) and a decline in the latter group’s participation rate. This decline in older workers’ participation is primarily due to aging, as the proportion of seniors aged 65 and over within the 55-and-over age group increased from 54.8 percent in 2019 to 60 percent in 2024.
The employment rate is more sensitive to economic conditions and fluctuates with cyclical changes in the unemployment rate. It is also influenced by factors such as government policies on education, training, and income support, as well as employers’ investments in skill development and their effectiveness in matching people to jobs. Despite some volatility during economic booms and recessions, the employment rate trended upward until 2008 but has declined since then, mirroring the impact of an aging population on the participation rate (Figure 1). The pandemic caused a sharp decline in the employment rate, followed by a modest recovery. In 2024, the rate, however, declined again by approximately one percentage point to 61.3 percent, as employment growth (1.9 percent) failed to keep pace with the population growth (3 percent).
Regional disparities in employment persist across Canada. Alberta consistently maintains the highest employment rate, while Newfoundland and Labrador lags. Despite significant improvements since 1976, the Atlantic provinces continue to face challenges with employment. For its part, Ontario’s employment rate – historically the second highest in the country – has been below the national average since 2008. Regional differences in economic development, sectoral specialization patterns, educational attainment, family policy, and demographic characteristics are factors behind these employment disparities. For example, Newfoundland and Labrador and New Brunswick had the highest old-age dependency ratios (OADs) in 2024 at 39 and 37 percent, respectively, while Alberta remains the youngest province with an OAD ratio of less than 23 percent.6
The unemployment rate, a key short-term indicator, tends to rise during economic downturns and fall back during recovery, affecting employment outcomes in the opposite direction (Figure 1). The onset of the pandemic in 2020 led to a temporary surge in the unemployment rate to 9.7 percent – a four-percentage point hike from the previous year. As the economy recovered, the unemployment rate plummeted to a record low of 5.3 percent in 2022. However, by 2024, it had risen to 6.3 percent, a figure that remains relatively low by historical standards but higher than the pre-pandemic rate in 2019.
While employment grew by 1.7 million people between 2019 and 2024, the labour force expanded even faster, increasing by 1.9 million people. This imbalance – where the labour force grew more quickly than employment – pushed the unemployment rate higher, reflecting a loosening labour market and making it more challenging for job seekers to secure employment.
Overall, the labour force and employment in Canada have been expanding due to a surge in immigration. Despite unemployment rates remaining higher than the pre-pandemic level, this primarily reflects the exceptional growth in the labour force rather than a lack of job creation. The labour market continues to adjust to the increase in labour supply through strong job creation.
Looking ahead, several uncertainties and factors could influence unemployment rates. For example, the imposition of trade tariffs by the United States poses a direct risk to export-related jobs. In 2024, 8.8 percent of workers – equivalent to 1.8 million people – were employed in industries dependent on US demand for Canadian exports.7 Sectors most vulnerable to these risks include oil and gas extraction, pipeline transportation, and primary metal manufacturing.
On the other hand, stricter immigration policies that limit the inflow of permanent and non-permanent residents may reduce the growth of the labour force, which could, in turn, place downward pressure on the unemployment rate. However, the ongoing arrival of refugees, which contributes to the growing population of non-permanent residents, could lead to higher unemployment rates, particularly if newcomers face significant challenges integrating into the labour market.
To mitigate the negative impacts of aging on the labour market and address labour needs, it is important to encourage greater participation of underrepresented groups and seniors, ensure new entrants and young workers are equipped with the relevant skills to meet the labour market needs and enhance the productivity of the existing workforce. However, declining labour productivity poses an additional challenge that requires urgent attention.
Trends in Labour Productivity
Labour productivity8 in Canada has generally trended upward until the pandemic, but with a general downward trend in its growth rate. In 2020, average productivity surged to $68.5 per hour worked (in 2017 dollars), mainly driven by compositional changes in employment towards more productive jobs, particularly in the business sector, since most job losses were among low-wage workers. However, this gain proved short-lived; by 2023, productivity fell to $63.6, returning to nearly the same level as in 2019 (Figure 2).
Declining productivity has contributed to a reduction in real GDP per capita, which is a key indicator of Canadians’ living standards. Although Canada’s GDP rose by 6.9 percent (in 2017 dollars) between Q4 2019 and Q4 2023, GDP per capita decreased by 0.2 percent over that period. Since 2020, Canada’s GDP per capita growth has averaged an annual decline of 1.3 percent, compared to a growth rate of 1 percent per year between 2010 and 2019 (Wang 2022). Labour productivity continued to decline in 2024 as real GDP growth fell short of the growth of hours worked. This stands in stark contrast to the robust growth of labour productivity seen in the US during the same period.
Several factors, including human capital stock, skills utilization, overqualification, the concentration of immigrants in low-skilled jobs, limited capital investment, and slow adoption of technology, have likely contributed to recent poor labour productivity trends (Wang 2022; Robson and Bafale 2023, 2024). Notably, the combined influx of immigrants and non-permanent residents has driven the majority of employment growth between 2019 and 2024, accounting for 89 percent of the total increase in employment. Although immigrants and non-permanent residents are more likely than Canadian-born workers to have a university education, many are overqualified and work in jobs that require only a high-school diploma (Mahboubi and Zhang 2024). According to the 2021 census, the overqualification rate among immigrants9 and non-permanent residents was 21 percent and 32.4 percent, respectively, while only 8.8 percent of Canadian-born individuals with a bachelor’s degree or higher were overqualified (Schimmele and Hou 2024). With rising immigration, Canada’s productivity will increasingly depend on how effectively it leverages and develops the skills of new immigrants (Rogers 2024).
The recent influx of newcomers can help mitigate the impact of an aging population as they tend to be younger, typically being at their prime working age (Maestas, Mullen and Powell 2023). However, the concentration of immigrants and non-permanent residents in lower-skilled, low-paying sectors and occupations reduces productivity and, consequently, their contribution to GDP per capita. According to Lu and Hou (2023), between 2010 and 2019, non-permanent residents (work permit holders) were increasingly concentrated in several low-paying industries: accommodation and food services, retail trade, and administrative and support, waste management and remediation services.10 Collectively, these industries accounted for 45 percent of all temporary foreign workers in 2019. With the surge of non-permanent residents, one would expect the situation to have worsened in 2023 since the cap for hiring low-wage temporary foreign workers in 2022 increased from 10 percent to 30 percent in seven sectors, including accommodation and food services and to 20 percent for other industries.11 Similarly, Picot and Mehdi (2024) found that immigrants contribute approximately equal amounts of lower-skilled and higher-skilled labour, with 35 percent of those who landed in 2018 or 2019 working in lower-skilled jobs by 2021.
Relying on temporary foreign workers and immigrants to fill lower-skilled, low-paying jobs means that labour becomes a cheaper option than capital, which naturally disincentivizes businesses from investing in productivity-enhancing technology.12 Increases in the supply of labour also discourage business investment in skills upgrading for the existing workforce (Acemoglu and Pischke 1999).
Increases in labour supply without corresponding higher capital investment will also depress productivity. According to Robson and Bafale (2023), a larger labour force resulting from high immigration will not lead to higher living standards if workers are not equipped with better tools to produce and compete. Young and Lalonde (2024) also found that two-thirds of productivity declines since 2021 stem from this population shock.
Technological advancements, particularly digitalization and AI, offer opportunities to boost productivity. Mischke et al. (2024) find that digitalization and other technological advances could add up to 1.5 percentage points to annual productivity growth in advanced economies. Nevertheless, Canada has been slow in capital investment, automation and AI adoption.
The expansion of the public sector also poses challenges. Compared to 2019, public-sector employment increased by 19.6 percent in 2024, while private sector employment only saw an 8.5 percent increase. Consequently, public-sector jobs in 2024 accounted for 21.5 percent of all employment in Canada, up from 19.6 percent in 2019. However, public-sector productivity has lagged the business sector since 2019. In 2023, it was $58.20 per hour worked, 1.5 percent lower than its 2019 level and 1.5 percent below that of the business sector. With a higher share of public employment in the economy, this lower productivity in the public sector reduces overall labour productivity.
Lastly, significant variations in productivity across industries within the business sector shape Canada’s overall performance (Appendix Figure A1). Some industries, such as educational services, experienced notable productivity gains of 25 percent between 2019 and 2023. In contrast, some low-productivity industries faced substantial declines, with that of holding companies decreasing by 60 percent and construction and transportation dropping by 10 percent.13 Labour productivity in industries with the largest employment gains remained unchanged (professional, scientific, and technical services) or declined (public administration) during the same period (Appendix Figure A2). In contrast, agriculture and accommodation and food services witnessed productivity increases, likely due to investments in machinery and automation accompanying employment declines.
Therefore, the industrial distribution of jobs, shifts in industry composition, and demographic changes within industries can greatly affect Canada’s overall productivity. Tackling Canada’s productivity challenges will require substantial capital investment, targeted initiatives in skills development, technological advancements, and industry-specific strategies to promote sustainable economic growth.
Employment by Skill Level
Skill-biased technological changes – innovations that primarily benefit highly skilled workers, such as those proficient in technology, complex problem-solving, and critical thinking – have increased the demand for high-skilled labour in today’s job market. Despite the limitations of that approach, education has generally been used as a proxy for skills. In response to labour market needs, there has been a significant surge in higher education attainment among Canadians over time. The proportion of the population aged 25 and over having a postsecondary certificate, diploma or university degree rose from 37 percent in 1990 to 69 percent in 2024. According to OECD (2024), Canada has the highest postsecondary education attainment rate among core working-age individuals (25-64).
Despite these educational advancements, Canada faces productivity challenges and lags in technological adoption, particularly relative to the United States. One explanation is that although higher levels of education should translate into greater skills – leading to enhanced productivity, employability and adaptability to labour market changes – other factors such as education quality, experience, on-the-job training, capital investment, technological advancement, skill utilization, and age can substantially influence individuals’ skills levels (Mahboubi 2017b and 2019; Robson and Bafale 2023).
Skills and education levels heavily influence labour-market outcomes. For example, labour force participation, including among seniors, increases with educational attainment and those with higher education tend to remain in the labour market longer. This can mitigate some of the negative effects of an aging labour force, as significantly more seniors today possess a formal education above high school compared to decades ago and can take advantage of the ongoing shift from physical work to knowledge-based work.
In parallel with increases in the supply of highly educated labour, there has been a shift in skills requirements among employers.14 Figure 3 shows employment in high-skill-level occupations has seen remarkable growth over the past three decades, increasing by 299 percent from 1987 to 2024. Notably, during the pandemic, employment in high-skill-level roles continued to grow, even as jobs in other skill categories declined. By 2024, high-skill-level occupations accounted for 23 percent of total employment. Despite this growth, medium- and low-skill-level occupations remain predominant, employing approximately 8.1 million and 5.8 million workers, respectively, compared to 4.8 million in high-skill roles. In the last two decades, immigrants and non-permanent residents have increasingly taken both high-skilled and low-skilled jobs. Between 2001 and 2021, they accounted for half of the employment growth in professional and technical skill occupations (Picot and Hou 2024). Over the same period, employment in lower-skilled occupations decreased by half a million. However, more immigrants and non-permanent residents increasingly occupied low-skilled positions, while Canadian-born workers significantly transitioned away from these roles (Picot and Hou 2024). By 2021, immigrants were more concentrated in professional and lower-skilled occupations compared to their Canadian-born counterparts.
In general, the Canadian labour market has performed well since the pandemic, with particularly strong employment growth for high-skill level occupations. As demand for high-skilled labour continues to grow, improving education quality, promoting on-the-job training, and better utilizing the skills of the workforce are essential for maintaining this balance, maximizing the benefits of educational advancements, enhancing productivity and meeting the evolving demands of the labour market.
Imbalances of Labour Supply and Demand
Studying the relationship between unemployment and job vacancies provides insight into labour supply and demand imbalances. It allows us to examine two problems that hinder business growth and slow the economy down: the lack of sufficient employment opportunities for job seekers and the absence of people with the right skills to fill existing jobs.
This relationship is often described by the Beveridge curve, which illustrates how job vacancy rates and unemployment typically move in opposite directions. However, as noted by Blanchard, Domash, and Summers (2022), shifts in this relationship can occur due to factors such as increased labour demand or structural changes in the economy, leading to both higher vacancy rates and higher unemployment simultaneously.
From 2021 to mid-2022, Canada experienced a tight labour market, with an increase in job vacancies alongside declining unemployment. In response, the federal government relaxed several immigration policies to help address these shortages. However, Fortin (2024, 2025) found that a surge in immigration, particularly driven by temporary immigrants, may aggravate job vacancy rates in the overall economy, as observed in Canada between 2019 and 2023. While immigration can initially alleviate skilled labour shortages, it can also intensify shortages in the broader economy due to increased demand from newcomers for goods and services.
In 2024, the labour market transitioned from a state of tightness to a slackening one. In the third quarter of 2024, job vacancies in Canada totalled more than 572,000,15 marking a 12 percent increase compared to the pre-pandemic level in Q4 2019. With 1.5 million unemployed people in the labour market, there were more than two job seekers for every vacant position during that quarter. However, the provincial situations varied (Figure 4). For example, while British Columbia experienced a relatively tighter labour market, with fewer than two unemployed persons for each vacant position, there were more than four unemployed persons available per vacant position in Newfoundland and Labrador. However, the long-term vacancy rate – the share of openings that remained vacant for 90 days or more in total vacancies – in that province was 36.9 percent, which was four percentage points higher than the British Columbia rate in the third quarter of 2024. This indicates both limited employment opportunities for those unemployed and a mismatch between existing skills and those demanded by employers.
Imbalances between labour supply and demand in Canada also exist at the industry level (Figure 5). For example, while the healthcare sector faces severe labour shortages, the information, culture and recreation industry has the highest unemployment-to-vacancy ratio, indicating an excess labour supply. One interesting observation is that while both the construction and manufacturing sectors had similar levels of excess labour supply, the vacancy rate in construction was significantly higher at 3.6 percent, compared to 2.2 percent in manufacturing. This suggests that employers in the construction sector face more challenges in finding workers with the right skills.
The unemployment-to-job vacancy ratios across industries excluded some 612,000 unclassified unemployed persons: those who had never worked before or were employed more than a year earlier. According to Statistics Canada, about 43 percent of job vacancies in the third quarter of 2024 were for entry-level positions, which is helpful for those unclassified unemployed persons as these roles typically do not require prior experience. However, the specific skills and education requirements of these entry-level positions remain unclear.
An analysis of educational requirements for vacancies in the same quarter shows that 48 percent of all job vacancies required post-secondary training or education. Positions requiring post-secondary education below a bachelor’s degree had an unemployment-to-job vacancy ratio of 2.6, while those requiring a bachelor’s degree or higher faced a higher ratio of 4.1. In contrast, vacancies requiring only a high-school diploma or less had a lower unemployment-to-job vacancy ratio of 1.8. However, employers find it more challenging to secure suitable candidates for positions requiring higher educational levels and specialized skills, particularly at wage levels that candidates are willing to accept.
Wages play an important role in reducing labour market imbalances, as they affect both the supply and demand for labour and encourage labour mobility and reallocation. Between Q4 2019 and Q3 2024, the average offered hourly wage saw the largest increases in industries such as arts and entertainment, agriculture, and information and cultural industries (over 30 percent). These sectors also experienced the most significant reductions in job vacancies, suggesting that offering higher wages can help alleviate labour shortages. To address shortages more broadly, there may also need to be a restructuring of relative wages and working conditions between occupations with labour shortages and those with surplus labour.
Offered wage, or stated salary, rates for vacant positions should largely depend on the growth of job vacancies and the difficulties in finding candidates to fill them. However, Figure 6 shows that industries experiencing a surge in vacancies post-pandemic did not respond consistently. In fact, the average hourly offered wage in these industries fell short of the national average, which was 27 percent between Q4 2019 and Q3 2024. For example, despite substantial growth in vacancies and a shortage of candidates in healthcare, the average offered wage growth in this industry only increased by 23 percent. This is largely due to government control over wages, making them less responsive to market forces. Policies like Ontario’s Bill 124, which capped annual wage increases at one percent for civil servants from 2019 to 2022, have contributed to this restraint. Additionally, multi-year labour contracts and provincial efforts to reduce deficits and debt post-COVID have further limited wage growth in the sector.
In Q3 2024, the average hourly offered wage in the utilities sector only increased by 2 percent compared to the pre-pandemic level, despite a 48 percent increase in job vacancies. Employers in this sector need to raise wages to attract and retain workers with the necessary skills. Otherwise, they will rely on their current workforce to work longer hours to maintain operations, which can lead to lower productivity per additional hour of work and retention challenges.
The average offered wage rate by occupation follows a similar trend (Appendix Figure A3). For example, despite a 59 percent increase in job vacancies, the wage rate for occupations in education, law and social, community and government services only rose by 16 percent, which is below the national average. This further highlights the need for employers to raise wages and improve working conditions to attract and retain workers.
Outcomes by Demographic Characteristics
While labour market indicators point to a strong post-pandemic recovery characterized by high employment, not all working-age Canadians have equally participated in and benefited from this resurgence, highlighting untapped potential across different population groups. Notably, recent demographic trends highlight that the older population and immigrants experience distinct labour market outcomes. Seniors (aged 65 and over) have substantially lower labour force participation rates compared to other demographics, raising concerns about both their economic security and potential contributions to the workforce. Additionally, immigrants frequently face employment barriers that limit their ability to fully integrate into the labour market and contribute to addressing the challenges posed by an aging population. Understanding the labour market outcomes for these groups is important for identifying the obstacles they face and formulating targeted policy recommendations to enhance their participation and success in the workforce.16
Age
There are significant variations in labour force participation across age groups. As expected, seniors exhibit the lowest participation rates, with their engagement in the labour market declining substantially after age 65 (Figure 7). Seniors’ participation rate is low across all provinces, albeit with varying degrees. For instance, Saskatchewan has the highest participation rate for seniors at 18.5 percent, while Newfoundland and Labrador records a notably lower rate of 11.5 percent. The four provinces in the Atlantic region, where the aging problem is more severe, have the lowest participation rate. A lack of employment opportunities for seniors in this region seems to be a major driver, with their unemployment rate significantly higher than both the national average and their counterparts aged 25 to 64 (except for Nova Scotia) (Figure 8).
While seniors participate far less than other Canadians in the labour market, Figure 9 shows significant shifts in their average retirement age over time and notable differences across employment types. Self-employed workers consistently retire later than other workers, with their average retirement age exceeding 68 in recent years, while public sector workers tend to retire earlier. These trends likely reflect variations in pension structures, job security, and financial incentives across employment types. Between 1976 and 1998, the average retirement age of all workers declined by four years to 60.9, likely influenced by the introduction of early retirement pension schemes in order to free up jobs for younger workers (OECD 2017). However, this shift had no obvious impact on younger workers’ employment. Many economists also warned that these measures were shortsighted, as the aging of the baby boomer generation would eventually create new challenges. Meanwhile, concerns about the financial sustainability of pension systems grew due to the increasing life expectancy and subsequent rising costs of providing retirement income (Banks et al. 2010; Herbertsson and Orszag 2003; Jousten et al. 2008; Kalwij et al. 2010; OECD 2017).
In response, the federal government in 2012 increased financial penalties for early retirement to encourage longer working lives.17 Consequently, the average retirement age of all workers began to rise and reached 65.3 in 2024, slightly surpassing its 1976 level. However, the persistent gap between the public sector and self-employed workers suggests that policy adjustments – such as pension reform or incentives for longer careers in the public sector – could be considered to encourage more uniform retirement patterns across employment types. The recent influx of immigrants may also help to alleviate the impact of the retirement wave, as immigrants are more likely to keep working and retire later. According to Fan (2024), the average retirement age among immigrant workers is around 66 over the last decade, two years older than that for Canadian-born workers.
Accordingly, the LFPR of seniors has increased substantially from a historical low of 6 percent in 2001 to 15 percent in 2024. Termination of mandatory retirement, lack of sufficient savings, higher educational attainments, and better health conditions among seniors have contributed to these LFPR increases.18 Hicks (2012) predicts that social and economic pressures will lead to further delay in retirement in the future. For example, of all seniors aged 65 to 74, including both Canadian-born and immigrants, one in ten were employed in 2022 (Morissette and Hou 2024). Nine percent reported working by necessity, while immigrant seniors were more likely to do so than their Canadian-born counterparts.
In the long run, labour productivity growth is the primary driver of Canada’s GDP per capita growth, though the participation rate of seniors can also have a significant impact. Wang (2022) found that during the pandemic, declines in employment and participation rates driven by young people and seniors were major contributors to the sharp drop in GDP per capita. He estimated that if work intensity, the employment rate, and the participation rate had maintained their pre-pandemic momentum from 2010 onward, Canada’s GDP per capita could have been 4 percent higher in 2021 than it was.
As babyboomers are gradually retiring, their lower LFPR will continue to influence the overall participation rate. Vézina et al. (2024) found that the overall participation rate is expected to continue declining in the short term, regardless of the number of immigrants selected. Across various scenarios, the overall participation rate appears to be more sensitive to changes in the participation of seniors than to increases in immigration.19 As a result, keeping older workers, particularly those aged 55 and over, in the labour market could significantly impact the future overall participation rate. As more older workers remain employed, improvements in employment assistance, labour market flexibility, and skills upgrading will be essential (Vézina et al. 2024).
International Comparisons of Pension and Retirement Policies
An international comparison reveals that differences in pension and retirement policies play a crucial role in explaining disparities in employment and retirement decisions across countries (Figure 10). Factors such as the flexibility to choose between continuing to work or claiming a pension, legal provisions regarding age-based termination of employment, and employers’ retention strategies – such as offering on-the-job training and flexible work schedules – greatly influence retirement timing.
One of the most significant factors contributing to the variation in employment decisions across OECD countries is the normal age at which individuals can claim full pension benefits. For instance, in 2022, over 32 percent of Iceland’s population aged 65 and over was employed, although the normal retirement age is 67, with the earliest pension access at age 65. In contrast, only about 14 percent of Canada’s population in the same age group remained employed despite having a higher life expectancy. This discrepancy can be explained by Canada’s normal retirement age of 65, with pension benefits available as early as age 60.
Cross-country analyses show that policy reforms reducing financial incentives for early retirement were key drivers behind the increase in old-age employment (Coile et al. 2024). To address challenges related to aging populations, many countries such as Australia, Denmark, the UK, Japan and Italy have raised, or plan to gradually increase, the retirement age to encourage longer working lives. Denmark and Sweden have even indexed their mandatory retirement ages to life expectancy. Canada should consider similar approaches by raising the normal retirement age and delaying the earliest access age.
Immigrants
International immigration has significantly contributed to Canada’s population and labour force growth. Between 2019 and 2024, immigrants and non-permanent residents accounted for 68 percent of the population growth and over 88 percent of the increase in the labour force. However, immigrants often encounter various obstacles such as language barriers, a lack of Canadian work experience and varying recognition for foreign education and experience (Mahboubi and Zhang 2024). These challenges can limit their employment opportunities and earnings. Furthermore, as Canada faces an aging population, the challenge of integrating immigrants into the workforce becomes even more critical. While aging workers often possess valuable experience, they may struggle with the physical demands of certain jobs or require retraining. Newcomers, on the other hand, may not be immediately equipped to fill these gaps in employment. The productivity levels of immigrants can also be affected by their integration into the labour market, as they may require additional training and support to navigate workplace expectations and cultural nuances.
In 2024, immigrants aged 25 to 54 had a lower employment rate (by 4.3 percentage points) compared to non-immigrants (Figure 11). This gap has narrowed since 2006 and continued to decline even through the pandemic despite the latter’s greater impact on immigrants.20 The remaining gap is mainly due to the lower employment rate of female immigrants.
Employment outcomes of immigrants, particularly among women, depend predominantly on the number of years spent in Canada. For women aged 25-54, the employment gap between female non-immigrants and more recent immigrants (who landed less than 5 years) was 15.5 percentage points. This gap narrowed to 10.6 percentage points for immigrants who landed between 6 and 10 years and further to 6.2 percentage points for those who have been in Canada for more than 10 years.
Over the last decade, the improvements in immigrant employment rates are likely attributed to several factors. These include an increased selection of economic immigrants from non-permanent residents with Canadian work experience, the implementation of the Express Entry21 system for immigration selection, and favourable economic conditions where the demand and supply of immigrant labour are broadly aligned (Hou 2024). In addition, the growth in managerial, professional, and technical occupations accelerated in the late 2010s (Frenette 2023), which would benefit recent immigrants with a university education. Recent immigrants in the prime age group of 25 to 54 have seen faster employment rate growth since the early 2010s, with a notable increase of 13.1 percentage points from 2010 to 2024, compared to a 3.5 percentage point increase among non-immigrants.
However, it’s important to note that some of these conditions may change in the short term. For example, the employment rate for recent immigrants stalled from 2022 to 2023, a period when labour shortages eased, and levels of both permanent and non-permanent immigration rose rapidly (Hou 2024). As such, the dynamics of labour supply and demand have changed, particularly with the increases in the labour supply of new immigrants and non-permanent residents coupled with a cooling labour market and rising unemployment. This could negatively affect the employment outcomes of foreign-born residents in Canada more than those of Canadian-born individuals, as immigrants are often disproportionately affected during economic downturns. In 2024, there was a large increase in the unemployment rate of recent permanent immigrants, rising from 8 percent in 2023 to 9.9 percent. This is more than double the unemployment rate of non-immigrants, indicating the difficulties recent immigrants face in securing employment.
The employment rate of immigrants residing in some provinces is lower than the national rate, such as Ontario and PEI (Figure 12). The relatively poor employment outcomes among immigrants in these provinces may stem from specific employment barriers unique to immigrants, as the unemployment rate of non-immigrants in these provinces remains below the national rate. However, immigrants in Newfoundland and Labrador have a higher employment rate than non-immigrants. In contrast, the employment gap between immigrants and non-immigrants is most pronounced in Quebec, a province with the highest employment rate for non-immigrants in Canada. This gap can, to some extent, be due to a large gap in the unemployment rates of these two population groups. The unemployment rate of immigrants in Quebec is twice that of non-immigrants (or a gap of 3.5 percentage points). Grenier and Nadeau (2011) show that the lack of knowledge of French largely explains why the employment rate gap between immigrants and non-immigrants is larger in Montreal than in Toronto. Greater emphasis on official language training could enhance their ability to fully participate in the local labour market.
Policy Discussion
While the Canadian labour market has shown resilience post-pandemic and continued to perform relatively well in 2024, significant disparities across regions, industries, and demographic groups highlight opportunities to improve participation and employment outcomes. Further, Canada’s declining productivity poses a challenge to the labour market’s ability to drive sustained economic growth and competitiveness.
Demographic shifts, particularly an aging population, continue to affect participation rates and contribute to some shortages. Notably, the expansion of the health industry and the associated labour shortages are closely tied to Canada’s aging population. However, in some industries, average offered wages have not risen enough to attract a larger labour supply, and employers have not sufficiently adopted alternative strategies, such as capital investment and automation, to address their workforce needs.
Addressing these challenges requires a holistic approach. Beyond automation and higher wages, investing in existing workers and removing barriers to labour-market participation by underrepresented groups – such as women, youth, Indigenous Peoples, and seniors – can significantly improve labour market outcomes.
Regional differences in economic conditions contribute to provincial variations in the participation of seniors, while differences in pension and retirement policies play an important role in driving discrepancies in retirement timing across countries. Gradually increasing the normal retirement age is a strategy adopted by some countries to encourage later retirement among seniors. In Canada, the federal government in Budget 2019 offered a way to make later retirement financially more attractive by increasing the Guaranteed Income Supplement (GIS) earnings exemption, allowing seniors to retain more of their increased income if they choose to work. However, provincial measures aimed at boosting older workers’ labour force participation have had mixed results. For instance, Lacroix and Michaud (2024) found that a tax credit in Quebec designed to boost employment among older workers had no significant impact on transitions in or out of the labour force, with only modest effects on earnings for those aged 60 to 64. The study concluded that this measure was not a cost-effective way to increase public revenue or employment rates for older workers.
While the Conservative government in 2012 announced a plan to gradually raise the eligibility age for Canada’s Old Age Security benefits from 65 to 67 starting in 2023, the newly elected Liberal government cancelled the plan in 2016. However, with an aging population and increasing longevity, Canada should reconsider gradual adjustments to the normal retirement age and the earliest access age to help sustain public pension systems and ease demographic pressures. This approach aligns with successful international models, though it requires careful implementation to account for differences in job types and income levels.
Seniors today are healthier and living longer, and delaying retirement can offer both personal and economic benefits and ease demographic transitions (Robson and Mahboubi 2018). Longer working lives allow individuals to accumulate greater retirement savings, reducing the risk of financial insecurity in old age. Working longer has also been linked to better cognitive function, mental well-being, and social engagement.
That said, raising the retirement age would affect workers differently depending on their occupations and financial situations. While high-income, knowledge-based workers may benefit from extended careers through flexible work arrangements or hybrid options, many low-income workers in physically demanding jobs – such as those in construction, manufacturing, or caregiving – may find it challenging to work longer. Policies promoting flexible work options, lifelong learning initiatives, and encouraging and monitoring training program uptake22 can help older workers stay in the workforce longer and maintain their skills (Mahboubi and Mokaya 2021).23 Targeted support, such as enhanced workplace accommodations, phased retirement options, and retraining programs for workers in physically demanding jobs, could ensure that a later retirement age does not disproportionately burden lower-income individuals.
In response to population aging and existing labour shortages, Canada has increasingly relied on higher levels of immigration. However, the overqualification of immigrants’ skills and credentials, particularly among those from non-Western countries, remains a persistent issue. The successful integration of newcomers into the workforce is important to mitigate the short-term impact of an aging population on the labour market and enhance productivity. For example, recognizing the credentials of foreign-trained professionals in fields like healthcare could increase their productivity and earnings, helping to address the chronic shortage of healthcare workers. However, many skilled immigrants hold qualifications in regulated fields overseen by provincial regulatory bodies, which creates considerable barriers to entering the labour market. While these regulations aim to uphold public safety, they differ among provinces. Over the past few years, several provincial governments have taken steps to reduce barriers for foreign-trained immigrants. For instance, British Columbia and Nova Scotia have expedited credential assessments for foreign-trained healthcare professionals, which helped expand their healthcare workforce. Other provinces should consider adopting similar initiatives.
Licensed workers, either immigrants or non-immigrants, in these occupations also face barriers if they wish to change their province of residence. Easing provincial labour mobility in regulated professions could help reduce regional labour shortages in these sectors. Ensuring immigrants’ skills and qualifications are recognized and accepted by employers is also important.
Canada also needs to adopt more effective settlement strategies, with a strong emphasis on improving language proficiency for immigrants who struggle with communication skills. Language training tailored to workplace culture can also bridge language gaps and help newcomers obtain licences to integrate into the labour market. A notable example is the Health English Language Pro (HELP) program, which was launched by ACCES Employment to support internationally educated physicians. The program pairs Canadian physician volunteers with internationally trained medical graduates to help them acquire the necessary medical English skills. Furthermore, in recent years, the expansion of language training facilities has not kept pace with the explosive increase in the number of permanent and temporary immigrants. Governments need to systematically evaluate settlement service agencies to assess the returns on investment and enhance the effectiveness of these services in the labour market.
In addition to reducing regional disparities and improving labour market fluidity – making it easier for workers to transition between jobs – Canada should also focus on increasing GDP per capita by encouraging greater capital investment (Robson, Kronick and Kim 2019; Gu 2024; Robson and Bafale 2023 and 2024) and promoting the adoption of new technologies (e.g., AI, robotics, and automation), with a focus on increasing productivity and complementing the skills of the existing workforce.
Canada’s labour productivity has declined recently – a worrisome trend. Enhancing labour productivity involves addressing skill shortages, overqualification and mismatches. Policies that encourage training and promote automation, as well as higher wages in high-demand sectors, are essential. The potential of AI should also be explored to support labour productivity and mitigate skills and labour shortages (Mahboubi and Zhang 2023). However, it is equally important to provide support for the displacement of low-skilled workers who may be impacted by automation. Governments and employers should focus on training programs that align with the evolving demands of the labour market, including reskilling and upskilling initiatives for those at risk of displacement.
Conclusion
Addressing the challenges of an aging population, a lower senior participation rate, the overqualification of immigrants’ skills, and declining labour productivity requires comprehensive and targeted policy interventions. Canada’s labour market will benefit from proactive measures that support both its existing workforce and newcomers while addressing the demographic pressures ahead.
To ensure sustainable economic growth and greater labour market participation, the following policy actions should be considered:
The federal government should gradually raise the normal retirement age to 67 and assess the benefits of delaying the earliest access age for pension benefits, in line with successful international models.
Provincial governments should adopt targeted policies to support older workers, such as promoting flexible work arrangements, part-time career opportunities, and self-employment options, particularly in regions like the Atlantic provinces, where senior participation is notably low.
All levels of government should invest in high-quality training programs that equip individuals with the skills needed for the evolving labour market, such as digital skills and job search strategies, with a focus on underrepresented groups like seniors, Indigenous Peoples, and youth.
Provinces and regulatory bodies should collaborate to streamline the licensing process for skilled immigrants, enabling foreign-trained professionals to meet local regulatory requirements more efficiently. They should also work together to ease labour mobility in regulated occupations, ensuring that qualifications are recognized across regions without compromising service quality.
The federal government should invest in enhancing settlement strategies for immigrants, including providing language training tailored to workplace culture. It is also important to evaluate the effectiveness of existing programs to ensure they adequately support newcomers’ integration into the workforce.
Employers, in collaboration with governments, should integrate automation and advanced technologies such as AI to boost productivity while ensuring that workers’ skills align with the evolving demands of the economy.
By implementing these policies, Canada can better navigate labour market imbalances, enhance its labour force participation, and position itself for sustainable economic growth in the face of demographic and technological change.
The authors extend gratitude to Pierre Fortin, Mikal Skuterud, Steven Tobin, William B.P. Robson, Rosalie Wyonch, and several anonymous referees for valuable comments and suggestions. The authors retain responsibility for any errors and the views expressed.
References
Acemoglu, Daron, and Pischke, Jörn-Steffen. 1999. “The structure of wages and investment in general training.” Journal of Political Economy 107(3): 539-572.
Banks, James, et al. 2010. “Releasing Jobs for the Young? Early Retirement and Youth Unemployment in the United Kingdom.” In Social Security Programs and Retirement around the World: The Relationship to Youth Employment. University of Chicago Press, pp. 319-344.
Busby, Colin, and Ramya Muthukumaran. 2016. Precarious Positions: Policy Options to Mitigate Risks in Non-standard Employment. Commentary. Toronto: C.D. Howe Institute. December.
Casey, Bernard. 1998. “Incentives and Disincentives to Early and Late Retirement.” Working Paper AWP3.3. Paris: OECD.
Coile, Courtney, David Wise, Axel Börsch-Supan, Jonathan Gruber, Kevin Milligan, Richard Woodbury, Michael Baker, James Banks, Luc Behaghel, Melika Ben Salem, Paul Bingley, Didier Blanchet, Richard Blundell, Michele Boldrín, Antoine Bozio, Agar Brugiavini, Tabea Bucher-Koenen, Raluca Elena Buia, Eve Caroli, Naohiro Yashiro. 2025. “Social Security and Retirement around the World: Lessons from a Long-term Collaboration.” Journal of Pension Economics and Finance 24: 8-30.
Coile, Courtney, Kevin S. Milligan, and David A. Wise. 2018. “Social Security Programs and Retirement Around the World: Working Longer – Introduction and Summary.” National Bureau of Economic Research. Working Paper 24584. May.
Fortin, Pierre, 2024. “Does immigration help alleviate economy-wide labour shortages?” CLEF Working Paper Series 70, Canadian Labour Economics Forum (CLEF), University of Waterloo.
Fortin, Pierre, 2025. The Immigration Paradox: How an Influx of Newcomers Has Led to Labour Shortages. Commentary 677. Toronto: C.D. Howe Institute. February.
Gagnon, Morgan, Sithandazile Kuzviwanza. 2023. “Mapping Employment Supports for Québec’s Racialized and Immigrant English-speaking Communities.” Provincial Employment Roundtable (PERT). July.
Grenier, Gilles, and Serge Nadeau. 2011. “Immigrant access to work in Montreal and Toronto.” Canadian Journal of Regional Science 34(1): 19-32.
Gu, Wulong. 2024. “Investment Slowdown in Canada After the Mid-2000s: The Role of Competition and Intangibles.” Statistics Canada. DOI: https://doi.org/10.25318/11f0019m2024001-eng
Guillemette, Yvan. 2006. “Misplaced Talent: The Rising Dispersion of Unemployment Rates in Canada.” E-Brief 33. Toronto: C.D. Howe Institute.
Haun, Chris. 2023. “A Detailed Analysis of Canada’s Post-2000 Productivity Performance and Pandemic-Era Productivity Slowdown.” Center for the Study of Living Standards. Available at https://www.csls.ca/reports/csls2023-11.pdf
Herbertsson, Tryggvi Thor, and Mike Orszag. 2003. “The Early Retirement Burden: Assessing the Costs of the Continued Prevalence of Early Retirement in OECD Countries.” IZA Discussion Paper, No. 816, July.
Holland, Brian. 2018. “Defining and Measuring Workforce Development in a Post-Bipartisan Era.” GLO Discussion Paper Series # 234, Global Labour Organization (GLO).
___________. 2019. “The Design and Uses of an Employability Index to Evaluate the Vertical Workforce Development Process.” New Horizons in Adult Education and Human Resource Development 31(2): 41-59.
Jousten, Alain, Mathieu Lefèbvre, Sergio Perelman,and Pierre Pestieau. 2010. “The Effects of Early Retirement on Youth Unemployment: The Case of Belgium.” In Social Security Programs and Retirement Around the World: The Relationship to Youth Employment. University of Chicago Press, pp. 47-76.
Kalwij, Adriaan, Arie Kapteyn and Klass de Vos. 2010. “Retirement of Older Workers and Employment of the Young.” De Economist 158 (4): 341-359.
Lacroix, Guy, and Pierre-Carl Michaud. 2024. “Tax Incentives and Older Workers: Evidence from Canada.” HEC Montreal. Working Paper. September.
Lefebvre, Pierre, and Philip Merrigan. 2008. “Child-Care Policy and the Labour Supply of Mothers with Young Children: A Natural Experiment from Canada.” Journal of Labour Economics 26 (3): 519-48.
Mahboubi, Parisa. 2017a. The Power of Words: Improving Immigrants’ Literacy Skills. Commentary 486. Toronto: C.D. Howe Institute. May.
___________. 2017b. “Talkin’ ‘Bout My Generation: More Educated, But Less Skilled Canadians.” E-Brief. Toronto: C.D. Howe Institute.
___________. 2024. Quality Over Quantity: How Canada’s Immigration System Can Catch Up With Its Competitors. Commentary 654. Toronto: C.D. Howe Institute. February.
Mahboubi, Parisa, and Amira Higazy. 2022. Lives Put on Hold: The Impact of the COVID-19 Pandemic on Canada’s Youth. Commentary 624. Toronto: C.D. Howe Institute. July
Mahboubi, Parisa, and Momanyi Mokaya. 2021. The Skills Imperative: Workforce Development Strategies Post-COVID. Commentary 609. Toronto: C.D. Howe Institute.
Mahboubi, Parisa, and Tingting Zhang. 2023. Empty Seats: Why Labour Shortages Plague Small and Medium-Sized Businesses and What to Do About It. Commentary 648. Toronto: C.D. Howe Institute. November.
___________. 2024. Harnessing Immigrant Talent: Reducing Overqualification and Strengthening the Immigration System. Commentary 672. Toronto: C.D. Howe Institute.
______. 2022. What has been the impact of the COVID-19 pandemic on immigrants? An update on recent evidence. OECD Publishing. Paris. https://doi.org/10.1787/65cfc31c-en
Picot, Garnett, and Tahsin Mehdi. 2024. “The Provision of Higher- and Lower-skilled Immigrant Labour to the Canadian Economy.” Statistics Canada. DOI: https://doi.org/10.25318/36280001202400900005-eng
Robson, William B.P. 2019. Thin Capitalization: Weak Business Investment Undermines Canadian Workers. Commentary 550. Toronto: C.D. Howe Institute. August.
Robson, William B.P., and Mawakina Bafale. 2024. Underequipped: How Weak Capital Investment Hurts Canadian Prosperity and What to Do about It. Commentary 666. Toronto: C.D. Howe Institute. September.
Robson, William B.P, and Mawakina Bafale. 2023. Working Harder for Less: More People but Less Capital Is No Recipe for Prosperity. Commentary 647. Toronto: C.D. Howe Institute. June.
Robson, William B.P., and Parisa Mahboubi. 2018. “Inflated Expectations: More Immigrants Can’t Solve Canada’s Aging Problem on Their Own.” E-Brief. Toronto: C.D. Howe Institute. November.
Robson, William B.P., Jeremy Kronick and Jacob Kim. 2018. Tooling Up: Canada Needs More Robust Capital Investment. Commentary 520. Toronto: C.D. Howe Institute. September.
Schimmele, Christoph, and Feng Hou. 2024. “Trends in Education–Occupation Mismatch among Recent Immigrants with a Bachelor’s Degree or Higher, 2001 to 2021.” Statistics Canada. May 22. DOI: https://doi.org/10.25318/36280001202400500002-eng
Skuterud, Mikal. 2023. “Canada’s Missing Workers: Temporary Residents Working in Canada.” E-Brief 345. Toronto: C.D. Howe Institute. September.
Skuterud, Mikal. 2025. “The Growing Data Gap on Canada’s Temporary Resident Workforce.” E-Brief 367. Toronto: C.D. Howe Institute. February.
Looking for the ultimate destination to celebrate Irish culture this March 17? The best cities to celebrate St Patrick’s Day have been revealed.
Our friends at Casino.com have taken the guesswork out of it, calculating the number of Irish bars in the biggest North American cities. By analyzing the number of Irish pubs and the population in each city, the best cities to grab a Guinness this St Patrick’s Day have been ranked.
The best cities to celebrate St Patrick’s Day☘️
Rank
City
State/ Province
Country
Number of Irish bars per 1 million people
1
Boston
Massachusetts
United States
41.5
2
St. John’s
Newfoundland and Labrador
Canada
32.3
3
San Francisco
California
United States
19.8
4
Kelowna
British Columbia
Canada
16.5
5
Seattle
Washington
United States
16.0
6
Washington City
District of Columbia
United States
13.4
7
Baltimore
Maryland
United States
12.3
8
Philadelphia
Pennsylvania
United States
10.2
9
Regina
Saskatchewan
Canada
8.9
10
Kitchener
Ontario
Canada
7.6
Boston, Massachusetts, is the best city to celebrate St Patrick’s Day, with 41.5 Irish bars per 1 million people. Boston has a longstanding Irish heritage, with Irish immigrants arriving in the city as early as 1654 and many more following suit during the Great Irish Famine in the late 1840s and early 1850s. Unsurprisingly, Boston is the ultimate St Patrick’s Day destination, with 41.5 Irish bars per one million people, including Solas Irish Pub and Mr. Dooley’s, which are both open until late.
Celebrate the luck of the Irish in St. John’s, Newfoundland and Labrador, with 32.3 Irish bars to choose from per 1 million people. Newfoundland is a hub for Irish culture, often dubbed the ‘most Irish island in the world’, with many Irish settlers choosing to live in the province’s most populous city, St. John’s. With such a prominent Irish community in the city, St. John’s ranks second as one of the best cities to spend St Patrick’s Day in. There are about 17 Irish bars for a population of about half a million people.
San Francisco is the third-best city to celebrate St Patrick’s Day, with 19.8 Irish bars per 1 million people. San Francisco’s Irish community was largely established during the late 1840s and early 1850s, at the time of the Great Irish Famine. It is often thought that by the 1880s, around a third of the city’s population identified with Irish heritage. San Francisco is, therefore, one of the best cities for Irish culture and a top destination for St Patrick’s Day, with 19.8 Irish bars for every one million people. For the Silo, Grace Burton.
From the rolling vineyards of Provence to the luxury Champagne houses of France, celebrities are turning their star power into wine brands. But do these bottles offer more than just a famous name on the label?
Whether it’s Brad Pitt’s critically acclaimed Château Miraval rosé or Jay-Z’s ultra-premium Ace of Spades Champagne, the world of celebrity-backed wines is booming. Some are passion projects backed by top-tier winemakers, while others are little more than expensive marketing plays. Below, vinicultural expert Peter Douglas Provides a break down a few top celebrity wines.
Wines and celebrities are an iconic match.
Both evoke a sense of lifestyle, luxury, and aspiration. So, it’s no surprise that some celebrities have ventured into the wine business, adding another income stream and supporting their brand image. Celebrity wines, like their owners, come in various styles. Some hip-hop artists favor Champagne, while others opt for rosé or non-alcoholic options.
Even if a celebrity isn’t a wine connoisseur themselves, aligning with a quality product enhances their personal brand. It sends a message that they have discerning taste, appreciate the finer things, and are willing to put their name behind something they believe in (or at least want you to think they believe in!).
Regardless of their involvement, the perception of quality is crucial. No celebrity wants to be associated with a wine considered cheap or poorly made. It could damage their reputation and make the whole venture backfire.
When Brad Pitt and Angelina Jolie bought Château Miraval in 2011, it wasn’t just another celebrity purchase. Partnering with the quality-driven Perrin family, they released their first vintage in 2013, making waves in the rosé world.
Even after their war of the roses, Miraval remains a top-selling rosé. And for good reason.
It’s a classic Provence style: dry, medium-bodied, with bright acidity. Think fresh red cherries, ripe raspberries, and a touch of wild herbs. It’s crisp, refreshing, and has a lingering finish.
Is it worth the hype? Absolutely.
2. Francis Ford Coppola – Coppola Winery (California, USA)
Before celebrity wines were a thing, there was Francis Ford Coppola. The legendary director of The Godfather, Apocalypse Now, and The Conversation wasn’t just making cinematic masterpieces; he was quietly pioneering a wine empire, starting with vineyard purchases in the 1970s.
Coppola’s wine ventures are twofold: his namesake brand and the historic Inglenook estate in Napa Valley. While he sold the Francis Ford Coppola winery to Delicato Family Wines in 2021, Inglenook, a true Napa Valley icon, remains under his ownership.
The most important brands are:
Francis Ford Coppola Reserve Cabernet Sauvignon The flagship from his Sonoma winery, known for its rich flavors and elegant structure. This is the wine for a special occasion, or, you know, just a Tuesday night when you feel like channeling your inner Vito Corleone.
Director’s Cut This series takes a clever approach, linking each wine to a different aspect of filmmaking. It’s a fun concept and an excellent quality wine.
Inglenook Rubicon Inglenook is one of Napa’s “grand wine estates,” and Rubicon is its crown jewel. This is a highly sought-after, exceptional wine that commands respect (and a higher price tag). If you want to experience Napa Valley at its finest, this is a must-try.
Whether you’re a film buff, a wine aficionado, or just curious, Coppola’s wines are definitely worth a try. They are positioned in the premium section, but the extra cost is worth a shot! After all, it’s an offer you can’t refuse.
3. Post Malone – Maison No. 9 (Provence, France)
From hip-hop stages to the rolling hills of Provence, Post Malone has made a surprising, yet somehow fitting, foray into the wine world. The American rapper, producer, guitarist, and purveyor of distinctive face tattoos launched his rosé brand, Maison No. 9..
More than just a celebrity endorsement, Maison No. 9 is a genuine expression of Post Malone’s passion for wine and his vision for a rosé he truly enjoys. The name, a reference to the Nine of Swords tarot card, lends the brand a touch of mystique.||
Produced in partnership with Estandon Vignerons, Maison No. 9 comes in a distinctive bottle and expresses the classic pale salmon pink hue typical of Provençal rosés.
On the nose, it’s a bouquet of inviting aromas: think fresh strawberries and raspberries mingling with delicate white floral notes and a whisper of citrus. The palate is dry and refreshing, with a vibrant acidity that keeps things lively. Flavors of ripe strawberry and watermelon dance on the tongue, complemented by a subtle citrusy edge.
Maison No. 9 hits the spot for those who appreciate a refreshing rosé and enjoy the energy of Post Malone’s music. It’s a well-made wine that shows he’s got more than just “Circles” in his repertoire.||
4. Jay-Z – Armand de Brignac (Champagne, France)
A gold bottle, the iconic Ace of Spades logo, and a price tag that raises eyebrows: Armand de Brignac, or “Ace of Spades” as it’s more commonly known, is Jay-Z’s foray into the world of luxury Champagne. Launched in partnership with the Champagne house Terroirs des Maison, the brand was conceived as a symbol of opulence, a statement piece as much as a drink.
The blend itself is a multi-vintage cuvée, typically composed of about 40% Chardonnay, 40% Pinot Noir, and 20% Pinot Meunier. In the glass, it shimmers with a luminous pale gold hue, releasing a complex bouquet of ripe orchard fruits, bright citrus zest, and delicate notes of brioche. The palate is both creamy and vibrant, revealing layers of golden apple and juicy peach, with a subtle hint of toasted almond. An elegant mousse (the delicate bubbles) underscores the experience, leading to a persistent finish with a touch of minerality.
Jay-Z’s commitment to the brand is clear. In 2014, he acquired full ownership, solidifying his dedication. Over the years, Ace of Spades has become a champagne of the elite in nightclubs and high-end events, cementing its status as a prestige Champagne. This hard work culminated in 2021 when the luxury conglomerate Louis Vuitton Moët Hennessy (LVMH) purchased a 50% stake in the brand, officially placing it among the titans of Champagne, alongside names like Dom Pérignon and Krug.
Ace of Spades is more than just about the bling, as it’s an excellent-quality Champagne. Jay-Z has transformed from a successful musician to a pioneer in the wine industry. He’s undeniably achieved “Empire State of Mind” status and pioneered the Champagne category.
5. Thomas Anders – Modern Talking (Rheinhessen, Germany)
From the synth-driven sounds of 80s pop to the quiet vineyards of Rheinhessen, Thomas Anders of Modern Talking has embarked on a new venture. The “Titans of Pop,” known for hits like “You’re My Heart, You’re My Soul,” have traded the stage for the cellar, with Anders partnering with the St. Antony winery.
This collaboration, based near his hometown, reflects his passion for wine. Since 2022, they’ve produced the “Anders Grauburgunder” (Pinot Gris) and expanded into sparkling and rosé wines. As Anders himself puts it, “For me, wine is more than just a drink…It’s the same with music.” However, these wines are only available through their website in select markets.
Like a “Timebomb,” Kylie Minogue exploded onto the wine scene in 2020, partnering with Benchmark Drinks. With a career spanning decades, Kylie Minogue has cemented her status as a global pop icon.
From her early days on the Australian soap opera Neighbours to her chart-topping hits like “I Should Be So Lucky,” “Spinning Around,” and “Can’t Get You Out of My Head,” Kylie has consistently reinvented herself, captivating audiences worldwide. Now, she’s bringing that same energy and style to the world of wine with her self-titled brand, which includes:
Prosecco Rosé This fancy bottle, adorned with Kylie’s signature, is a fruit-driven, light, and elegant sparkling wine. The Australian singer brings her musical flair to life through this bubbly sensation.
Kylie Minogue No Alcohol Sparkling Rosé A refreshing and finely balanced non-alcoholic sparkling rosé with elegant hints of strawberries. Perfect for those who want to “Spin Around” without the hangover.
And many more! Kylie’s wine offerings are constantly expanding, including Sauvignon Blanc, Rosé, and other varietals and regions.
Kylie Minogue Wines has swiftly established itself as a serious and stylish brand dedicated to producing excellent wines. Her expanding portfolio offers numerous award winners, solidifying Kylie’s presence as a noteworthy figure in the wine and music industry. This is a brand producing excellent wines and definitely one to watch closely.
So are celebrity wines worth the hype?
Yes, these celebrity wine brands are great gifts and often deliver on quality. You pay a premium, but you get a taste of a lifestyle.
For the Silo, Peter Douglas, VinoVoss.com Wine Expert
Peter Douglas, DipWSET, is a wine expert with the “VinoVoss AI Sommelier” smartphone app and web-based semantic wine search and recommendation system developed by BetterAI. VinoVoss picks the perfect wine every time, for any occasion courtesy of a highly advanced artificial intelligence assist. Douglas is an experienced wine trade professional with a diverse background in the HORECA industry, specialist stores, purchasing, portfolio management, and general wine trade. He also possesses hands-on experience in winemaking, further enhancing his knowledge and understanding of the industry. Peter’s qualifications include the WSET-Level 4 Diploma in Wines and Spirits, and currently, he is in Stage 2 of pursuing the most esteemed and prestigious title in the wine industry, Master of Wine. Peter’s expertise extends to consulting distributors and importers, as well as assisting in enhancing the wine portfolio of on-trade settings. Additionally, Peter serves as a wine agent, proficient in sourcing specific SKUs at favorable prices for clients’ portfolios. He can be reached via www.VinoVoss.com.
Brunette knockout Christina Estrada modeled for some of the world’s top brands and appeared in the famous Pirelli calendar. Born in the USA, the glamorous Estrada has been based in London since 1998. She was previously married to Saudi billionaire Sheikh Walid Juffali, but the couple divorced in 2016, leaving Estrada the sole owner of a fabulous Beverly Hills villa. The supermodel has listed the stunning estate for sale at $26 million usd/ $37.7 million cad. According to the listing agent, Gary Gold, “This is the quintessential Beverly Hills estate located on the best block of the best street in the Flats. This is the type of home you see in a movie portraying the good life.”
Built in the 1930s, the mansion has been painstakingly restored, blending the irreplaceable craftsmanship of a bygone era with all the latest in modern luxury.
Spanning 9,000 square feet with five bedrooms, eight bathrooms, and luxe modern amenities, the residence will be sold fully furnished.
The two-story home boasts an imposing Italian-style facade. Old World styling is evident throughout the mansion, with columns, archways, wrought-iron details, and exquisite beamed ceilings. Enter through the impressive two-story foyer, featuring double staircases, coved archways, a wonderful chandelier, and a hand-painted ceiling. The chef’s kitchen boasts top-of-the-line appliances and a spacious butler’s pantry, while the formal dining room includes seating for 12. A cozy breakfast offers a more relaxed atmosphere, with yard access for al fresco dining.
The spacious primary suite includes big windows for lots of natural light, a generously appointed bathroom with marble accents and a glamorous mirrored powder room, plus a walk-in closet fit for a supermodel’s wardrobe. Upstairs, find three more bedrooms with their own en-suites, furnished in a classic style. A step-down living room with steel-case windows and an attractive great room with an inviting fireplace offer lots of space for lounging. Meticulous attention to detail is evident in every room, while the chic but understated furnishings allow the home’s timeless beauty to shine.
The spectacular yard offers a resort-like atmosphere with a stylish pool, manicured lawns, and tall hedges for lots of privacy. Multiple balconies offer pool views, while the den and family room connect with the outdoor spaces for seamless indoor-outdoor living, taking advantage of LA’s year-round pleasant weather. The covered loggia is especially lovely, with intricate columns and a curtained gazebo. Other amenities include a library with built-in bookshelves, a five-car garage, and a separate guest house with two bedrooms and two baths.
Located just off world-famous Sunset Blvd, the mansion is convenient to the music and entertainment venues of the Sunset Strip, the high-end shops on Rodeo Drive, the Getty Museum, and the Los Angeles Country Club. Known for its beautiful homes on large lots, the Flats is one of 90210’s most exclusive neighborhoods. Just a few of the zipcode’s illustrious residents include Adele, Taylor Swift, Jennifer Aniston, Jack Nicholson, Ashton Kutcher and Katy Perry. For the Silo, Bob Walsh/ toptenrealestatedeals.com.
The listing is held by Gary Gold at Forward One. Photo Credit: Jennifer Mann, The Luxury Level
Microfibers were invented by Japanese textile company Toray in 1970, but the technology wasn’t used for cleaning until the late 1980s.
The key, as the name suggests, is in the fiber: Each strand is really tiny—100 times finer than human hair—which allows them to be packed densely on a towel. That creates a lot of surface area to absorb water and pick up dust and dirt. Plus, microfibers have a positive electric charge when dry (you might notice the static cling on your towels), which further helps the towel to pick up and hold dirt. “They tend to trap the dirt in but not allow it to re-scratch the finish,” explains professional concours detailer Tim McNair, who ditched old T-shirts and terry cloths for microfibers back in the 1990s.
These days, the little towels are ubiquitous and relatively cheap, but in order to perform wonders consistently, they need to be treated with respect. Below, a miniature guide to microfibers.
Care for Your Towels: Dos and Don’ts
“They’re just towels,” you might say to yourself. But if you want them to last and retain their effectiveness, microfiber towels need more care than your shop rags:
DO: Keep your microfiber towels together in a clean storage space like a Rubbermaid container. They absorb dirt so readily that a carelessly stored one will be dirty before you even use it.
DON’T: Keep towels that are dropped on the ground. It’s hard to get that gunk out and it will scratch your paint.
DO: Reuse your towels. “I have towels that have lasted 15 years,” says McNair. That said, he recommends keeping track of how they’re used. “I’ll use a general-purpose microfiber to clean an interior or two, and I’ll take them home and wash them. After about two, three washings, it starts to fade and get funky, and then that becomes the towel that does lower rockers. Then the lower rocker towel becomes the engine towel. After engines, it gets thrown away.”
DON’T: Wash your microfibers with scented detergent, which can damage the fibers and make them less effective at trapping dirt. OxiClean works great, according to McNair.
DO: Separate your microfibers from other laundry. “Make sure that you keep the really good stuff with the really good stuff and the filthy stuff with the filthy stuff,” says McNair.
DO: Air-dry your towels. Heat from the dryer can damage the delicate fibers. If you’re in a rush, use the dryer’s lowest setting.
How Do You Know Microfiber Is Split Or Not?
A widespread misunderstanding is that you can “feel” if a microfiber towel is made from split microfiber or not by stroking it with your hand. This is false!
The theory is that if it feels like the towel “hooks” onto tiny imperfections on dry unmoisturized hands, this is because the fibers are split and they microscopically grab your skin. Although this is partially true, you cannot feel split microfiber “hook” onto your skin. These microscopic hooks are way too small to feel, but do generate a general surface resistance called “grab”. Yet, this is not the “individual” hooking sensation you feel when you touch most microfiber towels. It’s the tiny loops in loop-woven microfiber that are large enough to actually feel grabbing imperfections on your hands (minute skin scales).
Try it for yourself: gently stroke a loop-weave microfiber towel of any kind, split or not. If your hands are dry and unmoisturized, you will feel the typical “hooking” sensation most people hate. It’s simply the loops that catch around the scales on your skin like mini lassos. Take a picture of the microfiber material with your smartphone, zoom in and you can clearly see the loops.
Now try stroking a cut microfiber towel which is not loop-woven, split or not, and it will not give that awful hooking sensation. If you take a picture of this material, you will see a furry surface without those loops. Because there are no loops, it won’t “hook”.
Now you know the truth: it’s the loops that latch onto your skin when you touch a microfiber towel, regardless if the towel is split microfiber or not. Tightly woven microfiber towels without pile (e.g. glass towels) can also have the “hooking” effect, caused by the way their fibers are woven, but less pronounced than loop weave towels.
Another misunderstanding is that a towel that is made of non-split microfiber will “push away” water and is non-absorbent. This also is not true!
Although a non-split microfiber fiber is not absorbent, water is still caught in between the fibers. You can do the test: submerge a 100% polyester fleece garment (check the label), which is always non-split fiber, in a bucket of water and take it out after about 10 sec. Wring it out over an empty bucket and you’ll see that it holds quite a bit of water, meaning it is absorbent.
So, another myth is busted: non-split microfiber can’t be determined simply by testing if it holds water. You can however test how much water it holds. Compare it to a similar dry-weight towel that is known to be split 70/30 microfiber: Submerge both in a bucket of water. If they hold about the same amount of water, they are both split microfiber. If the 70/30 towel holds more than twice as much water, the test towel is more than likely non-split material.
How do you know if Microfiber is split or not?
A widespread misunderstanding is that you can “feel” if a microfiber towel is made from split microfiber or not by stroking it with your hand. This is false!
The theory is that if it feels like the towel “hooks” onto tiny imperfections on dry non-moisturized hands, this is because the fibers are split and they microscopically grab your skin. Although this is partially true, you cannot feel split microfiber “hook” onto your skin. Our friends at classiccarmaintenance.com have more to say about this- “these microscopic hooks are way too small to feel, but do generate a general surface resistance called “grab”.” Yet, this is not the “individual” hooking sensation you feel when you touch most microfiber towels. It’s the tiny loops in loop-woven microfiber that are large enough to actually feel grabbing imperfections on your hands (minute skin scales).
Try it for yourself: gently stroke a loop-weave microfiber towel of any kind, split or not. If your hands are dry and unmoisturized, you will feel the typical “hooking” sensation most people hate. It’s simply the loops that catch around the scales on your skin like mini lassos. Take a picture of the microfiber material with your smartphone, zoom in and you can clearly see the loops.
Now try stroking a cut microfiber towel which is not loop-woven, split or not, and it will not give that awful hooking sensation. If you take a picture of this material, you will see a furry surface without those loops. Because there are no loops, it won’t “hook”.
Now you know the truth: it’s the loops that latch onto your skin when you touch a microfiber towel, regardless if the towel is split microfiber or not. Tightly woven microfiber towels without pile (e.g. glass towels) can also have the “hooking” effect, caused by the way their fibers are woven, but less pronounced than loop weave towels.
Another misunderstanding is that a towel that is made of non-split microfiber will “push away” water and is non-absorbent. This also is not true!
Although a non-split microfiber fiber is not absorbent, water is still caught in between the fibers. You can do the test: submerge a 100% polyester fleece garment (check the label), which is always non-split fiber, in a bucket of water and take it out after about 10 sec. Wring it out over an empty bucket and you’ll see that it holds quite a bit of water, meaning it is absorbent.
So, another myth is busted: non-split microfiber can’t be determined simply by testing if it holds water. You can however test how much water it holds. Compare it to a similar dry-weight towel that is known to be split 70/30 microfiber: Submerge both in a bucket of water. If they hold about the same amount of water, they are both split microfiber. If the 70/30 towel holds more than twice as much water, the test towel is more than likely non-split material.
Tim’s Towels
The budget pack of microfiber towels will serve you fine, but if you want to go down the detailing rabbit hole, there’s a dizzying variety of towel types that will help you do specific jobs more effectively. Here’s what McNair recommends:
General Use: German janitorial supply company Unger’s towels are “the most durable things I’ve ever seen,” says McNair.
Wheels and other greasy areas: This roll of 75 microfiber towels from Walmart is perfect for down-and-dirty cleaning, like wire wheels. When your towel gets too dirty, throw it away and rip a new one off the roll.
Glass: There are specific two-sided towels for glass cleaning. One side has a thick nap that is good for getting bugs and gunk off the windshield. The other side has no nap—just a smooth nylon finish—that’s good for a streak-free final wipe down.


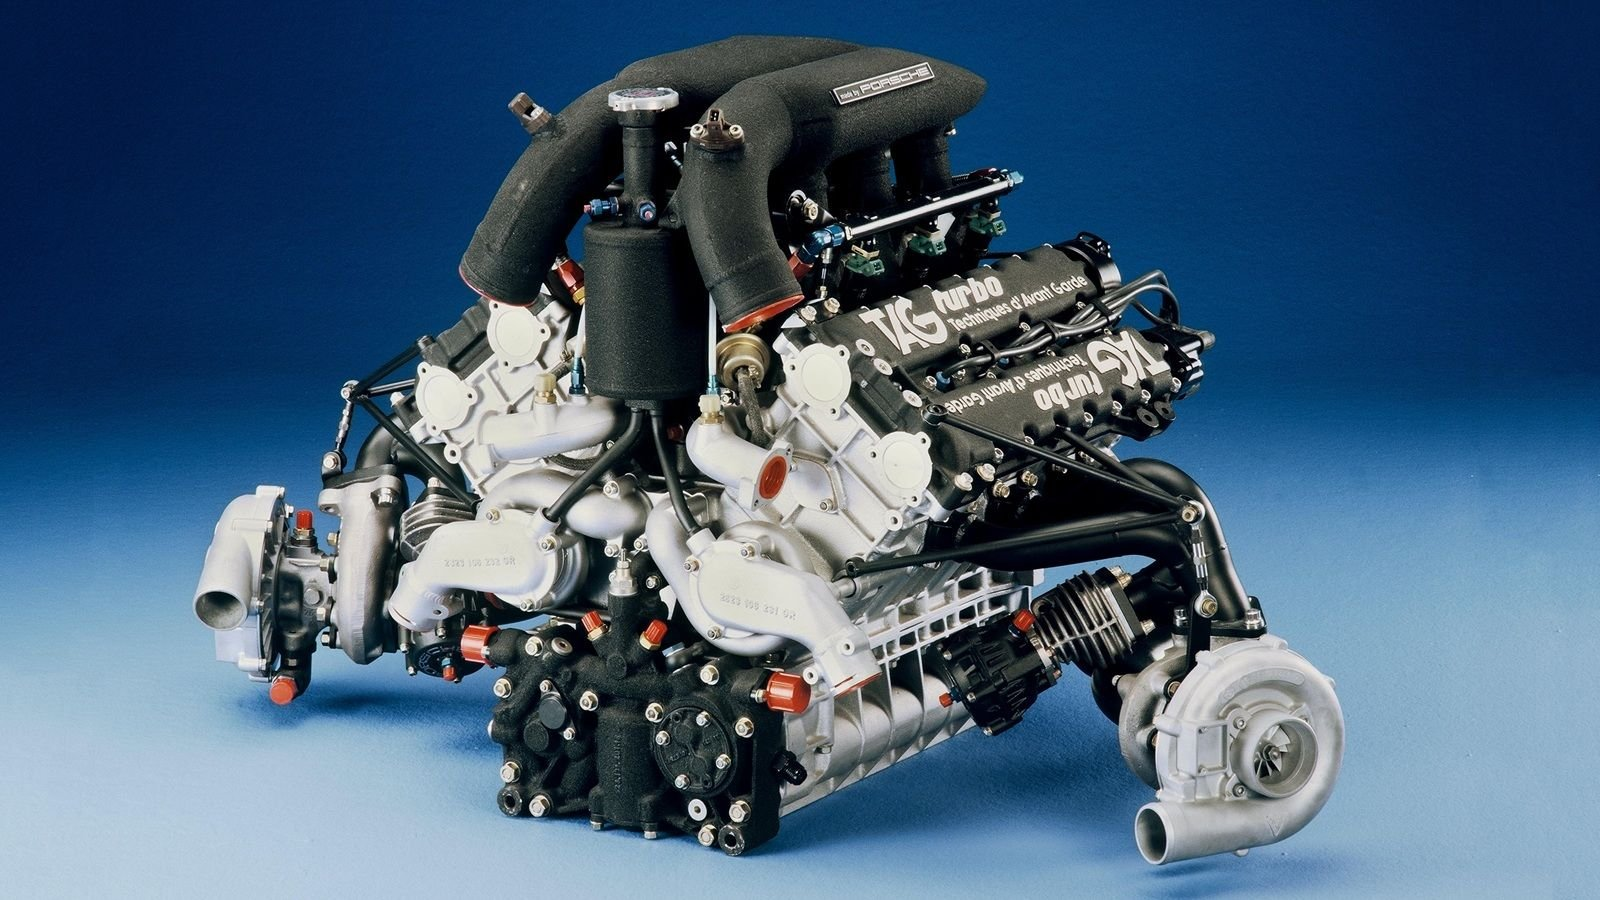


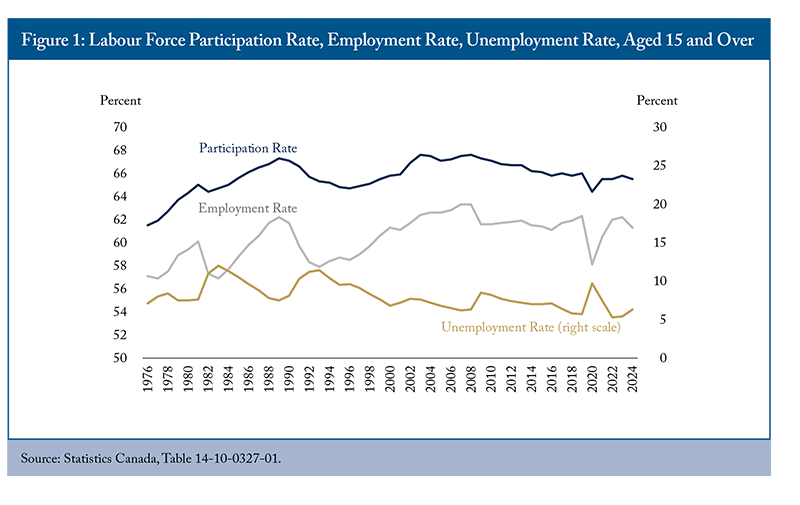

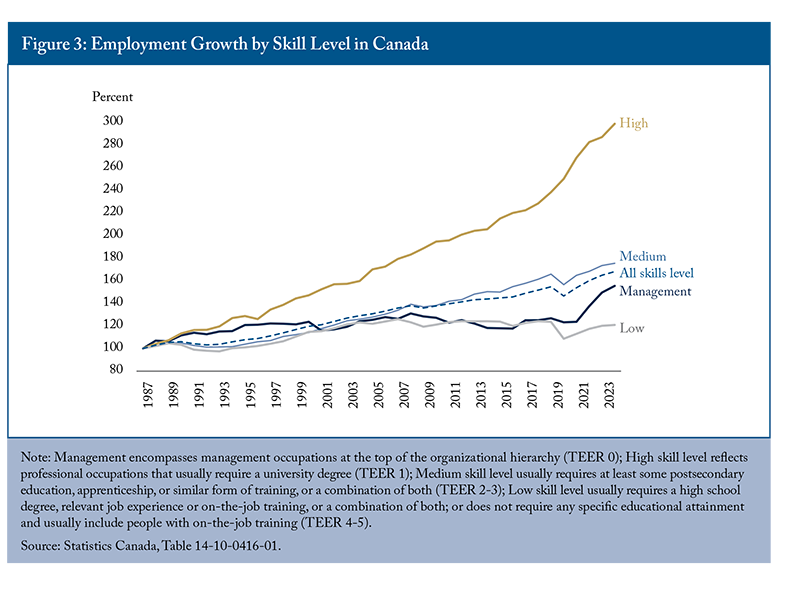
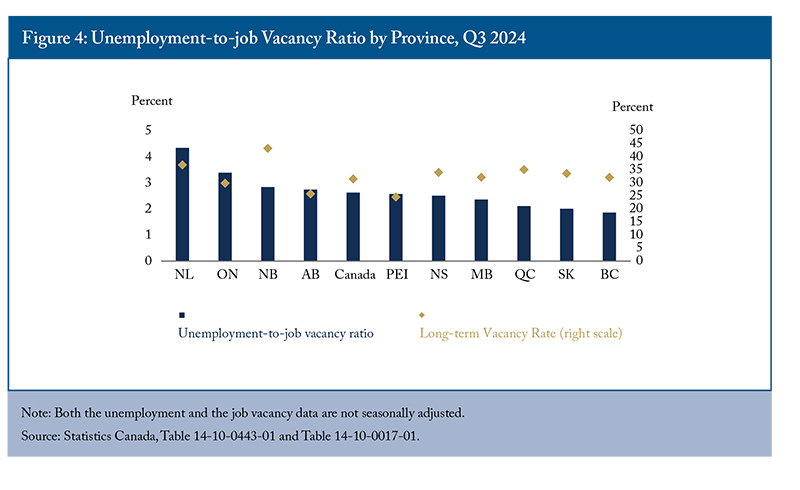
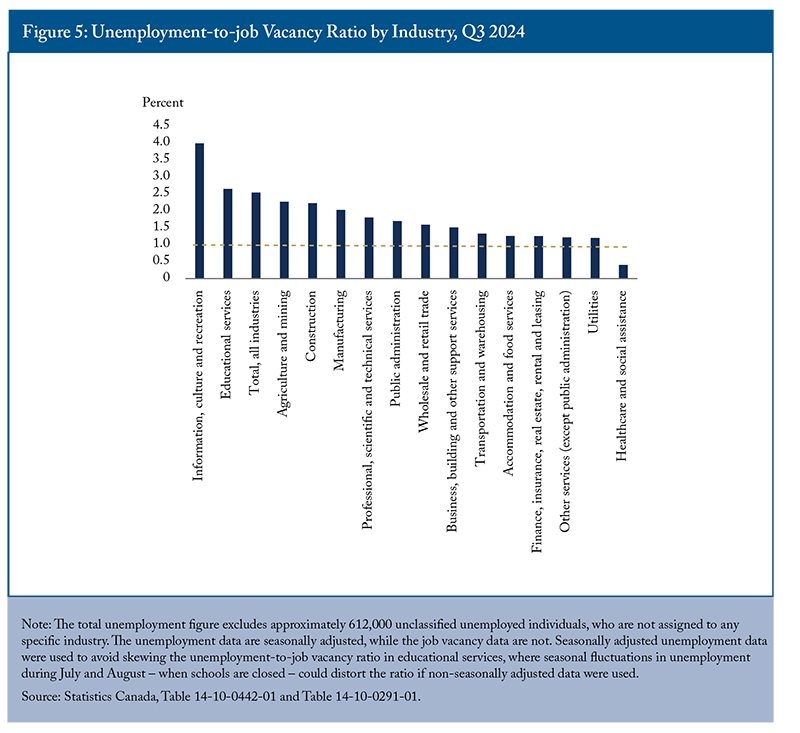
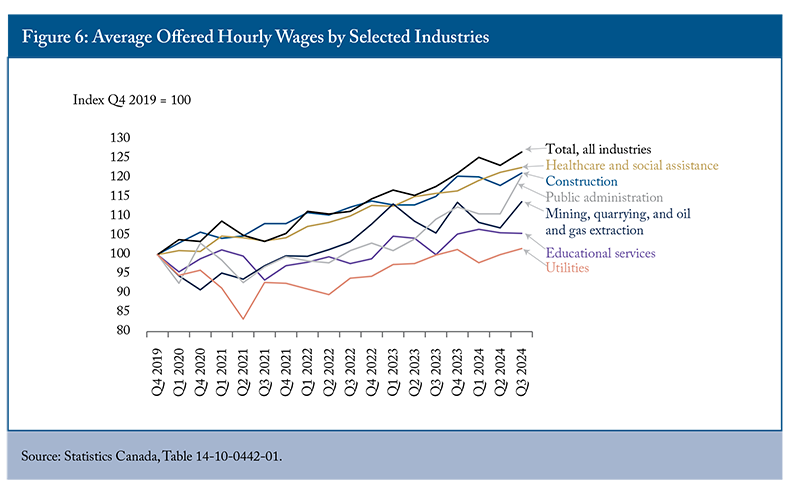
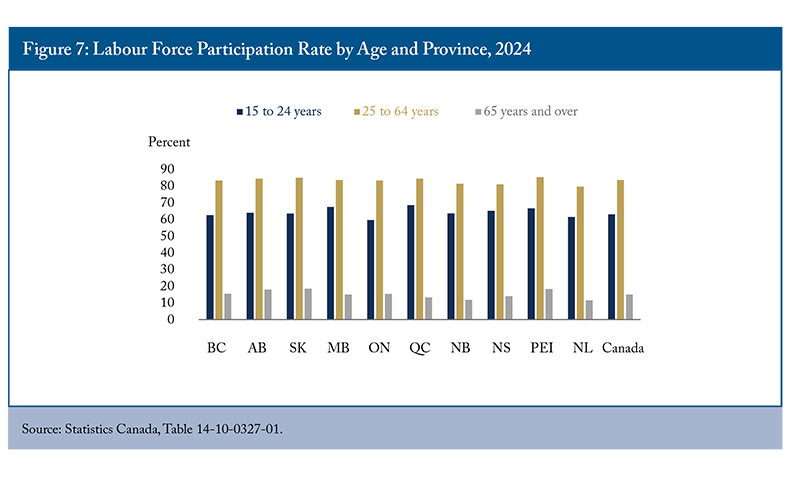


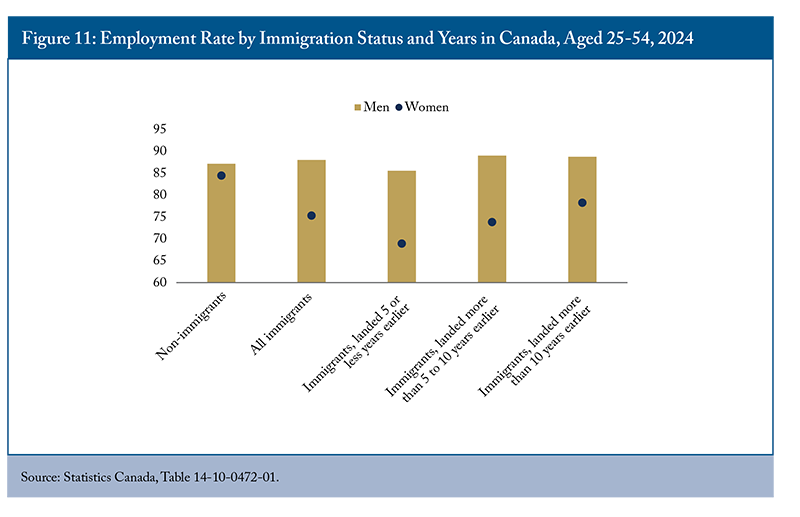
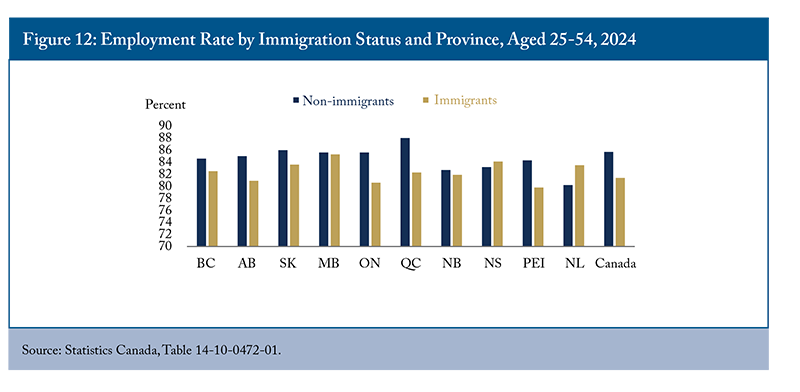

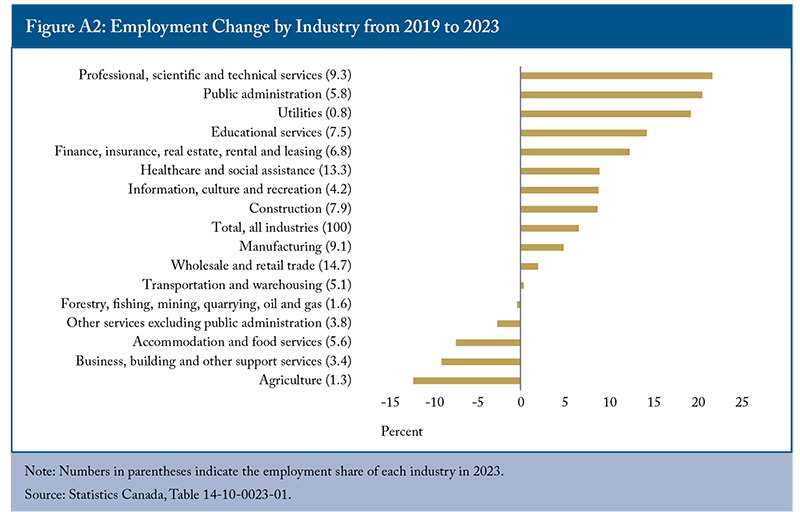


