How To Setup A Low Budget Home Gym

Back in college, I used to be very fit.

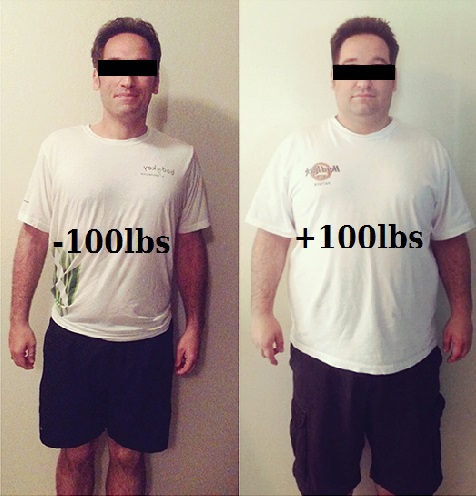
I swam three times a week, ran a few miles every other day and on weekends, I would bike with friends. There was not an ounce of fat in my body. But as years passed, I became too busy with work and eventually with raising a family that exercise became less important and I didn’t bother going to the gym. It came to a point when I saw myself in the mirror and hardly recognized my own body. In a span of 14 years, I gained over a hundred pounds. Plus Minus 100 Pounds Man ExampleI realized I needed to do something about it and fast. So I browsed the best online shopping sites looking for affordable gym equipment that I could just set up at home. I can’t go to a gym because, well…… Covid duh! Plus  I can only workout in the wee hours of the morning when everyone else in my home is still fast asleep.
Start Cheap

Many of my friends made the mistake of investing in equipment that cost over a thousand dollars and ended up not using them anyway. The truth of the matter is that it’s very possible to create a home gym for very little money. In doing so, you won’t be wasting money in case you find yourself not using your home gym and if you do decide to fully commit yourself to a healthy and active lifestyle then you can always upgrade your equipment and machines in the future.

The following are the most essential things you’ll need:

1. Private Space

It’s difficult to work out when you have screaming kids running around you. Ideally, pick a room with a door so that you can exercise uninterrupted.

2. Full-Length Mirror

Being able to see yourself working out is a great motivator and it’s also a good way to check your form and technique. You can buy a full-length mirror for around $20 – $30.

3. Weights

Every home gym should have a set of dumbbells. For women, start with 5, 10 and 15 lbs. Men should use heavier weights. Or you can get an adjustable dumbbell that will enable you to add or swap weights easily.
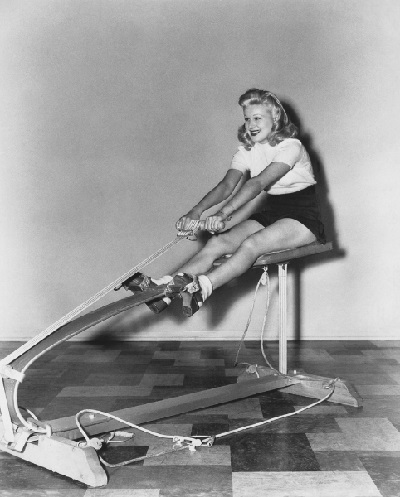
Okay some old school equip has seen it's day but don't dismiss all vintage gym gear!
Okay some old school equip has seen it’s day but don’t dismiss all vintage gym gear!

4. Stability Ball

Old school trainers would never recommend the use of a stability ball but it’s actually very popular among fitness experts today. With a stability ball, you can improve your core strength and balance. Besides, there are many exercises you can do with this ball – body bridges, squats, crunches, hamstring curls, and others.

5. Resistance Bands

These bands are very versatile despite looking plain and simple. You can strap it to a door, bench or table to do squats, chest presses, and lat pull-downs, to name a few.

6. Cardio

You can get a skipping rope so that you can do cardio exercises in your home gym. Or you can just go outside to run, jog or walk. Cardio exercises are essential to help your body burn fat faster. For the Silo, Dimitry Karloff.

Supplemental– Looking for some examples of cool home gyms on a budget?

5 Ways to Stay in Touch With Your Customers

If you are a business owner, you probably know the importance of taking care of your business to last longer. This includes various steps, such as audience retention, brand reach and customer satisfaction. There are many practices that help in building the brand and trust. Staying in touch with your audience can be a great way to build your business.

This is a great way to remind them of your service. This builds trust and authenticity. Keeping the existing customers happy can be. There are many ways one can go about staying in touch with your customers. Initially, a business can start with manual modes of staying in touch. This can be feedback calls, offers, SMS, etc.

Here are five ways to stay in touch with your customers and audience to build brand authenticity and trust.


Automated Bulk SMS


SMS is a quick way to update your customers about offers, deals, etc. Although this can be done manually up to a certain point, it gets difficult once the number increases. There are many SMS API providers that enable you to send bulk messages to your customers. Bulk SMSes helps in providing timely and personalized information to the customers.

This increases user engagement, satisfaction rates and customer lifetime values. You can check out any SMS API provider to understand the deals and go with the one that suits your requirements.

The Importance Of Lead Nurturing – Statistics and Trends [Infographic]

Lead Nurturing


Be it an inquiry or just someone who has come in touch with your brand, treat them as your potential customers. Lead nurturing is an integral process of branding and growing your business.

Take care of them by checking on them, letting them know about your business, offering them a solution for their needs. Be the brand that strikes them when they have a business need that is similar to yours.

By email marketing, you can nurture your leads. Send them monthly emails about the new things in your company or brand. Update them with the latest deals and offers, and invite them to experience your service. This increases brand retention.

Social Media Marketing


Social media marketing has been on the rise and is proven to be one of the efficient ways to market in today’s digital world. Social media marketing is a form of digital marketing. Unlike traditional marketing, digital marketing focuses more on the customer than the brand itself.

This is a great way to tell your customers that you care about them. Social Media marketing also enables you to have a one on one conversation with your audience.

Make sure you use this space to increase customer satisfaction and to understand your audience better. Be present on all the relevant social media handles and nail down a content strategy that will add value to your customers.

Improvise. Adapt. Overcome | Know Your Meme

Adapting and Improvising


Adapting is a fundamental process for a business to sustain. With new trends emerging every day, it is essential to keep moving forward along with it.

Be it strategy or message; it is important to improvise it according to what the customers need at the moment.

One way you can do this is to constantly be updated. Be aware of the new trends. Keep track of your audience and their activity.

Value Customer Feedback


Be it any business; the customer is the king. You are running the business for the customers, and it is essential to value customer feedback highly.
Customer feedback tells what a customer actually feels about your service. This valuable information can be used to improve your service to improve satisfaction.

A business that has an idea of a customer’s opinion goes a long way. This can also let you know about the needs of the customers.

You can send in a monthly customer feedback form the customers where they can rate their experience with you. This can be based on different areas of business like service, product, after-sales service extra.

Running a business is a journey that constantly needs an upgrade and improvisation. If you wish to run a successful long term business, you must start putting your customer before you. Little gestures you make for your customers will certainly take your business a long way.

It is a long term process, but taking customer satisfaction for granted can seriously cause great damage to your business.

Stay in touch with your audience and remind them that you care about them. This will take your business a long way and help in growing in the right direction. For The Silo, Esther Adams.

Bitcoin Can Now be Purchased Through PayPal but is it Ready for the Average Internet User?

After many years of toying with the notion of moving into the cryptocurrency market, 2020 finally saw PayPal admit to its ongoing interest, and embrace Bitcoin (and others) within its existing online payment services

gold-colored Bitcoin

The news has, within the crypto circles, been long anticipated. Following a disastrous attempt at collaborating with tech giants like Facebook and Mastercard on the Libra Project a while back, it looked as though PayPal may have gone shy on the idea altogether. That, coupled with the fact that interest in bitcoin and other cryptocurrencies among the ‘general digital public’ failed to take off in the way that was once predicted, made it seem as though a mainstream uptake of virtual currencies was nothing more than a pipe dream.


Of course, all that has now changed, and the company has finally enabled all users to buy, sell and store cryptocurrencies within its platform.
But, will this bring the average internet user to crypto for once and for all, or will the alternative currency remain relatively niche online, in spite of efforts to make it more accessible? Read more below.

Online Payment Services Are Adapting to User Requirements Better than Ever Before


In its heyday, PayPal was the go-to online payment service for anyone looking to make their digital dealings safer, more convenient, and more efficient. Rather than storing their personal details with multiple sites and companies, users could provide them once and once only, and allow PayPal to handle the security side of things.


The only issue was that PayPal was famed for its high transaction fees – both for merchants, and customers.


Now, the realm of online payment services has evolved to ensure that companies have fine-tuned their process for a relevant service – and that, in the process, transaction fees are kept competitive. In the realm of the online entertainment industry, digital casinos now offer Idebit deposit options for Canadian players over 18, for instance; in the US, vastly popular apps like Cash App and Venmo enable instant peer-to-peer payments with minimal processing fees.


There are two consequences to this evolution within the online payment services industry. For one, digital payment services are growing more attuned to the needs, concerns and demands of their users than ever before. They have to, if they are going to compete with the years in which PayPal has stood as the paradigm for payment security. This means that, for the average internet user, crypto will remain largely obsolete; they can feel safe in the payments they make online, and do not need to explore other avenues.


Secondly, it means that PayPal is facing significant competition on all sides, and that more and more users run the risk of abandoning the service altogether in favour of something cheaper, more convenient and easier to use.

Does the Average User Even Need Crypto?

PayPal is infamous for keeping the details of its new projects close to its chest, which means that we cannot be sure exactly what their motivations behind embracing crypto really are. Some already believe that it is ensuring a revolutionary stimulus for Bitcoin. It may simply be another move intended to ensure that they keep up with digital trends, rather than a fully-fledged commitment to the future of online payments.
In reality, many using the internet today have no need of crypto. Sure, it is safer and more private – something we all need to prioritize – but so are the services currently working to unseat PayPal at what it does best: simplicity.


Bitcoin is not simple – in fact, it is far from it. PayPal’s move toward the realm of virtual currencies does not make the technology itself any simple or more accessible to those who hold only limited knowledge about it, and only by targeting these user groups does it look likely that they will begin to embrace this alternative currency. For the Silo, Mildred Austria.

Cost Of Marijuana In 120 Cities And How Much Tax Revenue If Legalized

First a few quick facts….

● ‏Tokyo, Japan has the most expensive cannabis‏ ‏, at 32.66 USD per gram. ‏

● ‏Quito, Ecuador has the least expensive marijuana‏ ‏, at 1.34 USD per gram.‏

● ‏Based on the average US marijuana tax rates currently implemented, ‏ ‏New York City could generate the highest potential tax revenue by legalizing weed‏ ‏, with 156.40 million USD per year. New York City also has the highest consumption rate of cannabis, at 77.44 metric tons per year.‏

● ‏Cannabis costs ‏ ‏$7.82 per gram in Toronto, Canada‏ ‏. ‏

‏Berlin, Germany – ‏ ‏Automatic cultivator device, ‏ ‏Seedo‏ ‏, after much research and data gathering, previously released the 2018 Cannabis Price Index, detailing the cost of marijuana in 120 global cities. Seedo is one of the many new ventures embracing the newly legalized cannabis industry. Their main goal is to allow both medicinal and recreational consumers to grow their own supply, avoiding extra taxes and bypassing harmful pesticides. The aim of this study is to illustrate the continuous need for legislative reform on cannabis use around the world, and to determine if there are any lessons to be learned from those cities at the forefront of marijuana legalisation.

‏Although Seedo’s technology enables smokers to get off the grid, this study considers one of the biggest byproducts of legalising cannabis—the potential tax revenue for the local government body. For this reason, Seedo decided not only to research the cost of cannabis around the world, but also to calculate how much potential tax a city could generate if they were to legalise marijuana. ‏

‏The study began first by selecting 120 cities across the world, including locations where cannabis is currently legal, illegal and partially legal, and where marijuana consumption data is available. Then, they looked into the price of weed per gram in each city. To calculate how much potential tax a city could make by legalising weed, Seedo investigated how much tax is paid on the most popular brand of cigarettes, as this offers the closest comparison. They then looked at what percentage marijuana is currently taxed in cities where it’s already legalised in the US. ‏

‏“This study has revealed some incredible insights into the kind of tax revenue that legalising weed could generate.” says Uri Zeevi, CMO at Seedo. “Take New York City for instance, which has the highest consumption level in the study at 77.44 metric tons of cannabis per year. If they taxed marijuana at the average US cannabis tax level, the city could make $‏ ‏156.4‏ ‏ million in potential tax revenue per year. This is equivalent to providing nearly 3 months worth of free school meals to every single public school kid in New York City.” ‏

‏The table below reveals a sample of the results for ‏ ‏Toronto, Canada‏ ‏:‏

‏City‏

‏Legality‏

‏Price per gram, US$‏

‏Total possible tax collection, if taxed at cigarette level, mil US$‏

‏Total possible tax collection, if taxed at average US marijuana taxes, mil US$‏

‏Total consumption in metric tons‏

‏Toronto‏

‏Partial‏

‏7.82‏

‏124.15‏

‏33.38‏

‏22.75‏

‏The table below shows the ‏ ‏top 10 most and least expensive cities for cannabis‏ ‏:‏

‏Top 10 Most Expensive Cities‏

‏Top 10 Least Expensive Cities‏

‏#‏

‏City‏

‏Country‏

‏Legality‏

‏Price per gram, US$‏

‏#‏

‏City‏

‏Country‏

‏Legality‏

‏Price per gram, US$‏

‏1‏

‏Tokyo‏

‏Japan‏

‏Illegal‏

‏32.66‏

‏1‏

‏Quito‏

‏Ecuador‏

‏Partial‏

‏1.34‏

‏2‏

‏Seoul‏

‏South Korea‏

‏Illegal‏

‏32.44‏

‏2‏

‏Bogota‏

‏Colombia‏

‏Partial‏

‏2.20‏

‏3‏

‏Kyoto‏

‏Japan‏

‏Illegal‏

‏29.65‏

‏3‏

‏Asuncion‏

‏Paraguay‏

‏Partial‏

‏2.22‏

‏4‏

‏Hong Kong‏

‏China‏

‏Illegal‏

‏27.48‏

‏4‏

‏Jakarta‏

‏Indonesia‏

‏Illegal‏

‏3.79‏

‏5‏

‏Bangkok‏

‏Thailand‏

‏Partial‏

‏24.81‏

‏5‏

‏Panama City‏

‏Panama‏

‏Illegal‏

‏3.85‏

‏6‏

‏Dublin‏

‏Ireland‏

‏Illegal‏

‏21.63‏

‏6‏

‏Johannesburg‏

‏South Africa‏

‏Illegal‏

‏4.01‏

‏7‏

‏Tallinn‏

‏Estonia‏

‏Partial‏

‏20.98‏

‏7‏

‏Montevideo‏

‏Uruguay‏

‏Legal‏

‏4.15‏

‏8‏

‏Shanghai‏

‏China‏

‏Illegal‏

‏20.82‏

‏8‏

‏Astana‏

‏Kazakhstan‏

‏Illegal‏

‏4.22‏

‏9‏

‏Beijing‏

‏China‏

‏Illegal‏

‏20.52‏

‏9‏

‏Antwerp‏

‏Belgium‏

‏Partial‏

‏4.29‏

‏10‏

‏Oslo‏

‏Norway‏

‏Partial‏

‏19.14‏

‏10‏

‏New Delhi‏

‏India‏

‏Partial‏

‏4.38‏

‏N.B. These tables are a sample of the full results. To find the complete results for all 120 cities, please see the bottom of the press release. ‏

‏The table below shows the ‏ ‏top 10 cities who could generate the most potential tax ‏ ‏by legalising cannabis, if taxed at the same rate as the most popular cigarette brand:‏

‏#‏

‏City‏

‏Country‏

‏Legality‏

‏Price per gram, US$‏

‏% of cigarette tax‏

‏Possible tax revenue, mil US$ ‏

‏1‏

‏Cairo‏

‏Egypt‏

‏Illegal‏

‏16.15‏

‏73.13‏

‏384.87‏

‏2‏

‏New York‏

‏USA‏

‏Partial‏

‏10.76‏

‏42.54‏

‏354.48‏

‏3‏

‏London‏

‏UK‏

‏Illegal‏

‏9.20‏

‏82.16‏

‏237.35‏

‏4‏

‏Sydney‏

‏Australia‏

‏Partial‏

‏10.79‏

‏56.76‏

‏138.36‏

‏5‏

‏Karachi‏

‏Pakistan‏

‏Illegal‏

‏5.32‏

‏60.7‏

‏135.48‏

‏6‏

‏Melbourne‏

‏Australia‏

‏Partial‏

‏10.84‏

‏56.76‏

‏132.75‏

‏7‏

‏Moscow‏

‏Russia‏

‏Partial‏

‏11.84‏

‏47.63‏

‏128.97‏

‏8‏

‏Toronto‏

‏Canada‏

‏Partial‏

‏7.82‏

‏69.8‏

‏124.15‏

‏9‏

‏Chicago‏

‏USA‏

‏Partial‏

‏11.46‏

‏42.54‏

‏119.61‏

‏10‏

‏Berlin‏

‏Germany‏

‏Partial‏

‏13.53‏

‏72.9‏

‏114.77‏

‏N.B. % of cigarette tax refers to the tax percentage on the most popular brand. Possible tax revenue refers to the total possible tax collection per year, if taxed at cigarette level. For a full explanation of how the study was conducted, please see the methodology at the bottom of the press release. ‏

‏The table below shows the ‏ ‏top 10 cities who could generate the most potential tax‏ ‏ by legalising cannabis, if taxed at the average US marijuana tax rate:‏

‏#‏

‏City‏

‏Country‏

‏Legality‏

‏Price per gram, US$‏

‏Possible tax revenue, mil US$‏

‏1‏

‏New York‏

‏USA‏

‏Partial‏

‏10.76‏

‏156.4‏

‏2‏

‏Cairo‏

‏Egypt‏

‏Illegal‏

‏16.15‏

‏98.78‏

‏3‏

‏London‏

‏UK‏

‏Illegal‏

‏9.20‏

‏54.22‏

‏4‏

‏Chicago‏

‏USA‏

‏Partial‏

‏11.46‏

‏52.77‏

‏5‏

‏Moscow‏

‏Russia‏

‏Partial‏

‏11.84‏

‏50.82‏

‏6‏

‏Sydney‏

‏Australia‏

‏Partial‏

‏10.79‏

‏45.75‏

‏7‏

‏Melbourne‏

‏Australia‏

‏Partial‏

‏10.84‏

‏43.9‏

‏8‏

‏Karachi‏

‏Pakistan‏

‏Illegal‏

‏5.32‏

‏41.89‏

‏9‏

‏Houston‏

‏USA‏

‏Partial‏

‏10.03‏

‏39.32‏

‏10‏

‏Toronto‏

‏Canada‏

‏Partial‏

‏7.82‏

‏33.38‏

‏N.B. Possible tax revenue refers to the total possible tax collection per year, if taxed at average US marijuana tax rate.‏

‏The table below shows the‏ ‏ top 10 cities with the highest and lowest consumption of cannabis, ‏ ‏per year:‏

‏Highest Consumers of Cannabis‏

‏ Lowest Consumers of Cannabis‏

‏#‏

‏City‏

‏Country‏

‏Legality‏

‏Price per gram, US$‏

‏Total consumption, metric tons‏

‏#‏

‏City‏

‏Country‏

‏Legality‏

‏Price per gram, US$‏

‏Total consumption, metric tons‏

‏1‏

‏New York‏

‏USA‏

‏Partial‏

‏10.76‏

‏77.44‏

‏1‏

‏Singapore‏

‏Singapore‏

‏Illegal‏

‏14.01‏

‏0.02‏

‏2‏

‏Karachi‏

‏Pakistan‏

‏Illegal‏

‏5.32‏

‏41.95‏

‏2‏

‏Santo Domingo‏

‏Dominican Rep.‏

‏Illegal‏

‏6.93‏

‏0.16‏

‏3‏

‏New Delhi‏

‏India‏

‏Partial‏

‏4.38‏

‏38.26‏

‏3‏

‏Kyoto‏

‏Japan‏

‏Illegal‏

‏29.65‏

‏0.24‏

‏4‏

‏Los Angeles‏

‏USA‏

‏Legal‏

‏8.14‏

‏36.06‏

‏4‏

‏Thessaloniki‏

‏Greece‏

‏Partial‏

‏13.49‏

‏0.29‏

‏5‏

‏Cairo‏

‏Egypt‏

‏Illegal‏

‏16.15‏

‏32.59‏

‏5‏

‏Luxembourg City‏

‏Luxembourg‏

‏Partial‏

‏7.26‏

‏0.32‏

‏6‏

‏Mumbai‏

‏India‏

‏Partial‏

‏4.57‏

‏32.38‏

‏6‏

‏Panama City‏

‏Panama‏

‏Illegal‏

‏3.85‏

‏0.37‏

‏7‏

‏London‏

‏UK‏

‏Illegal‏

‏9.20‏

‏31.4‏

‏7‏

‏Reykjavik‏

‏Iceland‏

‏Illegal‏

‏15.92‏

‏0.44‏

‏8‏

‏Chicago‏

‏USA‏

‏Partial‏

‏11.46‏

‏24.54‏

‏8‏

‏Asuncion‏

‏Paraguay‏

‏Partial‏

‏2.22‏

‏0.46‏

‏9‏

‏Moscow‏

‏Russia‏

‏Partial‏

‏11.84‏

‏22.87‏

‏9‏

‏Colombo‏

‏Sri Lanka‏

‏Illegal‏

‏9.12‏

‏0.59‏

‏10‏

‏Toronto‏

‏Canada‏

‏Partial‏

‏7.82‏

‏22.75‏

‏10‏

‏Manila‏

‏Philippines‏

‏Illegal‏

‏5.24‏

‏0.6‏

‏N.B. Total consumption is calculated per annum. ‏

‏Additional quotes:‏

‏“The way that the legalised cannabis industry is rapidly evolving alongside new technologies shows how innovative emerging tech companies are today.” says Uri Zeevi, CMO at Seedo. “Take the way that cannabis and cryptocurrency have joined forces, with ‏ ‏examples such as HempCoin or nezly, which manage processes and payments in the new marijuana industry.‏ ‏ When you consider too the potential that these new technologies have to disrupt the cannabis industry, there’s no denying that these are very exciting times.” ‏

‏“At Seedo, we’ve built technology that helps regular smokers to grow cannabis plants of the utmost quality from the comfort of their own home, avoiding pesticides and taking ownership of their personal supply.” says Uri Zeevi, CMO at Seedo. “We believe that by understanding the cost of weed around the world, we can help to educate smokers about the potential financial benefits of hydroponic growing technology.” ‏

‏“That illegal cannabis use is so high in countries that still carry the death penalty, such as Pakistan and Egypt, those in power ought to see how desperately new legislation is needed.” comments Uri Zeevi, CMO at Seedo. “By removing the criminal element from marijuana, governments will then able to more safely regulate production, take away power from underground gangs, and as we’ve shown in this study, generate huge tax revenues.”‏

‏Further findings:‏

● ‏New York City, USA has the highest consumption rate of cannabis‏ ‏, at 77.44 metric tons per year.‏

● ‏Boston, USA has the most expensive cannabis of all the cities where it’s legal‏ ‏, at 11.01 USD, while Montevideo, Uruguay has the least expensive at 4.15 USD. ‏

● ‏While Tokyo, Japan has the most expensive cannabis of all cities where it’s illegal, at 32.66 USD, ‏ ‏Jakarta, Indonesia has the least expensive at 3.79 USD, despite being classed as a Group 1 drug with harsh sentences such as life imprisonment and the death penalty.‏ ‏ ‏

● ‏For cities where cannabis is partially legal, Bangkok, Thailand has the most expensive at 24.81 USD, while Quito, Ecuador has the least expensive at 1.34 USD. ‏

● ‏Bulgaria has the highest tax rates for the most popular brand of cigarettes, at 82.65%, while Paraguay has the lowest, with rates of 16%. ‏

● ‏Cairo, Egypt would gain the most revenue in tax if they were to legalise cannabis‏ ‏ and tax it as the same rate as cigarettes, at 384.87 million USD. Singapore, Singapore would gain the least, at 0.14 million USD, due in part to the city’s low consumption of marijuana at 0.02 metric tons per annum.‏

● ‏Based on the average US marijuana tax rates currently implemented,‏ ‏ New York City could generate the highest potential tax revenue by legalising weed, with 156.4 million USD per year‏ ‏. Singapore, Singapore would gain the least, at 0.04 million USD

‏About “Seedo”‏ ‏: Seedo is a fully automated hydroponic growing device which lets you grow your own medicinal herbs and vegetables from the comfort of your own home. Seedo controls and monitors the growing process, from seed to plant, while providing optimal lab conditions to assure premium quality produce year-round. Seedo’s goal is to simplify the growing process, making it accessible for everyone, without compromising on quality. ‏

‏The full results of the 2018 Cannabis Price Index:‏

‏#‏

‏City‏

‏Country‏

‏Legality‏

‏Price per gram, US$‏

‏Taxes of cigarettes, % of the most sold brand‏

‏Total possible tax collection, if taxed at cigarette level, mil US$‏

‏Total possible tax collection, if taxed at average US marijuana taxes, mil US$‏

‏Total Consumption in metric tons‏

‏1‏

‏Tokyo‏

‏Japan‏

‏Illegal‏

‏32.66‏

‏64.36‏

‏32.14‏

‏9.37‏

‏1.53‏

‏2‏

‏Seoul‏

‏South Korea‏

‏Illegal‏

‏32.44‏

‏61.99‏

‏31.61‏

‏9.57‏

‏1.57‏

‏3‏

‏Kyoto‏

‏Japan‏

‏Illegal‏

‏29.65‏

‏64.36‏

‏4.64‏

‏1.35‏

‏0.24‏

‏4‏

‏Hong Kong‏

‏China‏

‏Illegal‏

‏27.48‏

‏44.43‏

‏19.72‏

‏8.33‏

‏1.62‏

‏5‏

‏Bangkok‏

‏Thailand‏

‏Partial‏

‏24.81‏

‏73.13‏

‏99.11‏

‏25.44‏

‏5.46‏

‏6‏

‏Dublin‏

‏Ireland‏

‏Illegal‏

‏21.63‏

‏77.80‏

‏29.31‏

‏7.07‏

‏1.74‏

‏7‏

‏Tallinn‏

‏Estonia‏

‏Partial‏

‏20.98‏

‏77.24‏

‏22.13‏

‏5.38‏

‏1.37‏

‏8‏

‏Shanghai‏

‏China‏

‏Illegal‏

‏20.82‏

‏44.43‏

‏49.12‏

‏20.75‏

‏5.31‏

‏9‏

‏Beijing‏

‏China‏

‏Illegal‏

‏20.52‏

‏44.43‏

‏43.10‏

‏18.21‏

‏4.73‏

‏10‏

‏Oslo‏

‏Norway‏

‏Partial‏

‏19.14‏

‏68.83‏

‏19.28‏

‏5.26‏

‏1.46‏

‏11‏

‏Washington, DC‏

‏USA‏

‏Partial‏

‏18.08‏

‏42.54‏

‏47.51‏

‏20.96‏

‏6.18‏

‏12‏

‏Cairo‏

‏Egypt‏

‏Illegal‏

‏16.15‏

‏73.13‏

‏384.87‏

‏98.78‏

‏32.59‏

‏13‏

‏Reykjavik‏

‏Iceland‏

‏Illegal‏

‏15.92‏

‏56.40‏

‏3.97‏

‏1.32‏

‏0.44‏

‏14‏

‏Belfast‏

‏Ireland‏

‏Illegal‏

‏15.81‏

‏77.80‏

‏13.55‏

‏3.27‏

‏1.10‏

‏15‏

‏Minsk‏

‏Belarus‏

‏Illegal‏

‏15.80‏

‏51.15‏

‏9.08‏

‏3.33‏

‏1.12‏

‏16‏

‏Athens‏

‏Greece‏

‏Partial‏

‏14.95‏

‏79.95‏

‏7.42‏

‏1.74‏

‏0.62‏

‏17‏

‏Auckland‏

‏New Zealand‏

‏Partial‏

‏14.77‏

‏77.34‏

‏106.03‏

‏25.73‏

‏9.28‏

‏18‏

‏Munich‏

‏Germany‏

‏Partial‏

‏14.56‏

‏72.90‏

‏50.90‏

‏13.10‏

‏4.80‏

‏19‏

‏Helsinki‏

‏Finland‏

‏Partial‏

‏14.42‏

‏81.53‏

‏27.12‏

‏6.24‏

‏2.31‏

‏20‏

‏Singapore‏

‏Singapore‏

‏Illegal‏

‏14.01‏

‏66.23‏

‏0.14‏

‏0.04‏

‏0.02‏

‏21‏

‏Berlin‏

‏Germany‏

‏Partial‏

‏13.53‏

‏72.90‏

‏114.77‏

‏29.55‏

‏11.64‏

‏22‏

‏Stuttgart‏

‏Germany‏

‏Partial‏

‏13.50‏

‏72.90‏

‏20.20‏

‏5.20‏

‏2.05‏

‏23‏

‏Thessaloniki‏

‏Greece‏

‏Partial‏

‏13.49‏

‏79.95‏

‏3.17‏

‏0.75‏

‏0.29‏

‏24‏

‏Stockholm‏

‏Sweden‏

‏Illegal‏

‏13.20‏

‏68.84‏

‏15.06‏

‏4.11‏

‏1.66‏

‏25‏

‏Vienna‏

‏Austria‏

‏Partial‏

‏12.87‏

‏74.00‏

‏59.21‏

‏15.02‏

‏6.22‏

‏26‏

‏Copenhagen‏

‏Denmark‏

‏Partial‏

‏12.47‏

‏74.75‏

‏20.65‏

‏5.18‏

‏2.22‏

‏27‏

‏Moscow‏

‏Russia‏

‏Partial‏

‏11.84‏

‏47.63‏

‏128.97‏

‏50.82‏

‏22.87‏

‏28‏

‏Hamburg‏

‏Germany‏

‏Partial‏

‏11.64‏

‏72.90‏

‏50.16‏

‏12.92‏

‏5.91‏

‏29‏

‏Chicago‏

‏USA‏

‏Partial‏

‏11.46‏

‏42.54‏

‏119.61‏

‏52.77‏

‏24.54‏

‏30‏

‏Philadelphia‏

‏USA‏

‏Partial‏

‏11.30‏

‏42.54‏

‏68.37‏

‏30.16‏

‏14.22‏

‏31‏

‏Bucharest‏

‏Romania‏

‏Partial‏

‏11.18‏

‏75.41‏

‏17.23‏

‏4.29‏

‏2.04‏

‏32‏

‏Cologne‏

‏Germany‏

‏Partial‏

‏11.14‏

‏72.90‏

‏28.51‏

‏7.34‏

‏3.51‏

‏33‏

‏Geneva‏

‏Switzerland‏

‏Partial‏

‏11.12‏

‏61.20‏

‏5.90‏

‏1.81‏

‏0.87‏

‏34‏

‏Boston‏

‏USA‏

‏Legal‏

‏11.01‏

‏42.54‏

‏28.59‏

‏12.61‏

‏6.10‏

‏35‏

‏Adelaide‏

‏Australia‏

‏Partial‏

‏10.91‏

‏56.76‏

‏41.60‏

‏13.75‏

‏6.72‏

‏36‏

‏Istanbul‏

‏Turkey‏

‏Partial‏

‏10.87‏

‏82.13‏

‏21.79‏

‏4.98‏

‏2.44‏

‏37‏

‏Melbourne‏

‏Australia‏

‏Partial‏

‏10.84‏

‏56.76‏

‏132.75‏

‏43.90‏

‏21.58‏

‏38‏

‏Sydney‏

‏Australia‏

‏Partial‏

‏10.79‏

‏56.76‏

‏138.36‏

‏45.75‏

‏22.59‏

‏39‏

‏New York‏

‏USA‏

‏Partial‏

‏10.76‏

‏42.54‏

‏354.48‏

‏156.40‏

‏77.44‏

‏40‏

‏Düsseldorf‏

‏Germany‏

‏Partial‏

‏10.70‏

‏72.90‏

‏15.82‏

‏4.07‏

‏2.03‏

‏41‏

‏Brisbane‏

‏Australia‏

‏Partial‏

‏10.63‏

‏56.76‏

‏66.88‏

‏22.12‏

‏11.09‏

‏42‏

‏Hanover‏

‏Germany‏

‏Partial‏

‏10.51‏

‏72.90‏

‏13.46‏

‏3.47‏

‏1.76‏

‏43‏

‏Prague‏

‏Czech Rep.‏

‏Partial‏

‏10.47‏

‏77.42‏

‏63.95‏

‏15.50‏

‏7.89‏

‏44‏

‏Frankfurt‏

‏Germany‏

‏Partial‏

‏10.29‏

‏72.90‏

‏18.06‏

‏4.65‏

‏2.41‏

‏45‏

‏Wellington‏

‏New Zealand‏

‏Partial‏

‏10.11‏

‏77.34‏

‏19.53‏

‏4.74‏

‏2.50‏

‏46‏

‏Dallas‏

‏USA‏

‏Partial‏

‏10.03‏

‏42.54‏

‏51.01‏

‏22.50‏

‏11.95‏

‏47‏

‏Houston‏

‏USA‏

‏Partial‏

‏10.03‏

‏42.54‏

‏89.13‏

‏39.32‏

‏20.89‏

‏48‏

‏Vilnius‏

‏Lithuania‏

‏Illegal‏

‏10.00‏

‏75.76‏

‏5.20‏

‏1.29‏

‏0.69‏

‏49‏

‏Zurich‏

‏Switzerland‏

‏Partial‏

‏9.71‏

‏61.20‏

‏10.33‏

‏3.17‏

‏1.74‏

‏50‏

‏Montpellier‏

‏France‏

‏Illegal‏

‏9.70‏

‏80.30‏

‏12.21‏

‏2.85‏

‏1.57‏

‏51‏

‏Canberra‏

‏Australia‏

‏Partial‏

‏9.65‏

‏56.76‏

‏10.96‏

‏3.63‏

‏2.00‏

‏52‏

‏Zagreb‏

‏Croatia‏

‏Partial‏

‏9.43‏

‏75.26‏

‏24.35‏

‏6.07‏

‏3.43‏

‏53‏

‏Nice‏

‏France‏

‏Illegal‏

‏9.40‏

‏80.30‏

‏15.80‏

‏3.69‏

‏2.09‏

‏54‏

‏Phoenix‏

‏USA‏

‏Partial‏

‏9.35‏

‏42.54‏

‏58.26‏

‏25.71‏

‏14.65‏

‏55‏

‏Paris‏

‏France‏

‏Illegal‏

‏9.30‏

‏80.30‏

‏102.25‏

‏23.90‏

‏13.69‏

‏56‏

‏Miami‏

‏USA‏

‏Partial‏

‏9.27‏

‏42.54‏

‏16.24‏

‏7.16‏

‏4.12‏

‏57‏

‏San Francisco‏

‏USA‏

‏Legal‏

‏9.27‏

‏42.54‏

‏30.94‏

‏13.65‏

‏7.85‏

‏58‏

‏London‏

‏UK‏

‏Illegal‏

‏9.20‏

‏82.16‏

‏237.35‏

‏54.22‏

‏31.40‏

‏59‏

‏Colombo‏

‏Sri Lanka‏

‏Illegal‏

‏9.12‏

‏73.78‏

‏3.98‏

‏1.01‏

‏0.59‏

‏60‏

‏Riga‏

‏Latvia‏

‏Illegal‏

‏9.00‏

‏76.89‏

‏10.23‏

‏2.50‏

‏1.48‏

‏61‏

‏Bratislava‏

‏Slovakia‏

‏Illegal‏

‏8.92‏

‏81.54‏

‏7.24‏

‏1.67‏

‏1.00‏

‏62‏

‏Milan‏

‏Italy‏

‏Partial‏

‏8.85‏

‏75.68‏

‏46.06‏

‏11.42‏

‏6.88‏

‏63‏

‏Varna‏

‏Bulgaria‏

‏Illegal‏

‏8.83‏

‏82.65‏

‏4.84‏

‏1.10‏

‏0.66‏

‏64‏

‏Marseille‏

‏France‏

‏Illegal‏

‏8.69‏

‏80.30‏

‏36.23‏

‏8.47‏

‏5.19‏

‏65‏

‏Glasgow‏

‏UK‏

‏Illegal‏

‏8.65‏

‏82.16‏

‏15.21‏

‏3.47‏

‏2.14‏

‏66‏

‏Toulouse‏

‏France‏

‏Illegal‏

‏8.62‏

‏80.30‏

‏18.67‏

‏4.36‏

‏2.70‏

‏67‏

‏Birmingham‏

‏UK‏

‏Illegal‏

‏8.58‏

‏82.16‏

‏27.73‏

‏6.34‏

‏3.93‏

‏68‏

‏Kuala Lumpur‏

‏Malaysia‏

‏Illegal‏

‏8.54‏

‏55.36‏

‏6.61‏

‏2.24‏

‏1.40‏

‏69‏

‏Monterrey‏

‏Mexico‏

‏Partial‏

‏8.45‏

‏65.87‏

‏4.17‏

‏1.19‏

‏0.75‏

‏70‏

‏Edinburgh‏

‏UK‏

‏Illegal‏

‏8.41‏

‏82.16‏

‏12.22‏

‏2.79‏

‏1.77‏

‏71‏

‏Lisbon‏

‏Portugal‏

‏Partial‏

‏8.36‏

‏74.51‏

‏4.69‏

‏1.18‏

‏0.75‏

‏72‏

‏Strasbourg‏

‏France‏

‏Illegal‏

‏8.35‏

‏80.30‏

‏11.13‏

‏2.60‏

‏1.66‏

‏73‏

‏Warsaw‏

‏Poland‏

‏Partial‏

‏8.31‏

‏80.29‏

‏29.27‏

‏6.84‏

‏4.39‏

‏74‏

‏Lyon‏

‏France‏

‏Illegal‏

‏8.20‏

‏80.30‏

‏19.45‏

‏4.55‏

‏2.95‏

‏75‏

‏Los Angeles‏

‏USA‏

‏Legal‏

‏8.14‏

‏42.54‏

‏124.88‏

‏55.10‏

‏36.06‏

‏76‏

‏Liverpool‏

‏UK‏

‏Illegal‏

‏7.94‏

‏82.16‏

‏10.86‏

‏2.48‏

‏1.67‏

‏77‏

‏Amsterdam‏

‏Netherlands‏

‏Partial‏

‏7.89‏

‏73.40‏

‏20.94‏

‏5.35‏

‏3.61‏

‏78‏

‏Manchester‏

‏UK‏

‏Illegal‏

‏7.88‏

‏82.16‏

‏58.99‏

‏13.48‏

‏9.11‏

‏79‏

‏Rome‏

‏Italy‏

‏Partial‏

‏7.86‏

‏75.68‏

‏88.16‏

‏21.86‏

‏14.82‏

‏80‏

‏Toronto‏

‏Canada‏

‏Partial‏

‏7.82‏

‏69.80‏

‏124.15‏

‏33.38‏

‏22.75‏

‏81‏

‏Denver‏

‏USA‏

‏Legal‏

‏7.79‏

‏42.54‏

‏20.53‏

‏9.06‏

‏6.20‏

‏82‏

‏Naples‏

‏Italy‏

‏Partial‏

‏7.75‏

‏75.68‏

‏29.82‏

‏7.40‏

‏5.08‏

‏83‏

‏Leeds‏

‏UK‏

‏Illegal‏

‏7.67‏

‏82.16‏

‏16.93‏

‏3.87‏

‏2.69‏

‏84‏

‏Seattle‏

‏USA‏

‏Legal‏

‏7.58‏

‏42.54‏

‏20.59‏

‏9.08‏

‏6.39‏

‏85‏

‏Madrid‏

‏Spain‏

‏Partial‏

‏7.47‏

‏78.09‏

‏93.40‏

‏22.45‏

‏16.01‏

‏86‏

‏Calgary‏

‏Canada‏

‏Partial‏

‏7.30‏

‏69.80‏

‏52.23‏

‏14.05‏

‏10.25‏

‏87‏

‏Luxembourg City‏

‏Luxembourg‏

‏Partial‏

‏7.26‏

‏70.24‏

‏1.62‏

‏0.43‏

‏0.32‏

‏88‏

‏San Jose‏

‏Costa Rica‏

‏Partial‏

‏7.23‏

‏69.76‏

‏7.84‏

‏2.11‏

‏1.56‏

‏89‏

‏Buenos Aires‏

‏Argentina‏

‏Partial‏

‏7.13‏

‏69.84‏

‏25.32‏

‏6.81‏

‏5.09‏

‏90‏

‏Brussels‏

‏Belgium‏

‏Partial‏

‏7.09‏

‏75.92‏

‏15.50‏

‏3.83‏

‏2.88‏

‏91‏

‏Santo Domingo‏

‏Dominican Rep.‏

‏Illegal‏

‏6.93‏

‏58.87‏

‏0.67‏

‏0.21‏

‏0.16‏

‏92‏

‏Graz‏

‏Austria‏

‏Partial‏

‏6.84‏

‏74.00‏

‏4.81‏

‏1.22‏

‏0.95‏

‏93‏

‏Budapest‏

‏Hungary‏

‏Illegal‏

‏6.74‏

‏77.26‏

‏7.70‏

‏1.87‏

‏1.48‏

‏94‏

‏Sofia‏

‏Bulgaria‏

‏Illegal‏

‏6.66‏

‏82.65‏

‏12.83‏

‏2.91‏

‏2.33‏

‏95‏

‏Ottawa‏

‏Canada‏

‏Partial‏

‏6.62‏

‏69.80‏

‏35.43‏

‏9.53‏

‏7.67‏

‏96‏

‏Vancouver‏

‏Canada‏

‏Partial‏

‏6.40‏

‏69.80‏

‏23.44‏

‏6.30‏

‏5.25‏

‏97‏

‏Sao Paulo‏

‏Brazil‏

‏Partial‏

‏6.38‏

‏64.94‏

‏68.55‏

‏19.81‏

‏16.55‏

‏98‏

‏Rotterdam‏

‏Netherlands‏

‏Partial‏

‏6.33‏

‏73.40‏

‏12.75‏

‏3.26‏

‏2.74‏

‏99‏

‏Ljubljana‏

‏Slovenia‏

‏Partial‏

‏6.32‏

‏80.41‏

‏3.43‏

‏0.80‏

‏0.67‏

‏100‏

‏Barcelona‏

‏Spain‏

‏Partial‏

‏6.23‏

‏78.09‏

‏39.59‏

‏9.51‏

‏8.14‏

‏101‏

‏Montreal‏

‏Canada‏

‏Partial‏

‏6.15‏

‏69.80‏

‏60.52‏

‏16.27‏

‏14.10‏

‏102‏

‏Kiev‏

‏Ukraine‏

‏Partial‏

‏6.00‏

‏74.78‏

‏14.73‏

‏3.70‏

‏3.28‏

‏103‏

‏Abuja‏

‏Nigeria‏

‏Illegal‏

‏5.88‏

‏20.63‏

‏7.40‏

‏6.73‏

‏6.10‏

‏104‏

‏Lima‏

‏Peru‏

‏Partial‏

‏5.88‏

‏37.83‏

‏12.28‏

‏6.09‏

‏5.52‏

‏105‏

‏Mexico City‏

‏Mexico‏

‏Partial‏

‏5.87‏

‏65.87‏

‏22.58‏

‏6.43‏

‏5.84‏

‏106‏

‏Cape Town‏

‏South Africa‏

‏Illegal‏

‏5.82‏

‏48.80‏

‏2.47‏

‏0.95‏

‏0.87‏

‏107‏

‏Karachi‏

‏Pakistan‏

‏Illegal‏

‏5.32‏

‏60.70‏

‏135.48‏

‏41.89‏

‏41.95‏

‏108‏

‏Manila‏

‏Philippines‏

‏Illegal‏

‏5.24‏

‏74.27‏

‏2.32‏

‏0.59‏

‏0.60‏

‏109‏

‏Rio de Janeiro‏

‏Brazil‏

‏Partial‏

‏5.11‏

‏64.94‏

‏28.82‏

‏8.33‏

‏8.69‏

‏110‏

‏Mumbai‏

‏India‏

‏Partial‏

‏4.57‏

‏60.39‏

‏89.38‏

‏27.78‏

‏32.38‏

‏111‏

‏New Delhi‏

‏India‏

‏Partial‏

‏4.38‏

‏60.39‏

‏101.20‏

‏31.45‏

‏38.26‏

‏112‏

‏Antwerp‏

‏Belgium‏

‏Partial‏

‏4.29‏

‏75.92‏

‏4.10‏

‏1.01‏

‏1.26‏

‏113‏

‏Astana‏

‏Kazakhstan‏

‏Illegal‏

‏4.22‏

‏39.29‏

‏1.78‏

‏0.85‏

‏1.07‏

‏114‏

‏Montevideo‏

‏Uruguay‏

‏Legal‏

‏4.15‏

‏66.75‏

‏19.54‏

‏5.50‏

‏7.06‏

‏115‏

‏Johannesburg‏

‏South Africa‏

‏Illegal‏

‏4.01‏

‏48.80‏

‏3.76‏

‏1.45‏

‏1.92‏

‏116‏

‏Panama City‏

‏Panama‏

‏Illegal‏

‏3.85‏

‏56.52‏

‏0.81‏

‏0.27‏

‏0.37‏

‏117‏

‏Jakarta‏

‏Indonesia‏

‏Illegal‏

‏3.79‏

‏53.40‏

‏1.92‏

‏0.68‏

‏0.95‏

‏118‏

‏Asuncion‏

‏Paraguay‏

‏Partial‏

‏2.22‏

‏16.00‏

‏0.16‏

‏0.19‏

‏0.46‏

‏119‏

‏Bogota‏

‏Colombia‏

‏Partial‏

‏2.20‏

‏49.44‏

‏15.80‏

‏6.00‏

‏14.53‏

‏120‏

‏Quito‏

‏Ecuador‏

‏Partial‏

‏1.34‏

‏70.39‏

‏0.56‏

‏0.15‏

‏0.60‏

‏Methodology‏

‏Selection of the cities:‏

‏To select the cities for the study, Seedo first looked at the top and bottom cannabis consuming countries around the world. Then they analysed nations where marijuana is partially or completely legal, as well as illegal, and selected the final list of 120 cities in order to best offer a representative comparison of the global cannabis price. ‏

‏Data:‏

● ‏Price per gram, US$ ‏ ‏- Crowdsourced city-level surveys adjusted to World Drug Report 2017 of the United Nations Office on Drugs and Crime.‏

● ‏Taxes on Cigarettes, % of the most sold brand‏ ‏ – Taxes as a percentage of the retail price of the most sold brand (total tax). ‏ ‏Source‏ ‏: Appendix 2 of the WHO report on the global tobacco epidemic, 2015.‏

● ‏Annual possible tax collection is calculated in the following way: ‏

● ‏Total_Possible_Tax=Population_City*Prevalence*Avg_Consumption_year_gr*price*tax_level, where:‏

● ‏Population: latest available local population data sources.‏

● ‏Annual Prevalence (percentage of population, having used weed in the year). Source: World Drug Report 2017 of the United Nations Office on Drugs and Crime‏

● ‏Average Consumption of weed per year in grams (people who consumed weed at least once in the previous year). ‏

● ‏Estimation, with the assumption, that one use of weed on average means one joint. ‏

● ‏One joint is assumed to have 0.66 grams of weed as in the paper of Mariani, Brooks, Haney and Levin (2010). ‏

● ‏The distribution of use during the year is assumed to be the same as in Zhao and Harris (2004), where the yearly usage varies from once or twice a year to everyday.‏

● ‏Total Consumption in Tons‏

● ‏Consumption=Population*Prevalence*Consumption_year_gr‏

● ‏Population: latest available local population data sources.‏

● ‏Annual Prevalence (percentage of population, having used weed in the year). ‏ ‏Source‏ ‏: World Drug Report 2017 of the United Nations Office on Drugs and Crime‏

● ‏Average Consumption of weed per year in grams (people who consumed weed at least once in the previous year).‏

● ‏Estimation, with the assumption, that one use of weed on average means one joint. ‏

● ‏One joint is assumed to have 0.66 grams of weed as in the paper of Mariani, Brooks, Haney and Levin (2010). ‏

● ‏The distribution of use during the year is assumed to be the same as in Zhao and Harris (2004), where the yearly usage varies from once or twice a year to everyday. ‏

● ‏US tax level ‏ ‏- Average tax level in the states of US where weed is legal: Alaska, California, Colorado, Maine, Massachusetts, Nevada, Oregon and Washington. Includes retail sales taxes, state taxes, local taxes and excise taxes.‏

● ‏Legality‏

○ ‏Legal, if possession and selling for recreational and medical use is legal.‏

○ ‏Illegal, if possession and selling for recreational and medical use is illegal.‏

○ ‏Partial, if ‏

■ ‏Possession of small amounts is decriminalised (criminal penalties lessened, fines and regulated permits may still apply)‏

■ ‏OR medicinal use legal‏

■ ‏OR possession is legal, selling illegal‏

■ ‏OR scientific use legal‏

■ ‏OR usage allowed in restricted areas (e.g. homes or coffee shops)‏

■ ‏OR local laws may apply to legality (e.g. illegal at federal level, legal at state level)‏

‏First quote: Based on New York City Council’s free lunch initiative which began in September 2017, with 1.1 million public school children, at a cost of $1.75 per child per day.‏

High Tech Houseplants That grow air

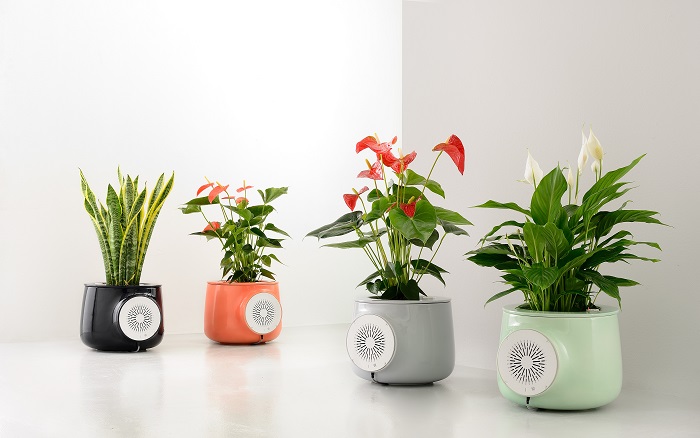
Clairy is an astounding handcrafted object that monitors your indoor air quality and when VOCs (Volatile Organic Compounds such as cigarettes, solvents, pesticides, copy machine chemicals etc.) levels are bad, eliminates pollution in your home. It makes you and your beloved ones breathe better and live better. It is much more than a pretty houseplant.

How is that possible?

Following an 80s NASA Clean Air Program research project, Clairy uses the power of specific species of plants to trap the air pollutants into their roots. That’s why it doesn’t need filters: the plant is the filter!

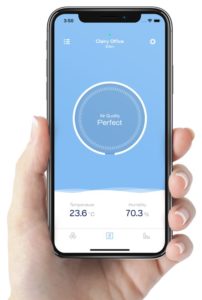
Clairy smartphone appClairy has also tech sensors that communicate with an app, so you can check directly the levels of humidity, temperature, and VOCs of your home with your smartphone.


What makes Clairy so beautiful?

It’s 100% Made in Italy by the artisans of Nove, near Vicenza, where the techniques of working with ceramics have been transmitted from father to son for centuries.

You can choose from four different colors: Corallo, Alabastro, Acquamarina and Blu Mare.

You should also consider our Premium Edition, Nero and Rame, made with the special technique called “Terzo Fuoco”. A masterpiece of Italian design you must have in your home. Holiday time is approaching, and we all want to give a gift that can be beautiful and useful at the same time. Clairy is the answer. For the Silo, Andrea Passador. 

Warhol, Lichtenstein Art Auction look back

Is it us or is there something 'photoshop' and 'meme'-like to Warhol's work? CP

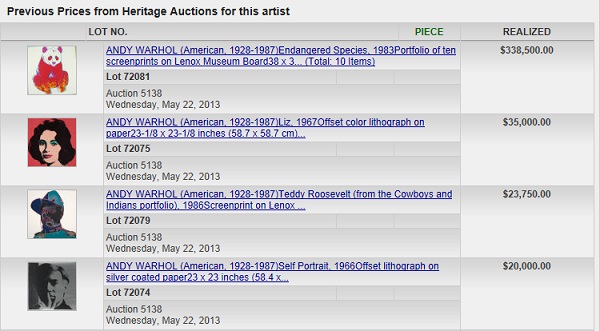
Almost one decade ago: Andy Warhol’s “Endangered Species and Ads” prints bring a combined $677,000 USD alone at this notable Modern and Contemporary Art event.

Two complete portfolios by Andy Warhol, Endangered Species, 1983 and Ads, 1985, sold for $338,500 USD each to far exceed their estimates among a field of fresh-to-market iconic works during Heritage Auctions’ $2.9 million USD Modern and Contemporary Art Signature® Auction, May 22 in Dallas.

The auction sold 90% by value and 78% by lot.

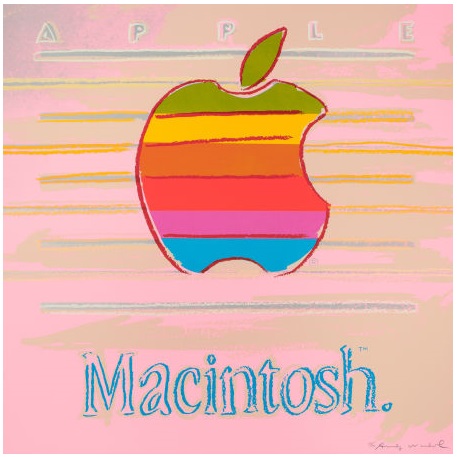
Close up of one of the ten screenprints up for auction by ANDY WARHOL (American, 1928-1987) Ads, 1985 Portfolio of ten screenprints on Lenox Museum Board 38 x 38 inches (96.5 x 96.5 cm) Ed. 50/190 Each signed and numbered in pencil Printed by Rupert Jasen Smith, New York Published by Ronald Feldman Fine Arts, Inc., New York PROVENANCE: Private collection, Texas LITERATURE: Feldman & Schellmann, II.350-359 Warhol, Andy:. American painter, photographer, filmaker and publisher, 1928-1987
Close up of one of the ten screenprints up for auction by ANDY WARHOL (American, 1928-1987)
Ads, 1985
Portfolio of ten screenprints on Lenox Museum Board
38 x 38 inches (96.5 x 96.5 cm)
Ed. 50/190
Each signed and numbered in pencil
Printed by Rupert Jasen Smith, New York
Published by Ronald Feldman Fine Arts, Inc., New York
PROVENANCE:
Private collection, Texas
LITERATURE:
Feldman & Schellmann, II.350-359
Warhol, Andy:. American painter, photographer, filmaker and publisher, 1928-1987

Here's a look at some of the other Warhol auctions. Endangered Species earned over 1/3 of a million dollars. CP

ANDY WARHOL (American, 1928-1987)

Ads, 1985

Portfolio of ten screenprints on Lenox Museum Board

38 x 38 inches (96.5 x 96.5 cm)

Ed. 50/190

Each signed and numbered in pencil

Printed by Rupert Jasen Smith, New York

Published by Ronald Feldman Fine Arts, Inc., New York

PROVENANCE:

Private collection, Texas

LITERATURE:

Feldman & Schellmann, II.350-359

Warhol, Andy: American painter, photographer, filmaker and publisher, 1928-1987

Condition Report*:

With original Ronald Feldman Fine Arts, Inc. cardboard portfolio box and index print. All screenprints unframed and in good condition with specifics listed below. Mobil: Minor rubbing 3/8″ in due to former frame. A few incidental surface scratches and rubs. One 5/8″ abrasion, resulting in very minor loss. Paramount: Minor rubbing 3/8′ to 1/2″ due to former frame. Very minor bumping to bottom right corner. Chanel: 1/2″ to 1″ light rubbing due to former frame. Slate purple backgrund has hazy toning, beginning about 1/4″ in. Apple: Very minor incidental rubbing to edge. Rebel Without A Cause (James Dean); Van Heusen (Ronald Reagan); Blackglama (Judy Garland): All have only very minor edgewear. Volkswagen; Life Savers: Very minor surface rubbing and edgewear. Donald Duck: Very minor edgewear. Top corners have minor wear. Light handling creases. Some wrinkling and an indentation at end of signature. Left side center shows some moderate wrinkling and creases with some minor loss, beginning at 11″ from the bottom up to 24″, and affecting 3″ into the work. The face and body of Donald Duck is affected somewhat, as well as the background near edge. Light wear in top left corner and a small abrasion on middle right side. Unframed

Two works by Ed Ruscha responded well among buyers as his gunpowder on paper titled Rustic Pines, 1967, realized $290,500 USD and a color screenprint, Double Standard, 1969, sold for $182,500 USD , setting a record for the work. Mel Ramos’ Georgia Peach, 1964, fresh from a Texas collection, sold for $158,500 USD.

“The market for good contemporary art doesn’t seem to have hit any ceiling,” said Frank Hettig, Director of Modern and Contemporary Art at Heritage. “Our focus is presenting fantastic, fresh-to-market discoveries and bidders certainly responded in kind. It gives us high expectations for our November 2 Modern and Contemporary auction in Dallas.”

Among the modern masterpieces in the auction, the magnificent, 7-foot Cobalt Chandelier, 2003, by Dale Chihuly reached $158,500 USD. It is the largest Chihuly chandelier to appear on the secondary market and was offered through a federal court-appointed receivership overseeing the sale of assets previously owned by R. Allen Stanford of Stanford Financial Group.

Forms in Space by Lichtenstein earned $53,125.

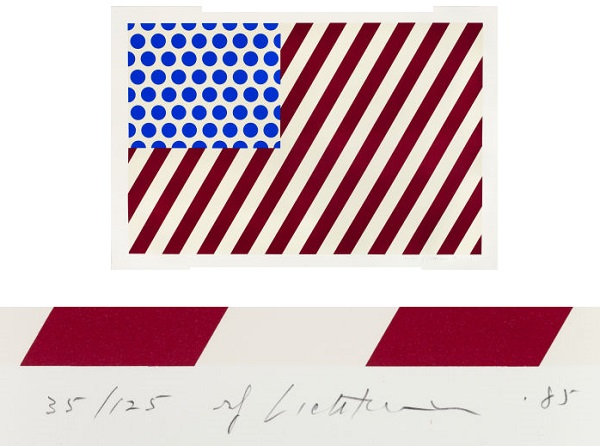
Roy Lichtenstein’s Forms in Space, 1985, a screenprint published by the artist for the Institute of Contemporary Art’s Rally round the Flag benefit, achieved $53,125 USD and Georges Rouault’s Chemineau, 1937, realized $40,625 USD.

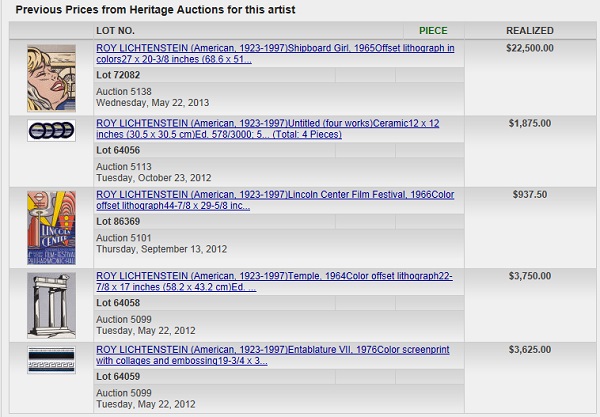
Here's a look at what some Lichtenstein's other pieces sold for.
Here’s a look at what some Lichtenstein’s other pieces sold for.

Sculptural art performed well as Étienne Hajdu’s La Mer, 1964, sold for $35,000 USD and Pablo Picasso’s Vase deux anses hautes, 1953, sold for $30,000 USD while Robert Graham’s Frieze Figure I-G, 1989/1990, brought $21,250 USD.

So what is that Volkswagen Warhol worth today in 2021? It’s hard to pen the value but in Spring 2019 one single print ad brought 30,000 UK Pounds ( 52,000 $ CAD) in a Christie’s auction.


ROY LICHTENSTEIN (American, 1923-1997)

 Forms in Space, 1985

 Screenprint in colors on Rives BFK paper

 31 x 47-1/2 inches (78.7 x 120.7 cm)

 Ed. 35/125

 Signed, dated and numbered in pencil


LITERATURE:

 Corlett, 217

NOTE:

 Published by the artist for the Institute of Contemporary Art, University of Pennsylvania, Philadelphia.

 Forms in Space has been created especially in honor of ICA’s benefit, Rally round the Flag (label on frame verso) .

Lichtenstein, Roy:. American painter, printmaker; born 1923 in New York City, died 1997 in New York City


Condition Report*:

 Sheet: 35.75 x 51.5 A crease in upper center at extreme sheet edge; small pressure mark at lower right corner; lower right corner lightly bumped; paper lightly undulates; framed. Framed Dimensions 36.25 X 52.5 Inches


Supplemental- Apple logo designer dishes on history http://www.macworld.com/article/1142322/logo_design.html

Being In Canada 54 Years And Involved In Social Change

This year, I have been in Canada 54 years. It is difficult to define what I need to do but I have to be more active, more involved in positive social change…….The state of Trumpism gnaws at me.
 
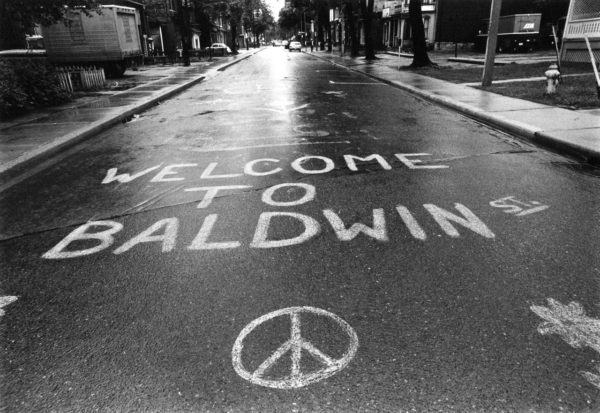
A few years ago, during March 2017, about 40 of my photographs (1967 – 1974) of Toronto’s Baldwin St. were exhibited at the Toronto Arts & Letters Club. I recently spoke at the Club about my experience as an immigrant in 1967 with a draft dodger avoiding the Vietnam War.    

Here is one of my photographs.

In Feb. of that same year, I was fortunate enough to have exhibited photographs at Unlovable Gallery that John Phillips (my ex-husband and late husband)  and I took of the American Civil Rights Movement. Last year, I gave a slide presentation at the Women’s Art Association on Canadian women photographers who worked between 1865 -1915.   Three projects – war resisters, civil rights, and feminism. 

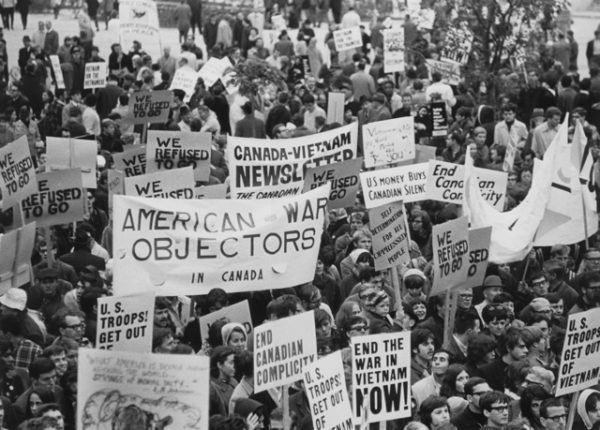
…and this one taken Toronto City Hall

 
 My son, Bennett Jones Phillips, and his partner, Lisa Pereira are in the process of creating a record store on Baldwin St. and I am going to have an exhibition space- provided the current Covid epidemic is managed, controlled and finally defeated. (I had a gallery in the past on Baldwin). Here is a chance to be more active and socially involved.   My plan includes an expanded “coming to Canada” exhibit with blow ups of my and John’s photos and some pages of John’s FBI file and underground papers. It looks like the space will be a shipping container. The opening event will likely include having a tent in the former  Silverstein Bakery parking lot and having music, poetry, and a 60’s feel with Baldwin Street history – Irish, Jewish, Chinese, and American immigration being part of the  opening focus. 
 
There are lots of possibilities. I am very open to ideas and involvement of other people. So what do you think? Cheers, Laura Jones.