“Inflation”. From the 2013 show. Eclectic. Radical. Awesome.
The Niagara Artists Centre’s (NAC) 2014 STRUTT Wearable Art Show was outlandish, bizarre and like nothing you’d ever seen before. STRUTT took place on November 22, 2014 at the WS Tyler Factory in St. Catharines, ON. Doors opened at 8 p.m. for the first edition of the Niagara Exotic Bazaar and the runway show began at 9 p.m. The show showcased over 40 pieces of wearable art performed by acrobats, aerialists and break-dancers to a live musical score performed by Chiac hip-hopper sensations, Radio Radio. The runway show will also include the debut performance of the mini trip-hopera, Unstrung, featuring music by Paradise Animals,contemporary hip-hop dance troupe Bboyizm, and remarkable masks created by local artist, Clelia Scala. The event website is www.struttwearableartshow.ca.
“We pack a whack of WTF into this thing. We don’t care who you are, or where you’re from, you come to STRUTT and you’ll get your head spun,” says NAC’s Minister of Energy, Minds, and Resources, Stephen Remus. “The artists make fantastic work, the performers tear it up, and we turn the factory into a hedonist’s palace. I don’t think it can be doubted, STRUTT’s the single annual occasion where Niagara genuinely surprises itself.”
STRUTT was a surreal party scene where the absurd is commonplace. As Doug Herod of the St. Catharines Standard reflects, “STRUTT rocks! STRUTT is a wearable art show, but that description doesn’t do it justice. It’s music, it’s entertainment, it’s theatre — and a lot of fun.”
And a few more designs from last year.
In addition to the runway show, STRUTT included the Niagara Exotic Bazaar, a showcase of all that’s weird and wonderful and originating in Niagara, from wine to designer clothing to glassware. The Niagara Exotic Bazzar was sponsored by Shannon Passero and co-presented by NAC and the Garden City Food Co-op.
2018 Weed Index Study reveals the cost of marijuana and highlights the number of grow and head shops in 120 cities around the world:
With a total of 156, Los Angeles, USA has the most headshops.
Madrid, Spain has the largest amount of growshops, with a total of 68.
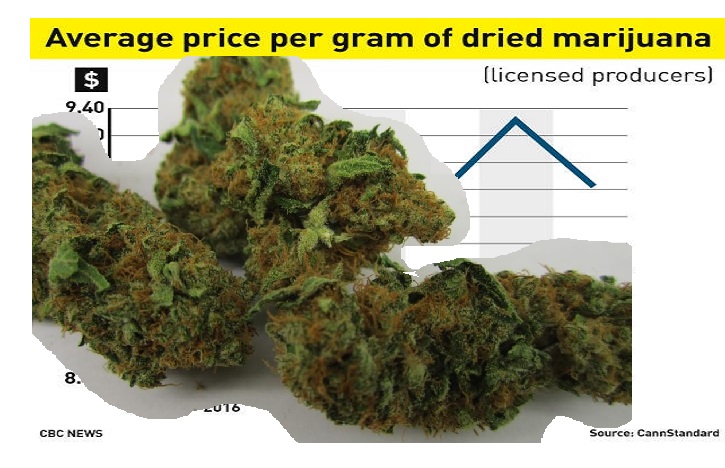
Tokyo, Japan has the most expensive cannabis, at 32.66 USD per gram, while Quito, Ecuador has the least expensive marijuana, at 1.34 USD per gram.
Based on the average US marijuana tax rates currently implemented, New York City could generate the highest potential tax revenue by legalising weed, with 156.40 million USD per year. New York City also has the highest consumption rate of cannabis, at 77.44 metric tons per year.
Berlin, Germany, 20/04/2018 – ABCD, a data-driven media campaign outlet, has released new data which reveals the number of marijuana head and growshops in 120 cities around the world. This research, which builds on the 2018 Cannabis Price Index released earlier this year, reveals which locations around the world are ready to embrace cannabis legalisation. The aim of the study is to illustrate the continuous need for legislative reform on cannabis use around the world, and to determine if there are any lessons to be learned from those cities at the forefront of marijuana legalization. By including extra data on the number of head and growshops in each city, this new research can be utilized to indicate which cities are prepared for an imminent cannabis reform, while also highlighting which cities are in opposition of marijuana legalisation.
The initial study began by selecting 120 cities across the world, including locations where cannabis is currently legal, illegal and partially legal, and where marijuana consumption data is available. Then, they looked into the price of weed per gram in each city. To calculate how much potential tax a city could make by legalising weed, ABCD investigated how much tax is paid on the most popular brand of cigarettes, as this offers the closest comparison. They then looked at what percentage marijuana is currently taxed in cities where it’s already legalised in the US.
ABCD decided to conduct the extra research in order to to further the discussion around the medical and recreational use of cannabis, and the potential industry and business opportunities that would follow legalisation. By identifying the number of headshops as well as growshops, this study serves as an indicator to a city’s existing cannabis infrastructure and willingness to accept such reform on a larger scale. As an indicating factor, the more head shops and grow shops a city has, the more positive their state’s and general public’s attitude towards the cannabis-related industry is likely to be.
The table below reveals a sample of the results for the 13 US cities featured in the study:
#
City
Legality
Price per gram, US$
Total possible tax collection, if taxed at cigarette level, mil US$
Total possible tax collection, if taxed at average US marijuana taxes, mil US$
Total consumption in metric tons
Headshops
Growshops
1
Washington, DC
Partial
18.08
47.51
20.96
6.18
20
8
2
Chicago
Partial
11.46
119.61
52.77
24.54
91
10
3
Philadelphia
Partial
11.30
68.37
30.16
14.22
41
3
4
Boston
Legal
11.01
28.59
12.61
6.10
49
4
5
New York
Partial
10.76
354.48
156.40
77.44
59
7
6
Dallas
Partial
10.03
51.01
22.5
11.95
80
6
7
Houston
Partial
10.03
89.13
39.32
20.89
125
14
8
Phoenix
Partial
9.35
58.26
25.71
14.65
72
9
9
Miami
Partial
9.27
16.24
7.16
4.12
67
25
10
San Francisco
Legal
9.27
30.94
13.65
7.85
61
3
11
Los Angeles
Legal
8.14
124.88
55.10
36.06
153
46
12
Denver
Legal
7.79
20.53
9.06
6.20
61
21
13
Seattle
Legal
7.58
20.59
9.08
6.39
46
10
The table below shows the top 10 most and least expensive cities for cannabis:
Top 10 Most Expensive Cities
Top 10 Least Expensive Cities
#
City
Country
Legality
Price per gram, US$
#
City
Country
Legality
Price per gram, US$
1
Tokyo
Japan
Illegal
32.66
1
Quito
Ecuador
Partial
1.34
2
Seoul
South Korea
Illegal
32.44
2
Bogota
Colombia
Partial
2.20
3
Kyoto
Japan
Illegal
29.65
3
Asuncion
Paraguay
Partial
2.22
4
Hong Kong
China
Illegal
27.48
4
Jakarta
Indonesia
Illegal
3.79
5
Bangkok
Thailand
Partial
24.81
5
Panama City
Panama
Illegal
3.85
6
Dublin
Ireland
Illegal
21.63
6
Johannesburg
South Africa
Illegal
4.01
7
Tallinn
Estonia
Partial
20.98
7
Montevideo
Uruguay
Legal
4.15
8
Shanghai
China
Illegal
20.82
8
Astana
Kazakhstan
Illegal
4.22
9
Beijing
China
Illegal
20.52
9
Antwerp
Belgium
Partial
4.29
10
Oslo
Norway
Partial
19.14
10
New Delhi
India
Partial
4.38
The table Below shows the top 10 cities with the most growshops:
#
City
Country
Legality
Growshops
1
Madrid
Spain
Partial
68
2
Buenos Aires
Argentina
Partial
48
3
Los Angeles
USA
Legal
46
4
Toronto
Canada
Partial
37
5
Melbourne
Australia
Partial
31
6
Miami
USA
Partial
25
7
London
UK
Illegal
23
8
Barcelona
Spain
Partial
23
9
Denver
USA
Legal
21
10
Berlin
Germany
Partial
20
The table Below shows the top 10 cities with the most headshops:
#
City
Country
Legality
Headshops
1
Los Angeles
USA
Legal
156
2
Houston
USA
Partial
125
3
Chicago
USA
Partial
91
4
Dallas
USA
Partial
80
5
Phoenix
USA
Partial
72
6
Miami
USA
Partial
67
7
San Francisco
USA
Legal
61
8
Denver
USA
Legal
61
9
New York
USA
Partial
59
10
Boston
USA
Legal
49
The table below shows the top 10 cities who could generate the most potential tax by legalising cannabis, if taxed at the same rate as the most popular cigarette brand:
#
City
Country
Legality
Price per gram, US$
% of cigarette tax
Possible tax revenue, mil US$
1
Cairo
Egypt
Illegal
16.15
73.13
384.87
2
New York
USA
Partial
10.76
42.54
354.48
3
London
UK
Illegal
9.20
82.16
237.35
4
Sydney
Australia
Partial
10.79
56.76
138.36
5
Karachi
Pakistan
Illegal
5.32
60.7
135.48
6
Melbourne
Australia
Partial
10.84
56.76
132.75
7
Moscow
Russia
Partial
11.84
47.63
128.97
8
Toronto
Canada
Partial
7.82
69.8
124.15
9
Chicago
USA
Partial
11.46
42.54
119.61
10
Berlin
Germany
Partial
13.53
72.9
114.77
N.B. % of cigarette tax refers to the tax percentage on the most popular brand. Possible tax revenue refers to the total possible tax collection per year, if taxed at cigarette level. For a full explanation of how the study was conducted, please see the methodology at the bottom of the press release.
The table below shows the top 10 cities who could generate the most potential tax by legalising cannabis, if taxed at the average US marijuana tax rate:
#
City
Country
Legality
Price per gram, US$
Possible tax revenue, mil US$
1
New York
USA
Partial
10.76
156.4
2
Cairo
Egypt
Illegal
16.15
98.78
3
London
UK
Illegal
9.20
54.22
4
Chicago
USA
Partial
11.46
52.77
5
Moscow
Russia
Partial
11.84
50.82
6
Sydney
Australia
Partial
10.79
45.75
7
Melbourne
Australia
Partial
10.84
43.9
8
Karachi
Pakistan
Illegal
5.32
41.89
9
Houston
USA
Partial
10.03
39.32
10
Toronto
Canada
Partial
7.82
33.38
N.B. Possible tax revenue refers to the total possible tax collection per year, if taxed at average US marijuana tax rate.
The table below shows the top 10 cities with the highest and lowest consumption of cannabis, per year:
Highest Consumers of Cannabis
Lowest Consumers of Cannabis
#
City
Country
Legality
Price per gram, US$
Total consumption, metric tons
#
City
Country
Legality
Price per gram, US$
Total consumption, metric tons
1
New York
USA
Partial
10.76
77.44
1
Singapore
Singapore
Illegal
14.01
0.02
2
Karachi
Pakistan
Illegal
5.32
41.95
2
Santo Domingo
Dominican Rep.
Illegal
6.93
0.16
3
New Delhi
India
Partial
4.38
38.26
3
Kyoto
Japan
Illegal
29.65
0.24
4
Los Angeles
USA
Legal
8.14
36.06
4
Thessaloniki
Greece
Partial
13.49
0.29
5
Cairo
Egypt
Illegal
16.15
32.59
5
Luxembourg City
Luxembourg
Partial
7.26
0.32
6
Mumbai
India
Partial
4.57
32.38
6
Panama City
Panama
Illegal
3.85
0.37
7
London
UK
Illegal
9.20
31.4
7
Reykjavik
Iceland
Illegal
15.92
0.44
8
Chicago
USA
Partial
11.46
24.54
8
Asuncion
Paraguay
Partial
2.22
0.46
9
Moscow
Russia
Partial
11.84
22.87
9
Colombo
Sri Lanka
Illegal
9.12
0.59
10
Toronto
Canada
Partial
7.82
22.75
10
Manila
Philippines
Illegal
5.24
0.6
N.B. Total consumption is calculated per annum.
Further findings:
Shanghai, China has a large population of 24.15 million, has however no headshops or growshops in the city, underlining a resistance against cannabis reform.
On average, the status of legality (e.g. Legal, Partial or Illegal) coincides with the amount of headshops and growshops found in each city. The favourable the laws, the better the cannabis infrastructure
New York City, USA has the highest consumption rate of cannabis, at 77.44 metric tons per year.
Boston, USA has the most expensive cannabis of all the cities where it’s legal, at 11.01 USD, while Montevideo, Uruguay has the least expensive at 4.15 USD.
While Tokyo, Japan has the most expensive cannabis of all cities where it’s illegal, at 32.66 USD, Jakarta, Indonesia has the least expensive at 3.79 USD, despite being classed as a Group 1 drug with harsh sentences such as life imprisonment and the death penalty.
For cities where cannabis is partially legal, Bangkok, Thailand has the most expensive at 24.81 USD, while Quito, Ecuador has the least expensive at 1.34 USD.
Bulgaria has the highest tax rates for the most popular brand of cigarettes, at 82.65%, while Paraguay has the lowest, with rates of 16%.
Cairo, Egypt would gain the most revenue in tax if they were to legalise cannabis and tax it as the same rate as cigarettes, at 384.87 million USD. Singapore, Singapore would gain the least, at 0.14 million USD, due in part to the city’s low consumption of marijuana at 0.02 metric tons per annum.
Based on the average US marijuana tax rates currently implemented, New York City could generate the highest potential tax revenue by legalising weed, with 156.4 million USD per year. Singapore, Singapore would gain the least, at 0.04 million USD.
The full results of the 2018 Cannabis Price Index:
#
City
Country
Legality
Price per gram, US$
Taxes of cigarettes, % of the most sold brand
Total possible tax collection, if taxed at cigarette level, mil US$
Total possible tax collection, if taxed at average US marijuana taxes, mil US$
Total Consumption in metric tons
1
Tokyo
Japan
Illegal
32.66
64.36
32.14
9.37
1.53
2
Seoul
South Korea
Illegal
32.44
61.99
31.61
9.57
1.57
3
Kyoto
Japan
Illegal
29.65
64.36
4.64
1.35
0.24
4
Hong Kong
China
Illegal
27.48
44.43
19.72
8.33
1.62
5
Bangkok
Thailand
Partial
24.81
73.13
99.11
25.44
5.46
6
Dublin
Ireland
Illegal
21.63
77.80
29.31
7.07
1.74
7
Tallinn
Estonia
Partial
20.98
77.24
22.13
5.38
1.37
8
Shanghai
China
Illegal
20.82
44.43
49.12
20.75
5.31
9
Beijing
China
Illegal
20.52
44.43
43.10
18.21
4.73
10
Oslo
Norway
Partial
19.14
68.83
19.28
5.26
1.46
11
Washington, DC
USA
Partial
18.08
42.54
47.51
20.96
6.18
12
Cairo
Egypt
Illegal
16.15
73.13
384.87
98.78
32.59
13
Reykjavik
Iceland
Illegal
15.92
56.40
3.97
1.32
0.44
14
Belfast
Ireland
Illegal
15.81
77.80
13.55
3.27
1.10
15
Minsk
Belarus
Illegal
15.80
51.15
9.08
3.33
1.12
16
Athens
Greece
Partial
14.95
79.95
7.42
1.74
0.62
17
Auckland
New Zealand
Partial
14.77
77.34
106.03
25.73
9.28
18
Munich
Germany
Partial
14.56
72.90
50.90
13.10
4.80
19
Helsinki
Finland
Partial
14.42
81.53
27.12
6.24
2.31
20
Singapore
Singapore
Illegal
14.01
66.23
0.14
0.04
0.02
21
Berlin
Germany
Partial
13.53
72.90
114.77
29.55
11.64
22
Stuttgart
Germany
Partial
13.50
72.90
20.20
5.20
2.05
23
Thessaloniki
Greece
Partial
13.49
79.95
3.17
0.75
0.29
24
Stockholm
Sweden
Illegal
13.20
68.84
15.06
4.11
1.66
25
Vienna
Austria
Partial
12.87
74.00
59.21
15.02
6.22
26
Copenhagen
Denmark
Partial
12.47
74.75
20.65
5.18
2.22
27
Moscow
Russia
Partial
11.84
47.63
128.97
50.82
22.87
28
Hamburg
Germany
Partial
11.64
72.90
50.16
12.92
5.91
29
Chicago
USA
Partial
11.46
42.54
119.61
52.77
24.54
30
Philadelphia
USA
Partial
11.30
42.54
68.37
30.16
14.22
31
Bucharest
Romania
Partial
11.18
75.41
17.23
4.29
2.04
32
Cologne
Germany
Partial
11.14
72.90
28.51
7.34
3.51
33
Geneva
Switzerland
Partial
11.12
61.20
5.90
1.81
0.87
34
Boston
USA
Legal
11.01
42.54
28.59
12.61
6.10
35
Adelaide
Australia
Partial
10.91
56.76
41.60
13.75
6.72
36
Istanbul
Turkey
Partial
10.87
82.13
21.79
4.98
2.44
37
Melbourne
Australia
Partial
10.84
56.76
132.75
43.90
21.58
38
Sydney
Australia
Partial
10.79
56.76
138.36
45.75
22.59
39
New York
USA
Partial
10.76
42.54
354.48
156.40
77.44
40
Düsseldorf
Germany
Partial
10.70
72.90
15.82
4.07
2.03
41
Brisbane
Australia
Partial
10.63
56.76
66.88
22.12
11.09
42
Hanover
Germany
Partial
10.51
72.90
13.46
3.47
1.76
43
Prague
Czech Rep.
Partial
10.47
77.42
63.95
15.50
7.89
44
Frankfurt
Germany
Partial
10.29
72.90
18.06
4.65
2.41
45
Wellington
New Zealand
Partial
10.11
77.34
19.53
4.74
2.50
46
Dallas
USA
Partial
10.03
42.54
51.01
22.50
11.95
47
Houston
USA
Partial
10.03
42.54
89.13
39.32
20.89
48
Vilnius
Lithuania
Illegal
10.00
75.76
5.20
1.29
0.69
49
Zurich
Switzerland
Partial
9.71
61.20
10.33
3.17
1.74
50
Montpellier
France
Illegal
9.70
80.30
12.21
2.85
1.57
51
Canberra
Australia
Partial
9.65
56.76
10.96
3.63
2.00
52
Zagreb
Croatia
Partial
9.43
75.26
24.35
6.07
3.43
53
Nice
France
Illegal
9.40
80.30
15.80
3.69
2.09
54
Phoenix
USA
Partial
9.35
42.54
58.26
25.71
14.65
55
Paris
France
Illegal
9.30
80.30
102.25
23.90
13.69
56
Miami
USA
Partial
9.27
42.54
16.24
7.16
4.12
57
San Francisco
USA
Legal
9.27
42.54
30.94
13.65
7.85
58
London
UK
Illegal
9.20
82.16
237.35
54.22
31.40
59
Colombo
Sri Lanka
Illegal
9.12
73.78
3.98
1.01
0.59
60
Riga
Latvia
Illegal
9.00
76.89
10.23
2.50
1.48
61
Bratislava
Slovakia
Illegal
8.92
81.54
7.24
1.67
1.00
62
Milan
Italy
Partial
8.85
75.68
46.06
11.42
6.88
63
Varna
Bulgaria
Illegal
8.83
82.65
4.84
1.10
0.66
64
Marseille
France
Illegal
8.69
80.30
36.23
8.47
5.19
65
Glasgow
UK
Illegal
8.65
82.16
15.21
3.47
2.14
66
Toulouse
France
Illegal
8.62
80.30
18.67
4.36
2.70
67
Birmingham
UK
Illegal
8.58
82.16
27.73
6.34
3.93
68
Kuala Lumpur
Malaysia
Illegal
8.54
55.36
6.61
2.24
1.40
69
Monterrey
Mexico
Partial
8.45
65.87
4.17
1.19
0.75
70
Edinburgh
UK
Illegal
8.41
82.16
12.22
2.79
1.77
71
Lisbon
Portugal
Partial
8.36
74.51
4.69
1.18
0.75
72
Strasbourg
France
Illegal
8.35
80.30
11.13
2.60
1.66
73
Warsaw
Poland
Partial
8.31
80.29
29.27
6.84
4.39
74
Lyon
France
Illegal
8.20
80.30
19.45
4.55
2.95
75
Los Angeles
USA
Legal
8.14
42.54
124.88
55.10
36.06
76
Liverpool
UK
Illegal
7.94
82.16
10.86
2.48
1.67
77
Amsterdam
Netherlands
Partial
7.89
73.40
20.94
5.35
3.61
78
Manchester
UK
Illegal
7.88
82.16
58.99
13.48
9.11
79
Rome
Italy
Partial
7.86
75.68
88.16
21.86
14.82
80
Toronto
Canada
Partial
7.82
69.80
124.15
33.38
22.75
81
Denver
USA
Legal
7.79
42.54
20.53
9.06
6.20
82
Naples
Italy
Partial
7.75
75.68
29.82
7.40
5.08
83
Leeds
UK
Illegal
7.67
82.16
16.93
3.87
2.69
84
Seattle
USA
Legal
7.58
42.54
20.59
9.08
6.39
85
Madrid
Spain
Partial
7.47
78.09
93.40
22.45
16.01
86
Calgary
Canada
Partial
7.30
69.80
52.23
14.05
10.25
87
Luxembourg City
Luxembourg
Partial
7.26
70.24
1.62
0.43
0.32
88
San Jose
Costa Rica
Partial
7.23
69.76
7.84
2.11
1.56
89
Buenos Aires
Argentina
Partial
7.13
69.84
25.32
6.81
5.09
90
Brussels
Belgium
Partial
7.09
75.92
15.50
3.83
2.88
91
Santo Domingo
Dominican Rep.
Illegal
6.93
58.87
0.67
0.21
0.16
92
Graz
Austria
Partial
6.84
74.00
4.81
1.22
0.95
93
Budapest
Hungary
Illegal
6.74
77.26
7.70
1.87
1.48
94
Sofia
Bulgaria
Illegal
6.66
82.65
12.83
2.91
2.33
95
Ottawa
Canada
Partial
6.62
69.80
35.43
9.53
7.67
96
Vancouver
Canada
Partial
6.40
69.80
23.44
6.30
5.25
97
Sao Paulo
Brazil
Partial
6.38
64.94
68.55
19.81
16.55
98
Rotterdam
Netherlands
Partial
6.33
73.40
12.75
3.26
2.74
99
Ljubljana
Slovenia
Partial
6.32
80.41
3.43
0.80
0.67
100
Barcelona
Spain
Partial
6.23
78.09
39.59
9.51
8.14
101
Montreal
Canada
Partial
6.15
69.80
60.52
16.27
14.10
102
Kiev
Ukraine
Partial
6.00
74.78
14.73
3.70
3.28
103
Abuja
Nigeria
Illegal
5.88
20.63
7.40
6.73
6.10
104
Lima
Peru
Partial
5.88
37.83
12.28
6.09
5.52
105
Mexico City
Mexico
Partial
5.87
65.87
22.58
6.43
5.84
106
Cape Town
South Africa
Illegal
5.82
48.80
2.47
0.95
0.87
107
Karachi
Pakistan
Illegal
5.32
60.70
135.48
41.89
41.95
108
Manila
Philippines
Illegal
5.24
74.27
2.32
0.59
0.60
109
Rio de Janeiro
Brazil
Partial
5.11
64.94
28.82
8.33
8.69
110
Mumbai
India
Partial
4.57
60.39
89.38
27.78
32.38
111
New Delhi
India
Partial
4.38
60.39
101.20
31.45
38.26
112
Antwerp
Belgium
Partial
4.29
75.92
4.10
1.01
1.26
113
Astana
Kazakhstan
Illegal
4.22
39.29
1.78
0.85
1.07
114
Montevideo
Uruguay
Legal
4.15
66.75
19.54
5.50
7.06
115
Johannesburg
South Africa
Illegal
4.01
48.80
3.76
1.45
1.92
116
Panama City
Panama
Illegal
3.85
56.52
0.81
0.27
0.37
117
Jakarta
Indonesia
Illegal
3.79
53.40
1.92
0.68
0.95
118
Asuncion
Paraguay
Partial
2.22
16.00
0.16
0.19
0.46
119
Bogota
Colombia
Partial
2.20
49.44
15.80
6.00
14.53
120
Quito
Ecuador
Partial
1.34
70.39
0.56
0.15
0.60
Methodology
Selection of the cities:
To select the cities for the study, Seedo first looked at the top and bottom cannabis consuming countries around the world. Then they analysed nations where marijuana is partially or completely legal, as well as illegal, and selected the final list of 120 cities in order to best offer a representative comparison of the global cannabis price.
Data:
Price per gram, US$ – Crowdsourced city-level surveys adjusted to World Drug Report 2017 of the United Nations Office on Drugs and Crime.
Taxes on Cigarettes, % of the most sold brand – Taxes as a percentage of the retail price of the most sold brand (total tax). Source: Appendix 2 of the WHO report on the global tobacco epidemic, 2015.
Annual possible tax collection is calculated in the following way:
Population: latest available local population data sources.
Annual Prevalence (percentage of population, having used weed in the year). Source: World Drug Report 2017 of the United Nations Office on Drugs and Crime
Average Consumption of weed per year in grams (people who consumed weed at least once in the previous year).
Estimation, with the assumption, that one use of weed on average means one joint.
One joint is assumed to have 0.66 grams of weed as in the paper of Mariani, Brooks, Haney and Levin (2010).
The distribution of use during the year is assumed to be the same as in Zhao and Harris (2004), where the yearly usage varies from once or twice a year to everyday.
Population: latest available local population data sources.
Annual Prevalence (percentage of population, having used weed in the year). Source: World Drug Report 2017 of the United Nations Office on Drugs and Crime
Average Consumption of weed per year in grams (people who consumed weed at least once in the previous year).
Estimation, with the assumption, that one use of weed on average means one joint.
One joint is assumed to have 0.66 grams of weed as in the paper of Mariani, Brooks, Haney and Levin (2010).
The distribution of use during the year is assumed to be the same as in Zhao and Harris (2004), where the yearly usage varies from once or twice a year to everyday.
US tax level – Average tax level in the states of US where weed is legal: Alaska, California, Colorado, Maine, Massachusetts, Nevada, Oregon and Washington. Includes retail sales taxes, state taxes, local taxes and excise taxes.
Growshops – Sourced via Google Maps Listings 2018
Headshops – Sourced via Google Maps Data Listings 2018
Legality
Legal, if possession and selling for recreational and medical use is legal.
Illegal, if possession and selling for recreational and medical use is illegal.
Partial, if
Possession of small amounts is decriminalised (criminal penalties lessened, fines and regulated permits may still apply)
OR medicinal use legal
OR possession is legal, selling illegal
OR scientific use legal
OR usage allowed in restricted areas (e.g. homes or coffee shops)
OR local laws may apply to legality (e.g. illegal at federal level, legal at state level)
First quote: Based on New York City Council’s free lunch initiative which began in September 2017, with 1.1 million public school children, at a cost of $1.75 per child per day.
On July 1, 2015, Ontario was the first jurisdiction in North America to protect bees and other pollinators through new rules to reduce the number of acres planted with neonicotinoid-treated corn and soybean seeds by 80 per cent.
Over the years, Ontario beekeepers have experienced unusually high over-winter losses of honey bees, reaching 58 per cent following the winter of 2013-14. image: naturalblaze.com
To support this goal, new requirements were put in place for the sale and use of neonicotinoid-treated corn and soybean seed that will help ensure treated seed is only used when there is evidence of a pest problem. Reducing neonicotinoid use in these two crops presents the greatest potential to reduce pollinator exposure to the neurotoxic insecticide.
Pollinators, including bees, birds and butterflies, play a crucial role in agriculture and our ecosystem. The level of over-winter losses considered to be acceptable and sustainable by most apiculturists is 15 per cent.
The new rules are one part of Ontario’s strategy to improve pollinator health. The province will also develop a pollinator health action plan in consultation with the public and experts to address other stressors that affect pollinators.
Ensuring a strong and healthy agricultural sector is part of the government’s economic plan for Ontario. The four part plan is building Ontario up by investing in people’s talents and skills, making the largest investment in public infrastructure in Ontario’s history, creating a dynamic, innovative environment where business thrives, and building a secure retirement savings plan.
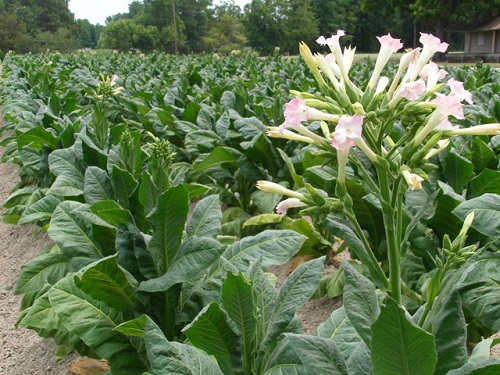
A flowering tobacco plant. Close to 100 per cent of corn seed and 60 per cent of soybean seed sold in Ontario is treated with neonicotinoid insecticides.
QUOTES
“Much of the food we eat and the vibrancy of Ontario’s natural habitats depend on a healthy pollinator population. Our government is taking necessary action to protect these vitally important species and the ecosystems they support from the effects of neurotoxic neonicotinoids.”
— Glen Murray, Minister of the Environment and Climate Change
“Farmers are environmental stewards of their land and this regulation will enable our province’s farmers to strengthen their approach to protecting their crops. To have a significant impact on improving pollinator health, over the coming months, we collectively need to focus on three additional contributors: habitat and nutrition, disease and pests as well as weather and climate change.”
— Jeff Leal, Minister of Agriculture, Food and Rural Affairs
“Farmers care about the health of pollinators. That’s why the Ontario Federation of Agriculture (OFA) has worked closely with the Government of Ontario to have these new regulatory requirements work for the province’s farmers. The OFA supports the need for a complete pollinator policy. The OFA will continue to work with the government toward the successful implementation of this regulation, keeping the concerns of farmers top of mind as part of a pollinator strategy.”
Don McCabe, President, Ontario Federation of Agriculture
“Friends of the Earth is pleased and impressed by Ontario’s leadership in finalizing this first permanent reduction in the use of neonicotinoids in Canada. With its new pesticide regulation, Ontario is delivering important benefits for nature including honey bees, native bees and other vulnerable species.”
Beatrice Olivastri, Chief Executive Officer, Friends of the Earth Canada
“Doctors are delighted Ontario will be North America’s first jurisdiction to introduce regulatory restrictions on bee-killing neonic pesticides. Assuming Ontario hits its target of an 80% reduction by 2017, this will be the most important pollinator-protection policy on the continent — and a major contributor to food security.”
Gideon Forman, Executive Director, Canadian Association of Physicians for the Environment
QUICK FACTS
There are more than 400 pollinator species in Ontario and bees are the most common pollinator.
Bees and other pollinators are responsible for pollinating roughly 13 per cent of agricultural crops in Ontario (crops worth about $897 million), and support $26 million annually in honey production.
The province conducted a comprehensive, two-stage consultation process with the public and stakeholders to develop its neonicotinoid regulatory requirements.
Neonicotinoid-treated seeds are widely used in agriculture. Close to 100 per cent of corn seed and 60 per cent of soybean seed sold in the province is treated with neonicotinoid insecticides.
I’m sure we all read the distressing poll that about a third of Canadians still don’t believe the threat of climate change is real. Even more illuminating: only 30 per cent even know we are taking action in Ontario to fight climate change.
This is the reason why Canada and Ontario are working together to take action on climate change and find clean solutions to help homeowners and families save money, reduce energy waste, create jobs and support healthy communities.
Minister of Environment and Climate Change, Catherine McKenna, and the Premier of Ontario, Kathleen Wynne, announced a federal investment of up to $100 million to help the people of Ontario make energy efficient retrofits to their homes – including apartments, townhouses and low-income housing – and businesses.
This funding will support the province’s GreenON Rebates program, which helps cover the cost of eco-friendly retrofits across the province. This investment is supported by the Government of Canada’s Low Carbon Economy Leadership Fund.
GreenON Rebates will assist property owners make energy efficient changes like installing better insulation, high-efficiency ventilation systems and heat pumps, and other devices to save energy and reduce costs.
This is an opportunity for us here in Haldimand-Norfolk to take action and do our part in fighting the climante change. We can take advantage of receiving some of our own tax dollars back by improving our houses and businesses while saving money in the long run at the same time.
As part of its Climate Change Action Plan (CCAP), Ontario in investing up to $1.7 billion over the coming years into GreenON to support a wide range of programs, including rebates and programs to help families, business and farmers make environmentally friendly changes. The CCAP is a five-year action plan that is making life more affordable for people across the province and making Ontario a leader in the global fight against climate change. Revenues from Ontario’s carbon market, which puts a cap on the carbon pollution businesses can emit, are funding this action plan.
The Government of Canada’s Low-Carbon Economy Leadership Fund provides $1.4 billion to provinces and territories that have adopted the Pan-Canadian Framework on Clean Growth and Climate Change (PCF), to deliver on commitments to reduce greenhouse gas emissions. Today’s announcement is part of the almost $420 million Ontario is receiving through the Leadership Fund.
Did you Know:
Through GreenON, property owners are currently eligible for rebates up to $7,200 in savings on new insulation; $5,000 in savings on replacement windows; $5,800 in savings on some air source heat pumps; and $20,000 in savings on installation of some certified ground source heat pumps.
In January, Ontario became part of the second-largest carbon market in the world, which forms the backbone of Ontario’s strategy to cut greenhouse gas pollution to 15 per cent below 1990 levels by 2020, 37 per cent by 2030 and 80 per cent by 2050.
Ontario’s carbon market has generation approximately $2.4 billion in revenue to improve schools, hospitals, transit and other projects like new bike lanes that are building a greener, more energy efficient province.
Ontario has committed up to $1.7 billion over three years to support a wide range of programs under the Green Ontario Fund (GreenON).
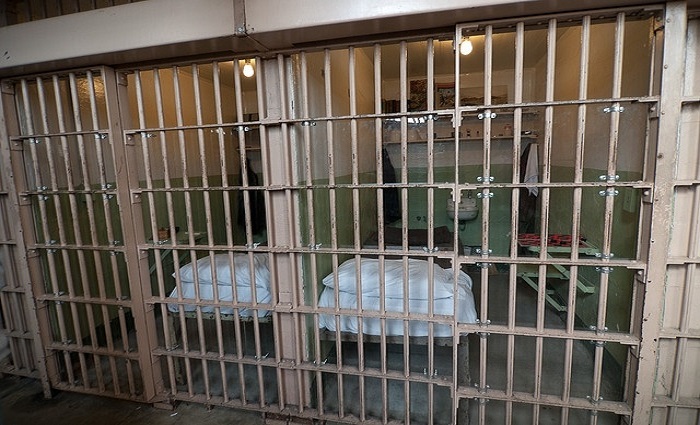
In December of 2015, I toured the aging Thunder Bay District Jail. The nearly century-old jail had recently been the scene of a riot that led to a correctional officer being taken hostage – 70 inmates took control of the upper floor for a period of 20 hours.
In Ontario, assaults on correctional officers and other staff have more than doubled over the past seven years.
Last year, a report by the Independent Advisor on Corrections Reform described shocking abuse and disorder in Ontario’s detention centres – centres that are overcrowded and violent.
After violent incidents, inmates are often held in solitary confinement without access to rehab programs, and lockdowns are often the only recourse because of short staffing.
Much of the violence in Ontario’s detention centres is derived from smuggled weapons and drugs – but officers are restricted in their ability to conduct searches.
Front-line officers tell us they feel they are in danger – they are outnumbered, and they have little recourse when they’re attacked.
Ontario’s probation and parole system is a joke — that’s exactly what criminals have called it. Our probation and parole officers are not to blame. In many cases, they are actively discouraged from checking up on criminals by making house visits because of insufficient resources. Offenders are often left to self-report but, obviously, very few do.
Over 45,000 former inmates are out on parole or probation being forced to self-report. And 60 per cent of these individuals are deemed medium to high risk, that’s 27,000 individuals free to roam our province.
How can this out of touch government make the claim that our communities are safe?
Why did this current government allow this to happen? That’s the question that needs to be asked.
The present provincial government recently introduced Bill 6, to supposedly deal with the issue. But this government has a history of producing incomplete, skeletal and poorly-thought-out legislation, and Bill 6 is no exception. The Correctional Services Transformation Act is supposed to be a thorough overhaul of a broken correctional system, but it has the same deficiencies as most other legislation of late.
Obviously, the Liberals are inclined to think more bureaucracy is a solution to every problem, but more paper-pushing isn’t going to solve that problem.
Minor tinkering isn’t going to fix the crisis in corrections. The government must take serious and thorough action.
Has this government decided that the needs and wants of incarcerated criminals are more important than the rights of correctional officers and the order and safety of our detention centres are secondary to making criminals feel comfortable. Obviously, this legislation – Bill 6 — must be compliant with the written portion of our Constitution and our common-law traditions. But it must be said corrections officers and all prison staff have rights as well.
As my colleague MPP Rick Nichols, our critic for the Ministry of Community Safety and Correctional Services has been saying, there has been a crisis in corrections for years in the making. Now with an election looming, the Liberals want us to believe — with Bill 6 — they’re experiencing a deathbed conversion. For the Silo, Toby Barrett, MPP for Haldimand-Norfolk.
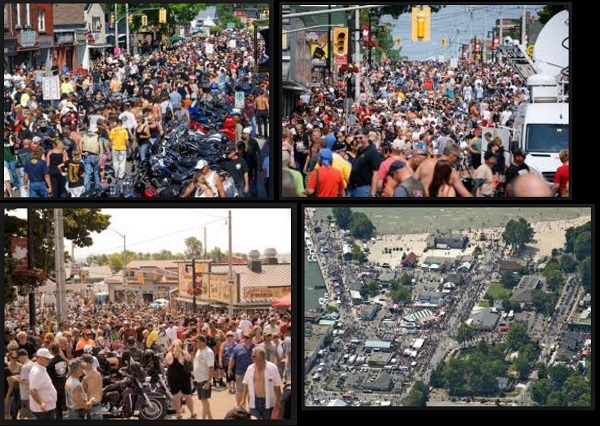
Before you contemplate the pictures above lets flash-back to Friday 13th, 1984, when Chris Simons, a local biker, and a few of his buddies met in the “ZOO,” a local watering hole, to shoot the breeze and have a few cold ones. They agreed to meet every Fri. 13th and pass the idea on to friends. And so it began.
Friday the 13th in Port Dover,ON
Many local people, including the Municipal Council, feared the 1% of potentially violent bikers invading Norfolk County (as opposed to the 99% of peaceful riders), but as it grew into the biggest money making event the Kinsmen had ever seen, the need for some organization became evident.
The word went out to “LEAVE YOUR COLOURS AND ATTITUDES AT HOME,” otherwise the Council threatened to shut it down. The Kinsmen knew the bikers would continue to come and numbers would soar. The Coffin Bike and even Santa Claus were soon regular attendees as well as the Motor Maids (6000 strong nation-wide) and the Christian Riders.
HOG (Harley Owners Group) and BRO (Bikers Rights Organization) were present. By 1999 the OPP reported 12 outlaw biker clubs present in Port Dover, including Satan’s Choice, Hells Angels, Outlaws, Nomads, Para-Dice Riders, Red Devils, Piston Pushers, and even Banditos. Still, no violence erupted and over 100 police were brought in to maintain order.
As word spread Port Dover became THE place to be on Friday The 13th. Bikes were showing up from Quebec, Manitoba, Nova Scotia and B.C., as well as Americans from as far away as Florida. Even several Brits put their bike on a ship and came over.
Tim Hortons Drive-Thru soon was a walk-through. Yard Sales were common; seniors sold food to pay for a wheelchair-van. Pop, water and Freezies were sold from many local yards and eateries. Bars and beer gardens struggled to meet the demand in the summer months.
Big name bands were soon playing, like Steppenwolf, Colin James, Blue Rodeo, Dry County, Tragically Hip and local favourites. As the 20th century came to a close over 100,000 people were attending in the summer months.
As crowds swelled to over 150,000 in a town of 4,500, businesses placed “WELCOME BIKERS” signs in their storefronts and traffic backed up to Simcoe in the West and Cayuga in the East. Lodgings were booked-up for a year in advance and campgrounds swelled to full capacity quickly. Some businesses closed for the day like law offices, pharmacies, hardware stores and banks, though they stocked their debit machines full and went to work with the service clubs.
In 2009 The Port Dover Board of Trade, Kinsmen and the Lions partnered to run this massive event. The Kinsmen now handle bookings for 100 vendors in Powell Park and the Harbor Front, and run a 1,200 capacity beer garden. They monitor about 1200 campers in Kinsmen Park and Doverwood School, as well as selling souvenirs, including over 1,000 t-shirts. Shuttles are provided to haul campers to the action downtown.
Over the years the Kinsmen Club recruited many others to help, like Minor Softball and Hockey, Hard ball, Jr. Hockey, Figure Skating, Soccer, Maureen Dodds Art Foundation, Alzheimers, Big Brothers, High School Council (the Port Dover High School was closed a few years ago) Scouts K. of C., and the Harbor Museum. Other Kin Clubs came on board as did “Support our School.” At one point 26 other groups assisted the Kinsmen with everybody getting a share of the pie. It’s well known that bikers come back to visit Port Dover even when it’s not Fri. 13, as can be witnessed on any good weekend throughout the summer. The welcome mat is out so come visit us on Friday, September 13th, 2013 and every Friday the 13th to follow. For the Silo……Yours in Kin: Life Member Dave C.
The payments world has long been governed by the world’s great financial institutions. Banks and states have dominated the world’s spending habits, regulating transactions and payment methods.
The last decade has seen a shift away from the great institutions having total control over the financial landscape, and it’s been largely down to the digital revolution. Recent years have seen growing partnerships with the technology industry. Tech has sought more innovative ways for the financial industry to operate, and a greater freedom for consumers to spend their money.
Find current trends and what the future has in store for spending in this interesting infographic below from our friends at moneyguru.com. At the time of posting 1 British Pound = $1.42 US and $1.79 CDN.
Vasiliki is the high-end fashion brand that’s set to hit wardrobes in time for summer. Combining luxury fabrics, classic designs that have a modern twist, and style that’s perfect for the modern, outgoing woman, Vasiliki is bringing its unique style mixture of edgy sophistication right to fashionistas through its newly launched online store.
Blending vintage inspiration and regal romance with confident, modern designs, Vasiliki has successfully created a brand that’s timeless and contemporary. Embracing the trend for female empowerment, every design from the premium brand is designed to demonstrate confidence and let the wearer show off their individual style. The playful details and elegant silhouettes result in dresses that are wearable yet have an avant-garde quality that will delight fashion fans.
Sahar Zohair
Sahar Zohair, Founder and Designer of Vasiliki, said, “I have been designing and selling dresses since I was ten. The only difference is that then I was selling to myself, so they had to be perfect, and now I am offering these dresses to women who are like me: feminine, strong, and always appreciating beauty. These dresses are designed and made with a genuine passion and love. As a result, a vital component of my brand is emotion, emotions that are timeless and priceless, and this is what makes the Summer & Resort Collection 2018 unique.
“The first collection will encompass six designs in silks, custom printed silks, and laces ranging from $395cdn to $595cdn. These designs are inspired by the latest trends for unique cuts and silhouettes while maintaining a timeless and classic vibe. They’re soft yet striking and will give wearers a confidence boost whenever they’re slipped on.”
Highlights of the very first collection from Vasiliki include the Selene Silk Dress, which gives asymmetric Edwardian ruffles a delicate, contemporary update for a look that exudes femininity and independence, and the vintage, highly wearable Hestia Lace Dress that beautifully combines stunning silks and exquisite lace for timeless elegance. The luxury dresses designed for the Summer & Resort Collection are made from high-end materials, lovingly crafted, and effortlessly showcase individuality.
Selene Silk Dress
The sensational collection is available to view online now and will start delivering May 2018. Based in Canada, the brand will ship nationally as well as to the USA and UK, with plans already in the pipeline to reach a global audience. For the Silo, Charlotte Malone.
Sonnet Technologies recently announced the eGFX Breakaway™ Box 650, the latest and most capable model in the company’s series of Thunderbolt™ 3 to PCI Express® (PCIe®) eGPU expansion chassis for professional graphics and gaming applications.
The Breakaway Box 650 is designed and qualified specifically for large, power-hungry video graphics processing unit (GPU) cards, including the AMD Radeon™ RX Vega 64 and overclocked NVIDIA® GeForce® GTX 10 series-based cards. The AMD-approved Breakaway Box 650 is equipped with a 650-watt power supply, which provides ample power for GPU cards with high transient peak power requirements.
“With the introduction of AMD’s Radeon Pro and RX Vega Series cards, we have experienced a high demand for an eGPU chassis capable of supporting the higher standards of these GPU cards,” said Robert Farnsworth, CEO of Sonnet Technologies. “The eGFX Breakaway Box 650 meets the demand, enabling users to tap the compute power of even the AMD Radeon RX Vega 64 and Radeon Pro WX 9100 cards while still providing up to 87 watts of upstream Power Delivery to support popular notebook computers.”
The eGFX Breakaway Box 650 provides a single slot for connecting any size Thunderbolt-compatible GPU card, and features enough room for many high-performance water-cooled cards — making it ideal for professionals and gamers who need to run bandwidth-intensive graphics applications on their eGFX-compatible notebook, all-in-one, or other small-form-factor computers. The unit is equipped with a 40Gbps Thunderbolt 3 port that enables data transfers up to 2750 MB/s, and supports all Thunderbolt-compatible GPU cards — such as AMD Radeon R9, RX, RX Vega, and Pro WX models; and NVIDIA GeForce GTX 9 and 10 series, Titan X and Xp, V, and Quadro® models. In addition, the Breakaway Box 650 includes two eight-pin auxiliary power connectors and provides 87 watts of upstream power (Power Delivery), useful for powering and charging a connected notebook computer that supports Thunderbolt 3 charging.
The eGFX Breakaway Box 650 (part number GPU-650W-TB3) is available now from Sonnet Technologies and its dealers at an MSRP of $449 usd. Featured image via egpu.io
About Sonnet Technologies
Sonnet Technologies Inc. is a leading provider of Thunderbolt™ 3 to PCIe® card expansion systems; external graphics (eGFX) solutions for pro users and gamers; pro media readers; docks and adapters; and network, storage, and other interface cards for pro users in the audio, video, and broadcast industries. Sonnet’s Thunderbolt expansion products enable the use of pro audio I/O and DSP cards, pro video capture and transcoding cards, GPU cards, network and storage interface cards, and other high-performance PCIe cards with Thunderbolt technology-enabled computers. For 30 years Sonnet has pioneered and brought to market innovative and award-winning products that enhance the performance and connectivity of Mac®, Windows®, and other industry-standard computers.
Occasionally I will have a Maud Lewis painting displayed for sale in my shop, and it is sometimes interesting to get people’s reactions to a $6,000 painting that at first glance looks like their 12 year old niece painted it. “My goodness will you look at that,” and some covered up snickering, pretty well expresses their complete disbelief that something so simple could possibly be worth so much money.
Sometimes I give a brief description of the circumstances of her simple Nova Scotia life, and add fuel to the fire by informing them that while she was alive she sold paintings for 12 to 15 dollars from her tiny house by the side of the road. I then suggest it is probably simplest to think in terms of supply and demand. The supply of these paintings has stopped since her death in 1970, and there are many more people wanting them than there are paintings available. This of course skirts the main issue: how could anything like this be desirable in the first place? To find the answer you have to go a lot deeper.
Beauty is in the eye of the beholder, and for some people—I include myself in this group—great value is placed on anything that manages to capture, or in some way manifest, beauty. I do not mean “pretty picture” beauty here. I mean creations that celebrate existence, or connect to a greater truth. I mean something that has energy.
This energy can be found in the works of trained and untrained artists alike. The real value in truly great works of art is in experiencing them, and in doing so being educated and transformed by them. Understanding beauty is our salvation. Money really just confuses the issue. Put in relative terms: $4 million for a Tom Thompson and $6,000 for a Maud Lewis—the Lewis is still cheap. For the Silo, Phil Ross.