Not all ideas are ‘shot down’ by an intimidating boss- Albert Einstein’s formal letter paved the way to American atom bomb research.
Everyone says they want innovation in their organization, but when an ambitious employee offers it to a Boss or CEO, for example, the idea is often shot down, says Neal Thornberry, Ph.D., faculty director for innovation initiatives at the Naval Postgraduate School in California. There has to be a way of getting your ideas accepted, right?
“Senior leaders often miss the value-creating potential of a new concept because they either don’t take the time to really listen and delve into it, or the innovating employee presents it in the wrong way,” says Thornberry, who recently published “Innovation Judo,” (www.NealThornberry.com), based on his years of experience teaching innovation at Babson College and advising an array of corporate clients, from the Ford Co. and IBM to Cisco Systems.
Neal Thornberry: ” Innovation should be presented as opportunities, not ideas. Opportunities have gravitas while ideas do not!”
Thornberry outlines a template for innovation that works:
1 Intention: Once the “why” is answered, leaders have the beginnings of a legitimate roadmap to innovation’s fruition. This is no small task and requires some soul searching.
“I once worked with an executive committee, and I got six different ideas for what ‘innovation’ meant,” he says. “One wanted new products, another focused on creative cost-cutting, and the president wanted a more innovative culture. The group needed to agree on their intent before anything else.”
2 Infrastructure: This is where you designate who is responsible for what. It’s tough, because the average employee will not risk new responsibility and potential risk without incentive. Some companies create units specifically focused on innovation, while others try to change the company culture in order to foster innovation throughout. “Creating a culture takes too long,” Thornberry says. “Don’t wait for that.”
3 Investigation: What do you know about the problem? IDEO may be the world’s premier organization for investigating innovative solutions. Suffice to say that the organization doesn’t skimp on collecting and analyzing data. At this point, data collection is crucial, whereas brainstorming often proves to be a waste of time if the participants come in with the same ideas, knowledge and opinions that they had last week with no new learning in their pockets.
4 Ideation: The fourth step is also the most fun and, unfortunately, is the part many companies leap to. This is dangerous because you may uncover many exciting and good ideas, but if the right context and focus aren’t provided up front, and team members cannot get on the same page, then a company is wasting its time. That is why intent must be the first step for any company seeking to increase innovation. Innovation should be viewed as a set of tools or processes, and not a destination.
If you’re gonna ‘demo’ your idea you better have practiced and perfected your routine before showing your boss-
5 Identification: Here’s where the rubber meets the road on innovation. Whereas the previous step was creative, now logic and subtraction must be applied to focus on a result. Again, ideas are great, but they must be grounded in reality. An entrepreneurial attitude is required here, one that enables the winnowing of ideas, leaving only those with real value-creating potential.
“Innovation without the entrepreneurial mindset is fun but folly,” Thornberry notes.
6 Infection: Does anyone care about what you’ve come up with? Will excitement spread during this infection phase? Now is the time to find out. Pilot testing, experimentation and speaking directly with potential customers begin to give you an idea of how innovative and valuable an idea is. This phase is part selling, part research and part science. If people can’t feel, touch or experience your new idea in part or whole, they probably won’t get it. This is where the innovator has a chance to reshape their idea into an opportunity, mitigate risk, assess resistance and build allies for their endeavor.
7 Implementation/Integration: While many talk about this final phase, they often fail to address the integration part. Implementation refers to tactics that are employed in order to put an idea into practice. This is actually a perilous phase because, in order for implementation to be successful, the idea must first be successfully integrated with other activities in the business and aligned with strategy. An innovation, despite its support from the top, can still fail if a department cannot work with it.
For the Silo, Neil Thornberry.
Working 9 to 5? Think about the best times to approach your boss.
Neal Thornberry, Ph.D., is the founder and CEO of IMSTRAT, LLC a consulting firm that specializes in helping private and public sector organizations develop innovation strategies. A respected thought leader in innovation, Thornberry is a highly sought-after international speaker and consultant. He also serves as the faculty director for innovation initiatives at the Center for Executive Education at the Naval Postgraduate School in Monterey, Calif. Thornberry, author of “InnovationJudo:Disarming Roadblocks & Blockheads on the Path to Creativity”, holds a doctorate in organizational psychology and specializes in innovation, corporate entrepreneurship, leadership and organizational transformation.
May, 2025 – Canada cannot rely on immigration alone to address the challenges posed by its ageing population and relentless decline in fertility rates [ see Canada’s Soaring Housing and Living Costs Stop Baby Making CP], according to a new report from our friends at the C.D. Howe Institute. Without a broader population strategy, rising immigration could fuel rapid growth while straining housing, healthcare, and infrastructure – without fully resolving rising old-age dependency ratios or labour force pressures.
In this post, Daniel Hiebert confronts an important policy dilemma: although immigration increases overall population and helps address short-term labour gaps, the long-term trade-offs are significant. Without corresponding investment and planning, rising immigration risks compounding the very pressures it aims to alleviate.
“This is a particularly opportune moment to reflect on how immigration fits into Canada’s long-term demographic strategy, especially as both permanent and temporary immigration surged between 2015 and 2024, and are now being scaled back,” says Hiebert. “We need to think ahead about what kind of future we are building — and how we get there.”
Based on current patterns, it takes five new immigrants to add just one net new worker, once dependents and added consumer demand are factored in — a reality that undermines assumptions about immigration as a direct fix for labour shortages.
Hiebert argues that Canada must move beyond short-term immigration planning and adopt a long-range population strategy — one that combines immigration with other tools like delayed retirement, increased workforce participation, and stronger productivity growth. The alternative, he warns, is a “population trap”: a scenario where growth outpaces the country’s capacity to support it, undercutting prosperity in the process.
The report also calls on governments to coordinate immigration levels with long-term planning in housing, healthcare, education, and infrastructure.
“There’s no question that immigration is integral to Canada’s future,” says Hiebert. “But assuming it can carry the load alone ignores the structural pressures we’re facing — and the investments we need to make today to ensure future stability.”
Balancing Canada’s Population Growth and Ageing Through Immigration Policy
Canada faces twin demographic pressures: an ageing population and rapid population growth driven by immigration. The report argues that immigration levels must strike a careful balance – sufficient to offset some effects of low fertility and an ageing workforce, but not so high as to outpace infrastructure and economic capacity.
A sustainable population strategy requires coordinated planning across immigration, infrastructure, workforce participation, and capital investment. The report calls for long-term planning that aligns immigration policy with economic and social goals and emphasizes the need to manage absorptive capacity to avoid overburdening housing, healthcare, and public services.
Introduction
Declining fertility is a global trend and is especially pronounced in countries with high levels of economic development. These countries share the common challenge of ageing populations, with rising old-age dependency ratios (OADRs)1 and a shrinking portion of the population in prime working age. Several policy responses have been established to deal with this emerging reality, including pronatalist and other family-based social programs, efforts to enhance automation and productivity, incentivization of a larger proportion of the population to enter the formal labour force, delaying retirement benefits, and increasing the rate of immigration. The success of these approaches has varied, raising critical questions for policymakers: which strategies are the most efficient? What are their costs? And which policies offer the best balance between risk and reward?
This Commentary explores the potential role and limitations of immigration in alleviating Canada’s challenges of low fertility and ageing. This is a particularly opportune moment to consider such an issue given that both permanent and temporary immigration strongly increased between 2015 and 2024 and will be reduced for the 2025 to 2027 period.
Using custom demographic projections, this paper examines how various immigration scenarios – ranging from historical rates to the peak of 2024 – will affect Canada’s demographic outlook over the next 50 years. The analysis investigates the role immigration could play in mitigating the effects of an ageing population, while also acknowledging the associated trade-offs, including pressures on infrastructure and rapid population growth. The findings highlight that Canada’s immigration policy, while important, should be framed within a long-term population strategy that aligns immigration policy with broader economic and social goals – including capital investment, productivity, delayed retirement, and expanded social infrastructure – to ensure sustainable growth and enhanced prosperity for all Canadians.
Canada’s Demographic Challenge and Recent Immigration Policy Responses
Canada’s current demographic challenge is the product of two primary factors: low fertility and the ageing and retirement of the Baby Boom generation. Canada’s fertility rate first rapidly declined from the peak of the Baby Boom (1950s) to the early 1970s, when it first fell below the replacement level. Since then, it has continued with a slower, though persistent decline, interrupted by occasional slight recoveries. Most recent calculations reveal that Canada’s fertility rate is now at 1.26 – a level unprecedented in Canadian history and among the lowest globally. The consequences of low fertility are particularly pronounced today due to the ageing of the Baby Boom generation. In 2025, this cohort ranges in age from 59 to 79 years old, while the average age of retirement in Canada was 65.1 in 2023. Around two-thirds of boomers have already reached the age of 65, with the remaining third expected to follow in the coming years. The impact of this demographic shift is therefore ongoing and continues to affect the labour market and economy at large.
Throughout its history, Canada has turned to immigration to resolve demographic challenges (Hiebert 2016). From the late 1940s to the mid-1980s, Canada admitted an average of 150,000 permanent residents annually, though numbers fluctuated. By the end of that period, concerns over low fertility began to be articulated. This prompted the government to increase annual immigration levels to 250,000, a figure that was quite consistent over the following 30 years, with annual rates ranging from the low to high 200,000s. By the end of the 20th century, immigration accounted for over half of Canada’s population growth and labour force expansion.
The most recent shift in immigration policy began in late 2015 under the Liberal government, which pursued an expansionary strategy. Annual immigration targets and admission levels increased – save for the 2020 pandemic year – leading to a target of 500,000 for 2025. However, this target will no longer be realized following the revised plan announced at the end of 2024. Along with increased permanent immigration, the government had adopted a more facilitative approach to temporary migration, leading to rapid growth in the number of international students, temporary foreign workers, and other non-permanent residents. In 2023, the Canadian population expanded by 1.27 million, representing an annual growth rate of 3.2 percent, which is highly unusual among advanced economies. For example, the average population growth rate of the other G7 countries in 2023 was less than 0.5 percent (Scotiabank 2023).2
Given Canada’s low fertility, 98 percent of this growth stemmed from net immigration, both temporary and permanent (Statistics Canada 2024a). Today, Canada is approaching a point where all population growth and most of the impetus for population renewal (Dion et al. 2015) will come from immigration. However, the “big migration” trajectory of 2015 to 2024 has shifted. While public opinion historically supported ambitious immigration targets, this sentiment changed sharply in 2024. Concerns about housing shortages, infrastructure strain, and what has been termed a “population trap” – where population growth outpaces capital investment capacity – have fueled resistance to current immigration levels. These pressures clearly influenced the 2025 to 2027 plan, which curtails permanent immigration targets by approximately 20 percent and tightens restrictions on temporary migration programs.
Short- and Long-Term Immigration Policy
Before focusing on the relationship between immigration and demography, it is instructive to explore a fundamental tension in immigration policy: should the Government of Canada prioritize the “maximum social, cultural and economic benefits of immigration”3 for today or for the future? These goals may not always align: satisfying the needs of today may have long-term consequences – a trade-off familiar to anyone who has managed a budget.
It has been long underappreciated that Canada’s immigration policy is built around a combination of short- and long-term goals. Economic selection practices provide a helpful example. Since the introduction of the points system nearly 60 years ago, selection priorities have oscillated between addressing short-term labour market needs (e.g., incorporating and/or prioritizing job offers in selection criteria) and building the human capital of the future workforce, under the assumption that highly skilled individuals can adapt and drive productivity, and therefore prosperity. Striking the right balance between these priorities is challenging and requires careful planning.
The balance between short- and long-term immigration perspectives is reflected in the combination of the economic selection system and levels planning. The former – which includes permanent skilled immigration – involves trade-offs between filling immediate labour shortages and building future human capital.4 The latter determines the scale and composition of Canada’s permanent immigration system. In contrast, temporary migration programs are almost entirely shaped by short-term planning horizons – with the partial exception of the International Student Program, which operates in accordance with a medium-term planning horizon in five-year increments.5
These issues are pivotal to considerations of the relationship between immigration and demography. The impact of immigration extends beyond the number of admissions. If immigrants are selected to enhance the human capital of Canada’s workforce and integrate productively, they can potentially raise per capita GDP and mitigate the challenges of an ageing population (Erkisi 2023; Montcho et al. 2021). Conversely, if the system prioritizes lower-skilled individuals, fails to utilize the skills of highly educated immigrants, or admits newcomers at a scale that exceeds the economy’s capacity to absorb them, it risks lowering per capita GDP and compounding demographic challenges (Smith 2024).
Immigration, therefore, has both scale and compositional effects. Scale impacts include changes to population size, age structure, and regional distribution, which directly affect housing demand and social services. Compositional impacts include broader socioeconomic outcomes such as income inequality, productivity, and trade relationships. While this paper focuses on scale impacts, readers should bear these compositional effects in mind.
Another critical consideration is the relationship between admission levels and the expected economic outcome of admitted immigrants. In Canada’s Express Entry system, admission thresholds are adjusted based on the number of entries. Larger admission cohorts tend to lower the points threshold, potentially reducing the overall human capital of entrants (Mahboubi 2024).
Immigration and Canada’s Demographic Challenge
This paper argues that long-term considerations should play a larger role in immigration levels planning. Immigration decisions made today shape Canada’s demographic structure for decades, as immigrants become part of the population, contribute to fertility, enter the workforce, and eventually retire. These stages must be incorporated into demographic projections and policy planning, yet they are often overlooked due to the focus on immediate needs and political cycles.
To illustrate the long-term demographic impact of immigration, consider two extreme scenarios. In the first, Canada’s fertility rate declines to 1.0 (the 2023 rate in British Columbia) and net migration falls to zero, implying no population growth from migration. Under these conditions, Canada’s population would shrink from 40 million in 2023 to 12.3 million by 2100. In the second scenario, the extraordinary 2023 growth rate of 3.2 percent continues indefinitely, with rising migration levels. By 2100, Canada’s population would reach 452 million.
While neither of these scenarios is realistic, they illustrate the decisive influence that fertility and migration have in shaping the future scale of Canada’s population. Despite their seemingly preposterous nature, the key point remains: with fertility rates remaining low,6 the state is entirely responsible for determining the scale of the Canadian population. Decisions about temporary visas and permanent residence serve as the primary levers of control. Policymakers must recognize that the choices made today will have profound and lasting effects on Canada’s demographic and economic future.
Population Projections and Their Implications
Statistics Canada produced a recent population projection for various scenarios in January 2025, covering the period of 2024 to 2074.7 Across the scenarios, total fertility rates range from 1.13 to 1.66, permanent immigration rates vary from 0.70 to 1.2 percent per year, and net temporary migration figures are assumed to decline in the short term before stabilizing. The selected scenarios suggest that the projected population of Canada would range from 45.2 to 80.8 million in 2074 – a difference of over 35 million people, roughly equivalent to Canada’s current population. The scale of infrastructure and social investments needed to accommodate such growth would be enormous.
Beyond sheer numbers, government policy also affects the age structure of Canada’s future population. The OADR is expected to rise, and increased immigration is often proposed as a solution. However, the retirement age is, to an important extent, a social construct and this paper explores the efficiency of changing Canada’s retirement age compared with adjusting immigration levels to address the issue.
While migration can temporarily mitigate low fertility effects by maintaining a larger workforce, it cannot fully offset population ageing (Robson and Mahboubi 2018). Even doubling Canada’s population through immigration would only reduce the average age by five years, as immigrants’ average age is close to that of the receiving population (around 30 versus 40).8 Doyle et al. (2023) argue that increasing immigration could delay ageing impacts but would require continuously higher volumes, becoming unsustainable.9 Immigrants are typically concentrated in the labour force ages (25-40) but, in 30-35 years, this group will be approaching retirement, creating an economic challenge similar to the Baby Boom generation’s retirement. Unless increasing rates of immigration are in place continuously (an unrealistic scenario), at some point society must adjust to a smaller, older population.
Moreover, there appear to be additional costs to rapid population growth that are driven by high immigration. Doyle et al. (2023 and 2024) contend that when the labour force expands faster than investment in capital and infrastructure, the result is a dilution of capital per worker, reducing Canada’s productivity and living standards. This concern highlights not only the pace of immigration-driven growth but also Canada’s historically low levels of business and infrastructure investment, suggesting a need to boost investment alongside population growth.10
Research shows that while larger immigration targets increase real GDP through a larger labour supply, they could also reduce GDP per capita (El-Assal and Fields 2018).11 Indeed, in recent years of very high population growth through net international migration (2022-2023), Canada’s level of real GDP per capita has been stagnant.12
Furthermore, house price escalation associated with a surge in demand may negatively affect fertility decisions, particularly for families renting homes (Dettling and Kearney 2014; Fazio et al. 2024). In other words, compensating for low fertility through high rates of immigration may indirectly contribute to additional fertility decline.
Studies show that immigration alone has a limited impact on altering age composition (Robson and Mahboubi 2018). Even doubling immigration rates would only slightly improve the OADR (Beaujot 2001). All of the immigrants admitted by Canada between 1951 and 2001, for example, are believed to have reduced the median age of Canadians in 2001 by only 0.8 years.
The effect of younger immigrants, as seen in Australia’s approach, would improve outcomes,13 but Guillemette and Robson (2006) found that this impact would still be modest. An unintended consequence of focusing on younger immigrants is that it contrasts with Canada’s economic selection system, which rewards human capital development. Half of the 2022 Express Entry applicants were 30 or older (IRCC 2022), challenging the idea that immigration could rapidly reduce the average age of the population.14
A Custom Glimpse of the Future
To update our understanding of the role immigration could play in Canada’s demography, this section explores the results of a special population projection, using Statistics Canada’s microsimulation model called Demosim, to assess the impact of varying immigration rates on the Canadian population in the future. Two demographic outcomes are highlighted in this analysis: population size and the OADR.
While population size is a straightforward measure, the exclusive focus on the OADR – without also considering the youth dependency ratio (YDR) – may raise questions about the completeness of the analysis. After all, both young and older people place disproportionate demands on social services. One could also argue that increasing the rate of immigration (depending on the age profile of newcomers, other things being equal) could reduce the OADR while increasing the YDR. There are two major reasons for focusing on the OADR in this analysis. First, it is the most widely used indicator of the ageing population and has particularly profound impacts on the cost of healthcare, Canada’s most expensive social program.15 Second, while the YDR and OADR reflect dependency burdens, they have very different long-term implications: a high YDR represents a short-term fiscal cost but also an investment in the future workforce. In contrast, a rising OADR signals a more permanent shift in the age structure of the population, with fewer economic offsets. For these reasons, and to maintain analytical clarity and focus, the YDR has been omitted from this analysis.
Demographic variables used in the projection, except for the immigration rate, were either held constant (e.g., fertility rate at the 2023 level of 1.33 and the temporary resident population assumed to remain constant at around two million after 2021) or based on assumptions from recent Statistics Canada projections (e.g., emigration rate, life expectancy).16 Using the 2021 base population,17 projections were provided for 50 years. Six scenarios were created based on annual permanent immigration rates ranging from 0.3 percent to 1.8 percent. These correspond to immigration levels in 2025 between around 125,000 and 750,000, based on the 2024 Q4 population estimate of 41.5 million. From 2000 to 2015, the immigration rate averaged 0.6 percent per year (Scenario 2), rising to nearly 1.2 percent per year by 2024 (Scenario 4). The 2025-2027 immigration plan aligns with Scenario 3, at a rate of around 0.9 percent. In essence, the scenarios reflect both current and recent immigration rates, allowing for expansion or contraction, as shown in Table 1.
Population projections vary significantly across the scenarios (Figure 1). As Canada’s natural population growth is rapidly approaching zero and is expected to turn negative in the coming years – and with emigration remaining steady – an immigration rate of 0.3 percent of the population would result in virtually no net international migration. Under this scenario, the population would begin to decline slightly. At the same time, Canada’s OADR would more than double, rising from 29.5 retirees (65 and older) per 100 working-age individuals (18-64) to 48.2 in 2046 and 61.6 in 2071 (Figure 2).18 Such a demographic structure would be unprecedented and pose a significant challenge to economic prosperity. For context, Japan currently has the highest OADR globally, at approximately 48 per 100.19
The second scenario, reflecting Canada’s immigration levels from 2000 to 2015, would add 4.6 million to the population by 2046 and another two million by 2071. The OADR would rise to 44.5 by 2046 and 55.8 in 2071. The third scenario most closely aligns with the 2025 to 2027 immigration plan (though it excludes the projected reduction in temporary residents). If immigration remains at 0.9 percent of the population for the next 50 years, the national population would reach 55.6 million in 2071, and the OADR would be 50.8. The fourth scenario extends the higher 1.2 percent immigration rate from 2024, projecting a population of 67.2 million by 2071. Despite this growth, the OADR would still rise to 46.5 by 2071 – similar to Japan’s current level. Reducing the immigration target from 1.2 percent to 0.9 percent in the 2025-27 plan would result in 11.6 million fewer people by 2071, assuming a stable rate. The sixth scenario, though ambitious, is instructive. If IRCC raised the permanent immigration target to 1.8 percent annually and maintained it for 50 years, Canada’s population would increase to nearly 62 million by 2046 and exceed 91 million by 2071. Even with this growth, the OADR would still rise to 39.5 by 2071. A visual scan of the relevant figure suggests that it would take an immigration rate of around 2.7 percent per year to hold the dependency ratio constant. Moreover, it would be challenging to sustain Canada’s high-human-capital selection threshold in the Express Entry system under this scenario.
Note another important trend. Figure 1 shows that the population diverges across the six scenarios over time, demonstrating the growing efficiency of immigration rates in changing Canada’s population growth over time. In contrast, the OADRs across the scenarios in Figure 2 remain roughly parallel after 2046 and begin to converge a little in the later years, illustrating that immigration ultimately becomes less efficient at altering the age structure of the population over time. Why? A population with low fertility receiving a steady flow of younger immigrants will, in the short term, have a younger average age due to the immigrants’ youth. However, as the immigrant population ages, its average age eventually surpasses that of the receiving population, making the overall population older in the long term.20 Therefore, the effect of steady immigration on the age structure diminishes over time, and only a continuous increase in immigration would prevent this.
Further, it is also important to acknowledge that once there is a sustained period of high immigration (i.e., the case of Canada between 2015 and 2024), a dramatic reduction in the rate of immigration will result in a demographic “bulge” with a large cohort followed immediately by a smaller one – akin to the relationship between the Baby Boom and Generation X. This would ultimately set in motion the same demographic dynamic that Canada faces today, with the larger generation eventually retiring and the OADR increasing. The demographic lesson is clear: shocks in the age structure of a population – whether through dramatic increases or declines in fertility or through major changes in the rate of net migration – place stress on infrastructure and, if they are large, may challenge the long-term stability of the welfare state.
Before reflecting further on these findings, consider the impact of varied immigration rates on the cultural composition of the Canadian population (Vézina et al. 2024). In 2021, approximately 44 percent of the Canadian population had an immigrant background – either as non-permanent residents, immigrants, or individuals with at least one immigrant parent (see Table 2). Under the third scenario, which aligns with the 2025 to 2027 immigration plan, this proportion would nearly reverse by 2046 and change even more dramatically by 2071, with nearly two-thirds of all Canadians being persons with an immigrant background.21
Such a shift would redefine immigrant integration and public perceptions of multiculturalism. Whether this level of cultural change would be widely accepted remains uncertain. If the high 2024 immigration rate was sustained, nearly three-quarters of Canadians in 2071 would be either immigrants or children of immigrants.
Immigration and Other Policy Levers in Addressing Population Ageing
This section assesses how immigration compares to other policy tools in addressing the demographic challenges of an ageing population. Governments have several policy tools to either shape demography directly or mitigate societal consequences. The key concern in an ageing society is the impact of a shrinking labour force on the ability to sustain social services such as healthcare, education, and pensions. The principal direct policies are encouraging fertility and increasing immigration (Lee 2014). Governments can also address the fiscal impact of ageing by: boosting workforce participation among working-age adults; delaying retirement and enlarging the working-age population; raising tax rates; reducing expenditures – especially those related to the elderly population; and increasing the productivity of labour (Lee et al. 2014; Beaujot 2017). Some of these choices are more efficient than others. Pronatalist policies have been established in some 60 countries, yet none have been successful in restoring fertility to a replacement level (UNFPA 2019). Moreover, their effects tend to be short-lived.22
How efficient is immigration in mitigating population ageing and its effects? The data explored so far indicate that while increasing the rate of immigration is highly effective at generating population growth, it is less effective at significantly changing the age composition of the population. A recent analysis by British Columbia Ministry of Advanced Education and Skills Training provides additional depth on this issue.23 Their study presents a simple but informative labour force participation ratio: for every 10 permanent immigrants admitted to the province, six will find work relatively quickly, while the remaining four will be too young or old, pursuing education, or not immediately ready to join the labour market. This reflects the broader reality that approximately half of all economic-class immigrants are spouses and dependents and that only around 60 percent of immigrants are admitted through the economic class to begin with.
It would be tempting, but also simplistic, to see this as the direct impact of immigration on the labour force (i.e., 10 newcomers equate to six net new workers), but there is an important additional dimension that must be considered. Adding 10 people to the population generates consumer demand for goods and services including shelter, food, transportation, and many other things. Meeting this demand requires four additional workers. These four additional workers expand the scale of the economy but do not create net new workers (Fortin 2025).
When 10 newcomers are admitted, given that four will not immediately enter the labour force and another four workers will be required to satisfy extra consumer demand, only two net new workers are added. That is, to add one net new worker to the labour force requires five new permanent immigrants (and therefore approximately two additional dwellings). This is nicely summarized in a ratio: 10-6-4-2. There is no reason to expect that this ratio would be appreciably different in other provinces or Canada as a whole. Just as immigration is more efficient at increasing the size of the population than it is at changing the age structure, the same holds true for the relationship between immigration and net workers added to the labour force.
An example can help illustrate this point. Imagine an ageing society with a population of one million and 1,000 doctors. As more doctors retire than can be replaced through domestic training, the government looks to immigration to fill the gap. It estimates that 100,000 newcomers must be admitted, since only a small fraction of new immigrants will be doctors. This produces the desired effect, and the number of doctors remains stable. However, the population has grown to 1.1 million, and to preserve the same level of access to care, 1,100 doctors are now required. Simply stabilizing the labour force while adding population is an insufficient way to resolve emerging labour shortages because it ignores the additional demand created by population growth (Fortin 2025). This mirrors the earlier point: immigration adds workers, but it also adds consumers. As a result, the net gain to the labour force is much smaller than the headline number of newcomers might suggest.
It is beyond the scope of this paper to investigate the efficiency of all the other measures in mitigating the effects of ageing or increasing the size of the labour force. However, Figure 3 illustrates the demographic impact of one such lever – delaying the average retirement age to 70, compared to maintaining it at 65 – as an example to demonstrate how different policies vary in their ability to influence the OADR.
Figure 3 shows that, under this policy shift, maintaining immigration at the rate of the 2025 to 2027 plan (Scenario 3) would be sufficient to stabilize the OADR to 2046 – keeping it just below 30, similar to its level in 2021. None of the immigration scenarios alone achieve this outcome if the retirement age stays at 65. While the OADR increases over time in all scenarios, delaying retirement significantly slows both the pace and magnitude of this rise.24 However, the purpose of this example is not to propose a specific change. Instead, it highlights the relative effectiveness of this particular lever and emphasizes the need for a multifaceted strategy to address demographic challenges.
In summary, Canada’s demographic challenges stem from low fertility and the retirement of the Baby Boom generation. Immigration can delay and mitigate the effects of ageing but cannot fully counteract them without immediate and dramatic increases. As long as immigration remains within historical levels, ensuring a sufficient workforce will require a combination of immigration and complementary policies.25
Demography and Levels Planning
The policy dilemma implied by demographic realities is both straightforward and immensely complex: it is now impossible to maintain the age composition of the Canadian population while also maintaining its size without turning back the clock more than 50 years in terms of fertility. At the extremes, there are two stark policy choices: maintain the current size of the Canadian population but adjust expectations to accommodate a vastly higher OADR (approximately that of Scenario 1); or maintain the age structure of the Canadian population and plan for a vastly larger population (larger than any projected in the scenarios used in this study). The real policy choice will lie somewhere between these extremes and will require a combination of accommodations.
Table 3 summarizes more realistic options by showing the level of population increase and the different OADRs projected for 25 and 50 years forward. It compares the scenarios that most closely approximate Canada’s permanent immigration targets for the recent past – Scenario 2 (pre-2015 consensus), Scenario 4 (2024 rate), and Scenario 3 (2025 to 2027 plan). Had the Liberal government maintained the earlier rate of immigration after 2015 (that is, maintaining the 0.6 percent rate of immigration), Canada’s population would have grown by around 7.5 million by 2071, but with an OADR higher than any country today (55.8 senior citizens per 100 working-age people). By shifting to, and maintaining, a 1.2 percent annual immigration rate between 2015 and 2024, the population would grow much faster – by 29 million more people over half a century – while the OADR would be lower, at 46.5 per 100. Notice that the change in policy would lead to nearly four times the population growth compared to the reduction in the OADR, which improves by only 17 percent. Scaling back the rate of permanent immigration in 2025 to 2027 moderates both the population increase and the OADR improvement. Nevertheless, it would still yield a population growth of over 17 million in the next 50 years, with Canada’s OADR surpassing that of contemporary Japan.
Regardless of the choice being made, Canada will be both larger and older in the coming decades. This shift has significant implications and calls for strategic long-term planning. For example, the country will need to invest simultaneously in child benefits and new schools, as well as in elder care facilities. Housing demand will continue to mount unless significant changes occur in housing investment policies and outcomes. It also means investing in infrastructure to sustain key public services – such as increasing hospital capacity and expanding public transit. Without these adjustments, the quality of life for Canadians would decline. Crucially, this must occur while public finances are adjusted in light of a rising OADR (or the retirement age is raised).26 It also necessitates a continuing cultural diversification of the population through immigration and temporary migration. Ongoing and growing investments in social inclusion will be required.
The greatest challenge for government is to decide on the optimum balance between ageing and growth while securing public buy-in for immigration policies.27 All of this must occur against the backdrop of other pressing issues such as global climate change, geopolitical instability, technological change, and political polarization – not to mention the need to be mindful of the relationship between immigration, ethnocultural diversity, linguistic and religious groups, Indigenous Peoples, and other equity-seeking groups. Assiduous attention must be paid to Canada’s demographic challenge, despite these powerful intersecting concerns.
Consider financial investment, where growth is based on compounded rates of interest. One of the most common recommendations made by financial advisors is to harness the power of compounded growth by starting to invest early in one’s life. Even small amounts invested in one’s twenties can pay remarkable dividends forty years later. The same logic applies to population management; demographic choices today will have far-reaching consequences in subsequent decades. Adding four to five million to Canada’s population over the next decade cannot simply be undone at the end of that period. The same ageing pressures will remain, but with a larger population that may require even higher immigration levels. As long as fertility remains well below replacement, this issue will persist – regardless of Canada’s population size. There will always be the looming threat of population decline and its consequences.
Short and Long Policy Horizons
Population change is cumulative and difficult to reverse, making it imperative to consider the long-term implications of both temporary and permanent immigration together. This requires viewing them as components of the same system – particularly given the many pathways that allow temporary residents to transition to permanent status, and the increasing reliance on temporary residents within Canada’s permanent immigration system (Crossman et al. 2020). In recent years, temporary migration has increasingly become a kind of “down payment” to Canada’s permanent immigration system, a shift that has transformed Canada’s immigration system into a more fluid, two-step process, although this flow-through process may be interrupted given the latest levels plan (i.e., there is a large gap between the number of temporary residents in Canada and the “room” accorded to that population in the new plan). A comprehensive approach also demands that levels plans, which currently establish expectations for a three-year period, be developed with longer time horizons in mind.28 In other words, immigration levels should reflect Canada’s immediate priorities as well as its long-term goals, including the potential for future population renewal. The focus on present needs should not overshadow a forward-looking vision for the country, as current policies play a decisive role in shaping Canada’s future.29
A common point made in public discussion of Canadian immigration policy is that levels planning should pay more attention to absorptive capacity. This means aligning the number of both temporary and permanent residents with the growth of social services – notably education and healthcare – as well as housing and other infrastructure. The concept of absorptive capacity can be interpreted in passive or active terms. Under a passive approach, levels planning would be guided by the current state of social services and infrastructure including housing, which would determine the appropriate level of immigration (e.g., based on an acceptable range of physicians, housing completions, etc., per 1,000 persons). Conversely, an active approach would flip the direction of causality and establish the parameters of social spending and infrastructural investment based on population growth which, in an era of low fertility, is essentially a function of the scale of temporary and permanent immigration. In this latter situation, IRCC would play a more central role in national planning, as immigration targets would shape the long-term scale of government spending across a wide range of responsibilities. This process would be greatly facilitated by a conscious, long-term population strategy at the heart of levels planning. In such a framework, all sectors of society – government, private business, and non-profit social services – could make informed decisions to guide their investments with far more assurance of long-term patterns of demand. This would be a potent indirect benefit of a population-based approach to migration and immigration management.
There are important tradeoffs between these approaches. A passive approach may be more cautious and politically feasible in the short term, but risks underestimating long-term needs and perpetuating reactive policymaking. An active approach, by contrast, allows for proactive investment and planning – but only if there is full follow-through. If governments commit to population growth targets without ensuring that social and physical infrastructure keep pace, the result could be increased strain on housing, healthcare, and public trust.
While this paper supports an active approach, its core aim is to push for long-term thinking and to encourage an informed public conversation about the choices ahead.
Regardless of which approach is chosen, the issue of social license is key. As noted earlier, a majority of Canadians have recently come to believe that population growth generated by immigration has outstripped the development of social and physical infrastructure. In 2023, this growing perception led to a substantial shift in public support for the number of newcomers that were being admitted. The government must ensure that population growth, infrastructure capacity, and capital investment are aligned – and clearly communicated to the public. This means developing a population strategy alongside an economic strategy. These are not competing priorities, but complementary and mutually reinforcing goals.
Conclusion
Given its low fertility, Canada’s demographic and economic future would be bleak in the absence of immigration. Even under low immigration scenarios (0.3 and 0.6 percent of the population per year), Canada would enter uncharted territory with respect to its OADR. At the same time, immigration is more efficient at increasing the population size than it is at either adding net new workers to the economy or fundamentally altering the age structure of the population. Higher rates of immigration may address short-term labour shortages, provide important skills, and stimulate economic activity (a higher GDP), but their effect on prosperity (GDP per capita) depends on whether they are accompanied by robust productivity growth, capital investment, and innovation. Moreover, they present challenges to Canada’s infrastructure, particularly in housing supply and healthcare availability. Without such complementary investments, rapid population growth could lead to a population trap – where population growth outpaces investment capacity – ultimately lowering prosperity, and potentially worsening fertility rates.
Canada’s demographic future depends on policy decisions made today, which carry long-term consequences that require careful planning and adaptation. While immigration level planning includes multi-year targets and considers a range of factors, in practice it often focuses on managing short-term pressures rather than shaping a long-term population vision. With fertility rates at historic lows, Canada’s reliance on immigration for population growth is intensifying. While immigration is a relevant tool for mitigating population ageing, it cannot prevent Canada from ageing on its own. This impasse highlights the need for a comprehensive population strategy that aligns with a long-term economic strategy – recognizing that growth and economic planning are complementary, not competing, goals. The strategy must also balance population growth with the challenges of an ageing society and address social priorities, including ethnocultural diversity and inclusion, Canada’s linguistic landscape, and Indigenous reconciliation.
A sustainable path forward must integrate immigration with policies to boost workforce participation, promote productivity, incentivize capital investment, and consider measures such as delayed retirement, all while recognizing the potential social and economic trade-offs involved. Without a clear and proactive strategy, Canada risks mounting economic and social pressures. A well-managed, long-term population plan, grounded in both economic realities and social capacity, will be essential to maintaining prosperity and ensuring that growth benefits all Canadians. For The Silo, Daniel Hiebert -Emeritus Professor of Geography at the University of British Columbia.
References
Adcerà, Alicia, and Ana Ferrer. 2013. “The Fertility of Recent Immigrants to Canada.” IZA Discussion Paper Series 7289: 1-21. https://docs.iza.org/dp7289.pdf.
___________. 2017. “Canada: The case for stable population with moderately low fertility and modest immigration.” Canadian Studies in Population 44(3-4): 185-190.
Dettling, Lisa J., and Melissa Schettini Kearney. 2014. “House prices and birth rates: The impact of the real estate market on the decision to have a baby.” Journal of Public Economics 110(c): 82-100. https://ideas.repec.org/a/eee/pubeco/v110y2014icp82-100.html.
Dion, Patrice, Éric Caron-Malenfant, Chantal Grondin, and Dominic Grenier. 2015. “Long-Term Contribution of Immigration to Population Renewal in Canada: A Simulation.” Population and Development Review 41(1): 109-126. https://doi.org/10.1111/j.1728-4457.2015.00028.x.
Dungan, Peter, Tony Fang, Morley Gunderson, and Steve Murphy. 2023. “Macroeconomic Impacts of Immigration in the Canadian Atlantic Region: An Empirical Analysis Using the Focus Model.” IZA Institute of Labor Economics 16527: 1-25. https://docs.iza.org/dp16527.pdf
Fazio, Dimas, Tarun Ramadorai, Janis Skrastins, and Bernardus Ferdinandus Nazar Van Doornik. 2024. “Housing and Fertility.” SSRN Electronic Journal. https://dx.doi.org/10.2139/ssrn.5046571.
Fortin, Pierre. 2025. The Immigration Paradox: How an Influx of Newcomers Has Led to Labour Shortages. Commentary 677. Toronto: C.D. Howe Institute. February.
Laplante, Benoît. 2018. “The Wellbeing of Families in Canada’s Future.” Canadian Studies in Population 45(1-2): 24-32. https://doi.org/10.25336/csp29376.
Lee, Ronald D. 2014. “Macroeconomic Consequences of Population Aging in the United States: Overview of a National Academy Report.” American Economic Review 104(5): 234-239. https://www.aeaweb.org/articles?id=10.1257/aer.104.5.234.
Lee, Ronald, et al. 2014. “Is low fertility really a problem? Population aging, dependency, and consumption.” Science 346(6206): 229-234. https://doi.org/10.1126/science.1250542.
Montcho, Gilbert, Julien Navaux, Marcel Mérette, and Yves Carrière. 2021. “Comparing Public Transfers between Immigrants and Natives: A National Transfer Accounts Approach.” SSRN Electronic Journal. https://ssrn.com/abstract=3968396.
Romaniuk, Antole. 2017. “Stationary population, immigration, social cohesion, and national identity: What are the links and the policy implications? With special attention to Canada, a demographer’s point of view.” Canadian Studies in Population 44(3-4): 165-178. https://journals.library.ualberta.ca/csp/index.php/csp/article/view/29290.
Smith, Philip. 2024. “Accounting for the decline in Canada’s Real GDP Per Capita since Mid-2022.” International Productivity Monitor 46: 83-100. https://www.csls.ca/ipm/46/IPM_46_Smith.pdf.
Zhang, Haozhen, Jianwei Zhong, and Cédric de Chardon. 2020. “Immigrants’ net direct fiscal contribution: How does it change over their lifetime?” Canadian Journal of Economics/Revue canadienne d’économique 53(4): 1642-1662. https://doi.org/10.1111/caje.12477.
A special ‘Study in Brief’ via our friends at cdhowe.org
This study estimates the economic benefits of a new, dedicated passenger rail link in the Toronto-Québec City corridor, either with or without high-speed capabilities.
Cumulatively, in present value terms over 60 years, economic benefits are estimated to be $11-$17 billion under our modelled conventional rail scenarios, and $15-$27 billion under high-speed rail scenarios.
This study estimates economic benefits, rather than undertaking a full cost-benefit analysis. The analysis is subject to a range of assumptions, particularly passenger forecasts.
Introduction
Canada’s plans for faster, more frequent rail services in the Toronto-Québec City corridor are underway.
In 2021, the federal government announced plans for a new, high frequency, dedicated passenger rail link in the Toronto-Québec City corridor. More recently, the government has considered the potential for this passenger line to provide high-speed rail travel. These two options are scenarios within the current proposed rail project, which VIA-HFR has named “Rapid Train.” This paper analyzes the economic benefits of the proposed Rapid Train project, considering both scenarios, and by implication the costs of forgoing them.
The project offers substantial economic and social benefits to Canada. At a time when existing VIA Rail users must accept comparatively modest top speeds (by international standards) and regular delays, this project offers a dedicated passenger line to solve network capacity constraints. With Canada’s economy widely understood to be experiencing a productivity crisis (Bank of Canada 2024), combined with Canada seeking cost-effective approaches to reducing harmful CO2 emissions, the project offers both productivity gains and lower-emission transportation capacity. There are, in short, significant opportunity costs to postponing or not moving ahead with this investment and perpetuating the status quo in rail service.
The Toronto-Québec City corridor, home to more than 16 million people (Statistics Canada 2024) and generating approximately 41 percent of Canada’s GDP (Statistics Canada 2023), lacks the sort of fully modernized passenger rail service provided in comparable regions worldwide. For example, Canada is the only G7 country without high-speed rail (HSR) – defined by the International Union of Railways (UIC) as a train service having the capability to reach speeds of 250 km per hour. Congestion has resulted in reliability (on time performance) far below typical industry standards. Discussion about enhancing rail service in this corridor has persisted for decades. But delays come with opportunity costs. This Commentary adds up those costs in the event that Canada continues to postpone, or even abandons, investment in enhanced rail services.
The existing rail infrastructure in the Toronto-Québec City corridor was developed several decades ago and continues to operate within parameters set during that time. However, significant changes have occurred since then, including higher population growth, economic development, and shifting transportation patterns. Rising demand for passenger and freight transportation – both by rail and other modes – has increased pressure on the region’s transportation network. There is increasing need to explore the various mechanisms through which enhancements to rail service could affect regional economic outcomes.
According to Statistics Canada (2024), the Toronto-Québec City corridor is the most densely populated and heavily industrialized region in Canada. This corridor is home to 42 percent of the country’s total population and comprises 43 percent of the national labor market. Transport Canada’s (2023) projections indicate that by 2043, an additional 5 million people will reside in Québec and Ontario, marking a 21 percent increase from 2020. This population growth will comprise more than half of Canada’s overall population increase over the period. As the population and economy continue to expand, the demand for all modes of transportation, including passenger rail, will rise. The growing strain on the transportation network highlights the need for infrastructure improvements within this corridor. In 2019, passenger rail travel accounted for only 2 percent of all trips in the corridor, with the vast majority of journeys (94 percent) undertaken by car (VIA-HFR website). This distribution is more skewed than in other countries with high-speed rail. For example, between London and Paris, aviation capacity has roughly halved since the construction of a high-speed rail link (the Eurostar) 25 years ago, which now has achieved approximately 80 percent modal share (Morgan et al. 2025, OAG website 2019). As such, there is potential for rail to have a greater modal share in Canada, particularly as the need for sustainable and efficient transportation solutions becomes more pressing in response to population growth and environmental challenges.
In practical terms, the cost of not proceeding with the Rapid Train project can be estimated as the loss of economic benefits that could have been realized if the project had moved forward. It should be noted that this study does not undertake a full cost-benefit analysis (CBA) of the proposed investment. Rather, it examines the various economic advantages associated with introducing the proposed Rapid Train service in the Toronto-Québec City corridor. Specifically, it analyzes five key dimensions of economic impact: rail-user benefits, road congestion reduction, road network safety improvements, agglomeration effects (explained below), and emission savings. The first three benefits primarily impact individuals who would have travelled regardless, or were induced to travel by rail or car. Agglomeration benefits extend to everyone living in the corridor, while emission savings contribute to both national and international efforts to combat climate change. In each of these ways, enhanced rail services can contribute to regional economic growth and sustainability. By evaluating these aspects, this study aims to develop quantitative estimates of the benefits that enhanced rail services could bring to the economy and society, and by doing so indicate the potential losses that could result from forgoing the proposed rail investment.
Rail user benefits constitute the most direct economic gains. Through faster rail transport with fewer delays, rail users experience reduced travel times, increased service reliability, and improved satisfaction. The Rapid Train project provides rail-user benefits because dedicated passenger tracks would remove the need to give way to freight transport, thus reducing delays. The Rapid Train project would see further benefits with faster routes reducing travel time.
Congestion effects extend beyond individual transportation choices to influence broader economic activity. This study considers how enhanced rail services might affect road congestion levels in key urban centres and along major highways within the corridor. Road network safety is a further aspect of the economic analysis in this study, as modal shift from road to rail could reduce road traffic accidents and their associated economic costs.
Agglomeration economies are positive externalities that arise from greater spatial concentration of industry and business, resulting in lower costs and higher productivity. Greater proximity results in improved opportunities for labour market pooling, knowledge interactions, specialization and the sharing of inputs and outputs (Graham et al. 2009). Improved transportation (both within and between urban areas) can support agglomeration economies by improving connectivity, lowering the cost of interactions and generating productivity gains.1 Supported by academic literature (Graham 2018), these wider economic benefits are included within international transportation appraisal guidance (Metrolinx 2021, UK Department for Transport 2024). Agglomeration effects from enhanced connectivity offer economic benefits distinct from (and additional to) benefits for rail users.
Environmental considerations, particularly emission savings, constitute a further economic benefit. This analysis examines potential reductions in transportation-related emissions and their associated economic value, including direct environmental costs. This examination includes consideration of how modal shifts might influence the corridor’s overall carbon footprint and its associated economic impacts.
The methodology employed in this analysis draws from established economic assessment frameworks while incorporating recent developments in transportation economics. The study utilizes data from VIA-HFR, Statistics Canada, and several other related studies and research papers. Where feasible, the analysis utilizes assumptions that are specific to the Toronto-Québec City corridor, recognizing its unique characteristics, economics, and demographic patterns.
The findings presented here may facilitate an understanding of how different aspects of rail service enhancement might influence economic outcomes across various timeframes and stakeholder groups. This analysis acknowledges that while some benefits may be readily quantifiable, others involve more complex, long-term economic relationships that require careful consideration within the specific context of the Toronto-Québec City corridor.
Based on our modelling and forecasts, the proposals for passenger rail infrastructure investment in the Toronto-Québec City corridor would present substantial economic, environmental, and social benefits (see Table 4 in the Appendix for a full breakdown, by scenario). Our scenario modelling is undertaken over a 60-year period, with new services coming on-stream from 2039, reported in 2024 present value terms. The estimated total of present value benefits ranges from $11 billion in the most conservative passenger growth scenario, to $27 billion in the most optimistic growth scenario. Cumulatively, in present value terms, economic benefits are estimated to be $11-$17 billion under our modelled conventional rail scenarios, and larger – $15-$27 billion – under high-speed rail scenarios. This is subject to a range of assumptions and inputs, including passenger forecasts.
These estimated benefits are built-up from several components. User benefits – stemming from time savings, increased reliability, and satisfaction with punctuality – are the largest component, with an estimated value of $3.1-$9.2 billion. Economic benefits from agglomeration effects (leading to higher GDP) are estimated at $2.6-$3.9 billion, while environmental benefits from reduced greenhouse gas emissions are estimated at $2.6-$7.1 billion. Additional benefits include reduced road congestion, valued between $2.0-$5.9 billion, and enhanced road safety, which adds an estimated $0.3-$0.8 billion. In addition, further sensitivity analysis has been undertaken alongside the main passenger growth scenarios.
Overall, the findings in this study demonstrate and underscore the substantial economic benefits of rail investment in the Toronto-Québec City corridor, and the transformative potential impact on the Toronto-Québec City region from economic growth and sustainable development.
Finally, there are several qualifications and limitations to the analysis in this study. It considers the major areas of economic benefit rather than undertaking a full cost-benefit analysis or considering wider opportunity costs, such as any alternative potential investments not undertaken. It provides an economic analysis, largely building on VIA-HFR passenger forecasts, rather than a full bottom-up transport modelling exercise. Quantitative estimates are subject to degrees of uncertainty.
The Current State of Passenger Rail Services in Ontario and Québec
The Toronto-Québec City corridor is the most densely populated and economically active region of the country. Spanning major urban centres such as Toronto, Ottawa, Montreal, and Québec City, this corridor encompasses more than 42 percent of Canada’s population and is a vital artery for both passenger and freight transport. Despite the significance of the corridor and the economic potential it holds, passenger rail services in Ontario and Québec face numerous challenges, and their overall state remains a topic of debate.
Passenger rail services in the region are primarily provided by VIA Rail, the national rail operator, along with commuter rail services like GO Transit in Ontario and Exo in Québec. VIA Rail operates intercity passenger trains connecting major cities in the Toronto-Québec City corridor, offering an alternative to driving or flying. VIA Rail’s most popular routes include the Montreal-Toronto and Ottawa-Toronto services, which run multiple times per day and serve business travellers, tourists, and daily commuters.
In addition to VIA Rail’s existing medium-to-long-distance services, commuter rail services play a key role in daily transportation for residents of urban centres like Toronto and Montreal. GO Transit, operated by Metrolinx, is responsible for regional trains serving the Greater Toronto and Hamilton Area, while Exo operates commuter trains in the Montreal metropolitan area. These services provide essential links for suburban commuters travelling to and from major employment hubs.
One of the primary challenges facing passenger rail services in Ontario and Québec is that the vast majority of rail infrastructure used by VIA Rail is owned by freight rail companies and is largely shared with freight trains, which means that passenger trains are regularly required to yield to freight traffic. This leads to frequent delays and slower travel times, making passenger rail less attractive compared to other modes of transport, especially for travellers who prioritize frequency, speed and punctuality. The absence of dedicated tracks for passenger rail is a major obstacle in improving travel times and increasing the frequency of service. Without addressing this issue, it is difficult to envisage a significant modal shift towards passenger rail, with cars having greater flexibility, and planes offering faster travel speeds once airborne. Much of the rail network was constructed several decades ago, and despite periodic maintenance and upgrades, it is increasingly outdated in its inability to facilitate higher speeds.
Passenger rail has the potential for low emission intensity. However, some of the potential environmental benefits of rail services in Ontario and Québec have yet to be fully realized. Many existing VIA Rail trains operate on diesel fuel, contributing to greenhouse gas emissions and air pollution. The transition to electrified rail, which would significantly reduce emissions, has been slow, and there is currently no comprehensive plan for widespread electrification of existing VIA Rail passenger rail services in the region.
The current state of rail passenger services in Ontario and Québec – and the opportunities for improvement – have prompted the development of the Rapid Train project along the Toronto-Québec City corridor, which proposes to reduce travel times between major cities and provide a more competitive alternative to air and car travel. The project would also generate significant environmental benefits by reducing greenhouse gas emissions associated with road and air transport. Furthermore, by investing in enhanced rail services, journey times would be further cut, generating additional time savings and associated economic benefits.
Current Government Commitment to Enhanced Rail Services
The Rapid Train project plans to introduce approximately 1,000 kilometres of new, mostly electrified, and dedicated passenger rail tracks connecting the major city centres of Toronto, Ottawa, Montreal, and Québec City. As such, it would be one of the largest infrastructure projects in Canadian history. It is led by VIA-HFR, a Crown corporation that collaborates with several governmental organizations, including Public Services and Procurement Canada, Housing, Infrastructure and Communities Canada; Transport Canada and VIA Rail, all of which have distinct roles during the procurement phases. Subject to approval, a private firm or consortium is expected to be appointed to build and operate these new rail services, via a procurement exercise (see below).
This new rail infrastructure would improve the frequency, speed, and reliability of rail services, making it more convenient for Canadians to travel within the country’s most densely populated regions. The project has the potential to shift a significant portion of travel from cars (which currently account for 94 percent of trips in the Toronto-Québec City corridor) to rail (which represents just 2 percent of total trips).
The project also seeks to contribute to Canada’s climate goals by reducing greenhouse gas emissions. Electrified trains and the use of dual-powered technology (for segments of the route that may still require diesel) will significantly reduce the environmental footprint of intercity travel. The project is expected to improve the experience for VIA Rail users, as dedicated passenger tracks will reduce delays caused by freight traffic, offering passengers faster, more frequent departures, and shorter travel times.
Beyond environmental benefits, the project is expected to stimulate economic growth by creating new jobs in infrastructure development, supporting new economic centres, and enhancing connectivity between cities, major airports, and educational institutions.
The project is currently at the end of the procurement phase, following the issuance of a Request for Proposals (RFP) in October 2023. Through the procurement exercise, a private-sector partner will be selected to co-develop and execute the project. The design phase, which may last four or more years, will involve regulatory reviews, impact assessments, and the development of a final proposal to the government for approval. Once constructed, passenger operations are expected to commence by 2040.
The Rapid Train project also offers opportunities to improve services on existing freight-owned tracks. VIA Rail’s local services, which currently operate between these major cities, will benefit from integration with this project. Although final service levels are not yet determined, the introduction of a new dedicated passenger rail line is expected to enable VIA Rail to optimize operating frequencies and schedules, leading to more responsive and efficient service for passengers. In turn, this will mean that departure and arrival times can be adjusted to better suit travellers’ needs, reducing travel times and increasing the attractiveness of rail as a mode of transportation for both leisure and business. As many of VIA Rail’s existing passenger services switch onto dedicated tracks, there is potential to free up capacity on the existing freight networks. As such, freight rail traffic may benefit from reduced congestion, supporting broader economic growth by easing supply chains and by improving the efficiency of goods transportation across Canada.
The project design will enable faster travel compared to existing services, but as the co-development phase progresses, it will examine the possibility of achieving even higher speeds on certain segments of the dedicated tracks. Achieving higher speeds is not guaranteed, due to the extensive infrastructure changes required and its associated costs, e.g., full double-tracking and the closure of approximately 1,000 public and private crossings. However, the project design currently incorporates flexibility to explore higher speeds where there may be opportunities for operational and financial efficiencies and additional user benefits.
The current Rapid Train project proposal seeks to achieve wider social and government objectives. In the context of maintaining public ownership, private-sector development partners will be required to respect existing labor agreements. VIA Rail employees will retain their rights and protections, with continuity ensured under the Canada Labour Code and relevant contractual obligations.
International Precedent
High-Speed Rail (HSR) already exists in many countries, with notable examples of successful implementation in East Asia and Europe. As of the middle of 2024, China has developed the world’s largest HSR network spanning over 40,000 kilometres, followed by Spain (3,661 km), Japan (3,081 km), and France (2,735 km) (Statista 2024). Among the G7 nations, Canada stands as the only country without HSR infrastructure, albeit the United States maintains relatively limited high-speed operations through the Acela Express in the Northeast Corridor. Recent significant HSR developments include China’s Beijing-Shanghai line (2,760 km), which is the world’s longest HSR route. In Europe, the UK’s High Speed 1 (HS1) connects London to mainland Europe via the Channel Tunnel. Italy has extended its Alta Velocità network with the completion of the Naples-Bari route in 2023, significantly reducing travel times between major southern cities (RFI 2023). Morocco recently became the first African nation to implement HSR with its Al Boraq service between Tangier and Casablanca (OCF 2022). In Southeast Asia, Indonesia’s Jakarta-Bandung HSR, completed in 2023, is the region’s first HSR system (KCIC 2023). India is installing the Mumbai-Ahmedabad HSR corridor, the country’s first bullet train project, which is scheduled to commence partial operations by 2024 (NHSRCL 2023).
The economic impacts of HSR have been extensively studied, particularly in Europe. In Germany, Ahlfeldt and Feddersen (2017) analyzed the economic performance of regions along the high-speed rail line between Cologne and Frankfurt: the study found that, on average, six years after the opening of the line, the GDP of regions along the route was 8.5 percent higher than their estimated counterfactual. In France, Blanquart and Koning (2017) found that the TGV network catalyzed business agglomeration near station areas, with property values increasing by 15-25 percent within a 5km radius of HSR stations. An evaluation of the UK’s HS1 project estimated cumulative benefits of $23-$30 billion (2024 prices, present value, converted from GBP) over the lifetime of the project, excluding wider economic benefits (Atkins 2014).
Modal shift and passenger growth is a critical driver of economic benefits. The Madrid-Barcelona corridor in Spain provides an example: HSR captured over 60 percent of the combined air-rail market within three years of operation, demonstrating that HSR can have a competitive advantage over medium-distance air travel (Albalate and Bel 2012). However, analysis by the European Court of Arbiters (2018) suggests that HSR routes require certain volumes of passengers (estimated at nine million) to become net beneficial, and while some European HSR routes have achieved this level (including the Madrid-Barcelona route), others have not. In the US, the Amtrek Acela service between Boston and Washington D.C. is estimated to have 3-4 million passengers (Amtrek 2023). For some high-speed rail lines, passenger volumes are supported by government environment policy. For example, Air France was asked directly by the government to reduce the frequency of short haul flights for routes where a feasible rail option existed (Reiter et al. 2022). Overall, passenger growth constitutes a key assumption regarding the benefits derived from the Rapid Train project.
Regarding the environmental benefits of HSR, a detailed study by the European Environment Agency (2020) found that HSR generates approximately 14g of CO2 per passenger-kilometre, compared to 158g for air travel and 104g for private vehicles. In Japan, the Central Japan Railway Company reports that the Shinkansen HSR system consumes approximately one-sixth the energy per passenger-kilometre compared to air travel. The UIC’s Carbon Footprint Analysis (2019) demonstrated that HSR infrastructure, despite high initial carbon costs during construction, typically achieves carbon neutrality within 4-8 years of operation through reduced emissions from modal shift.
Socioeconomic benefits of HSR extend beyond direct impacts on rail users. In Spain, the Madrid-Barcelona high-speed rail line enhanced business interactions by allowing for more same-day return trips and improved business productivity (Garmendia et al. 2012). Research has found that Chinese cities connected by HSR experienced a 20 percent increase in cross-regional business collaboration, providing potential evidence of enhanced knowledge spillovers and innovation diffusion (Wang and Chen 2019).
However, the implementation of HSR is not without challenges. Flyvbjerg’s (2007) analysis of 258 transportation infrastructure projects found that rail projects consistently faced cost overruns averaging approximately 45 percent. For example, the costs of the California High-Speed Rail project in the United States rose from an initial estimate of $33 billion in 2008 to over $100 billion by 2022, highlighting the importance of realistic cost projections and robust project management.
Positive labor market impacts are also evident, although varied by region. Studies in Japan by Kojima et al. (2015) found that cities served by Shinkansen experienced a 25 percent increase in business service employment over a 10-year period after connection. European studies, particularly in France and Spain, show more modest but still positive employment effects, with employment growth rates 2-3 percent higher in connected cities compared to similar unconnected ones (Crescenzi et al. 2021).
For developing HSR networks, international experience suggests several critical success factors. These include careful corridor selection based on population density and economic activity, integration with existing transportation networks, and sustainable funding mechanisms. The European Union’s experience, documented by Vickerman (2018), emphasizes the importance of network effects in finding that the value of HSR increases significantly when it connects multiple major economic centres.
Methodology
This study integrates data from VIA-HFR, Statistics Canada, prior reports on rail infrastructure proposals in Canada, and related studies, to build an economic assessment of potential benefits of the proposed Rapid Train project. Key assumptions throughout this analysis are rooted in published transportation models, modelling guidelines, and an extensive body of research. The methodology draws extensively from the Business Case Manual Volume 2: Guidance by Metrolinx, which itself draws upon the internationally recognized transportation appraisal guidelines set by the UK government’s Department for Transport (DFT). These established guidelines offer best practices and standards that provide a structured and reliable framework for estimating benefits. By aligning with proven methodologies in transportation and infrastructure project appraisal, this study ensures rigor and robustness within the economic modelling and analysis.
The proposed route includes four major stations: Toronto, Ottawa, Montréal, and Québec City. These major urban centres are expected to experience the most significant ridership impacts and related benefits. There are three further stations on the proposed route – Trois-Rivières, Laval, and Peterborough – although these are anticipated to have a more limited effect on the overall modelling results, due to their smaller populations. Based on forecast ridership data provided by VIA-HFR for travel between the four main stations, our model designates these areas as four separate zones to facilitate the benefit estimation. Figure 1 below illustrates the proposed route for the Rapid Train project and highlights the different zones modeled in this analysis.
According to current VIA-HFR projections, the routes are expected to be operational between 2039 and 2042. In line with typical transport appraisals, this paper estimates and monetizes economic and social benefits of the project over a 60-year period, summing the cumulative benefits from 2039 through to 2098, inclusive. To calculate the total present value (as of 2024) of these benefits, annual benefits are discounted at a 3.5 percent social discount rate, in line with Metrolinx guidance, and then aggregated across all benefit years.
Our model examines multiple scenarios to assess the range of potential benefits under various conditions. The primary scenarios within the Rapid Train project are for Conventional Rail (CR) and High-Speed Rail (HSR). These scenarios are distinguished by differences in average travel time, with HSR benefiting from significantly faster speeds than CR, and therefore lower travel times (see Table 2).
Within each of these scenarios, we consider three sub-scenarios from VIA-HFR’s modelled passenger projections – central, downside and upside – plus a further sub-scenario (referred to as the 2011 feasibility study in the Figures) based on previous modelled estimates of a dedicated passenger rail line in the corridor. The central sub-scenario provides VIA-HFR’s core forecast for passenger growth under CR and HSR. The upside sub-scenario reflects VIA-HFR’s most optimistic assumptions about passenger demand, while the downside represents the organisation’s more cautious assumptions.
The use of VIA-HFR’s passenger projections is cross-checked in two ways: First, our analysis models an alternative passenger growth scenario (2011 feasibility study), which is based upon the projected growth rate for passenger trips as outlined in the Updated Feasibility Study of a High-Speed Rail Service in the Québec City – Windsor Corridor by Transport Canada (2011).2 The analysis in that study was undertaken by a consortium of external consultants. Second, we have reviewed passenger volumes in other jurisdictions (discussed above and below).
In the absence of investment in the Rapid Train project, VIA-HFR’s baseline scenario passenger demand projections indicate approximately 5.5 million trips annually by 2050 using existing VIA Rail services in the corridor. In contrast, with investment, annual projected demand for CR ranges from 8 to 15 million trips, and for HSR between 12 and 21 million trips by 2050, across all the sub-scenarios described above. Figures 2 and 3 illustrate these projected ridership figures under CR and HSR scenarios across each sub-scenario, as well as compared to the baseline scenario.
Under the CR and HSR scenarios, while the vast majority of rail users are expected to use the new dedicated passenger rail services, VIA-HFR passenger forecasts indicate that some rail users within the corridor will continue to use services on the existing VIA Rail line, for example, due to travelling between intermediate stations (Kingston-Ottawa). The chart below illustrates the breakdown of benefits under the central sub-scenario for high-speed rail.
User Benefits
User benefits in transportation projects such as CR/HSR can be broadly understood as the tangible and intangible advantages that rail passengers gain from improved services. These benefits encompass the value derived from time saved, enhanced reliability, reduced congestion, and improved overall travel experience. For public transit projects like CR/HSR, user benefits are often key factors in justifying the investment due to their broad social and economic impact.
Rail infrastructure projects can reduce the “generalized cost” of travel between areas, which directly benefits existing rail users, as well as newly induced riders. The concept of generalized cost in transportation economics refers to the total cost experienced by a traveller, considering not just monetary expenses (like ticket prices or fuel) but also non-monetary factors such as travel time, reliability, comfort, and accessibility.
Investments that improve transit may reduce generalized costs in several ways. Consistent, on-time service lowers the uncertainty, inconvenience and dissatisfaction associated with delays. More frequent services provide passengers with greater flexibility and reduced waiting times. Reduced crowding can offer more comfortable travel, reducing the disutility associated with congested services. Enhanced services like better seating, Wi-Fi, or improved station facilities may increase user satisfaction. Better access to transit stations or stops may allow for easier integration into daily commutes, increasing the convenience for existing and new travellers. Faster travel can reduce travel time, which is often valued highly by passengers.
In this paper, user benefits are estimated based on three core components: travel time savings based on faster planned journey times, enhanced reliability (lower average delays on top of the planned journey time), and the psychological benefit of more reliable travel. In our analysis, the pool of users is comprised of the existing users who are already VIA Rail passengers within this corridor, plus new users who are not prior rail passengers. Within this category of new users there are two sub-groups. First, new users include individuals who are forecast to switch to rail from other modes of transport, such as cars, buses, and airplanes – known as “switchers.” Second, new users also include individuals who are induced to begin to use CR/HSR as a result of the introduction of these new services – known as “induced” passengers. Overall, this approach captures the comprehensive user benefits of CR/HSR, recognizing that time efficiency, increased dependability, and greater customer satisfaction hold substantial value for both existing and new riders. The split of new users across switchers and induced users – including the split of induced users between existing transport modes, primarily road and air – is based on the federal government’s 2011 feasibility study, although the modelling in this Commentary also undertakes sensitivity analysis using VIA-HFR’s estimates for these proportions. The approach to estimating rail-user benefits is discussed below.
The modelling in this study incorporates projections of passenger numbers for both existing VIA Rail services (under a ‘no investment’ scenario) and for the proposed CR/HSR projects, sourced from VIA-HFR transport modelled forecasts. This enables the derivation of forecasts for both existing and new users.
In line with the formula (above) for user benefits, this study estimates the reduction in generalized costs (C1 – C0 ) arising from the new CR/HSR transportation service. Since the ticket price for the proposed CR/HSR is still undetermined, we have not assumed any changes versus current VIA Rail fares, although this is discussed as part of sensitivity analysis. The model reflects a reduction in generalized costs attributed to shorter travel times and enhanced service reliability under CR/HSR. Table 2 shows a comparison of the average scheduled journey times (as of 2023) for existing VIA Rail services, compared to forecast journey times under the proposed CR/HSR services, across different routes.
In addition to travel time savings based on scheduled journey times, an important feature of the CR/HSR project is that a new, dedicated passenger rail line can reduce the potential for delays. To estimate the reduction in travel delays under CR/HSR, we first calculated a lateness factor for both existing VIA Rail and the proposed CR/HSR, based on punctuality data and assumptions. Current data indicate that VIA Rail services are on time (reaching the destination within 15 minutes of the scheduled arrival time) for approximately 60 percent of journeys. Therefore, VIA Rail experiences delays (arriving more than 15 minutes later than scheduled) approximately 40 percent of the time. Data showing the average duration of delays are not available, and therefore we estimate that each delay is 30 minutes on average, based on research and discussions with stakeholders. CR/HSR would provide a dedicated passenger rail service, which would have a far lower lateness rate. Our model assumes CR/HSR would aim to achieve significantly improved on-time performance, with on-time arrivals (within 15 minutes) for 95 percent of journeys (Rungskunroch 2022), which equates to 5 percent (or fewer) of trains being delayed upon arrival.
Combined, there are time savings to users from both faster scheduled journeys and fewer delays. The estimated travel time savings are derived from the difference between the forecast travel times of CR/HSR and the average travel times currently experienced with VIA Rail. The value of time is monetized by applying a value of $21.45 per hour, calculated by adjusting the value of time recommended by Business Case Manual Volume 2: Guidance-Metrolinx ($18.79 per hour, in 2021 dollars) to 2024 dollars using the Consumer Price Index (CPI). This value remains constant (in real terms) over our modelling period.
There is an additional psychological cost of unreliability associated with delays. Transport appraisal guidelines and literature typically ascribe a multiplier to the value of time for unscheduled delays. The modelling in this study utilizes a multiplier of 3 for lateness, which is consistent with government transport appraisal guidance in the UK and Ireland (UK’s Department for Transport 2015, Ireland’s Department of Transport 2023). Some academic literature finds that multipliers may be even higher, although it varies according to the journey distance and purpose (Rossa et al. 2024). Overall, the lateness adjustment increases the value to rail users of CR/HSR due to its improved reliability and generates a small uplift to the total user benefits under CR/HSR.
The modelling combines these user benefits and makes a final adjustment to net off indirect taxes, ensuring that economic benefits are calculated on a like-for-like basis with costs incurred by VIA-HFR (Metrolinx 2021). Individual users’ value of time implicitly takes into account indirect taxes paid, whereas VIA-HFR’s investments are not subject to indirect taxation. Ontario’s rate of indirect taxation (13 percent harmonized sales tax rate) has been used in the modelling (Metrolinx 2021).
The modelling does not assume any variation in ticket prices under the proposed CR/HSR services, relative to existing VIA Rail services. User benefits in the analysis are derived purely from the shorter journey times and improved reliability. This approach enables the estimation, in the first instance, of the potential benefits from time savings and reliability. While CR/HSR ticket prices are not yet determined, it is nevertheless possible to consider the impact of changes to ticket prices as a secondary adjustment, which is discussed in the sensitivity analysis further below.
Congestion and Safety on the Road Network
In addition to rail-user benefits, the proposed CR/HSR project would also provide benefit to road users via decongestion and a potential reduction in traffic accidents.
When new travel options become available, such as improved rail services, some travellers shift from driving to using transit, reducing the number of vehicles on the road. This reduction in vehicle-kilometres travelled (VKT) decreases road congestion, providing benefits to the remaining road users. Decreased congestion leads to faster travel times, and can also lower vehicle operating costs, particularly in terms of fuel efficiency and vehicle wear-and-tear.
Our research model includes a forecast of how improvements in rail travel could lead to decongestion benefits for auto travellers in congested corridors. Through CR/HSR offering a faster and more reliable journey experience versus existing VIA Rail services, VIA-HFR’s passenger modelling forecasts shifts in travel patterns, with a significant proportion of new rail users being switchers from roads. These shifts reduce road congestion and in turn generate welfare benefits for those continuing to use highways.
Analysis of Canadian road use data, cross-checked with more granular traffic data from the UK, suggests that the proportion of existing road VKT is 37 percent in peak hours and 63 percent in off-peak hours, based on Metrolinx’s daily timetable of peak versus non-peak hours (Metrolinx 2021, Statistics Canada 2014, Department for Transport 2024). Using this information, the estimated weighted average impact of road congestion is approximately 0.004 hours/VKT. Time savings are converted into monetary values (using $21.45/hour, in 2024 dollars) to estimate the economic benefits of reduced road congestion.
In practice, road networks are unlikely to decongest by the precise number of transport users who are forecast to switch from road to rail. First, the counterfactual level of road congestion (without CR/HSR) will change over time, as a function of population growth, investment in road networks (such as through highway expansion), developments in air transport options, and wider factors. Many of these factors are not known precisely (e.g., investment decisions regarding highways expansion across the coming decades), therefore the counterfactual is necessarily subject to uncertainty. Second, if some road users switch to rail due to investment in CR/HSR, the initial (direct) reduction in congestion would reduce the cost of road travel, inducing a subsequent (indirect) “bounce-back” of road users (known as a general equilibrium effect). The modelling of congestion impacts in this study is necessarily a simplification, focusing on the direct impacts of decongestion, based on the forecast number of switchers from road to rail.
In addition to decongestion, CR/HSR may also improve the overall safety of the road network through fewer vehicle collisions. Collisions not only cause physical harm but also cause economic and social costs. These include the emotional toll on victims and families, lost productivity from injuries or fatalities, and the costs associated with treating accident-related injuries. Road accidents can cause disruptions that delay other travellers, adding additional economic costs, and can also incur greater public expenditure through emergency responses.
With CR/HSR expected to shift some users from road to rail, this study models the forecast reduction in overall road VKT. This estimate for the reduction in road VKT is converted into a monetary value assuming $ 0.09/VKT in 2024 prices, which is discounted in future years by 5.3 percent per annum to account for general safety improvements on the road network over time (such as through improvements in technology) and fewer accidents per year (Metrolinx 2018, Metrolinx 2021).
Agglomeration
Agglomeration economies are the economic benefits that arise when firms and individuals are located closer to one another. This generates productivity gains which are additional to direct user benefits. These gains can stem from improved labor market matching, knowledge spillovers, and supply chain linkages, benefiting groups of firms within specific industries (localization economies) as well as across multiple industries (urbanization economies). Where businesses cluster more closely – such as within dense, urbanized environments – these businesses benefit from proximity to larger markets, varied suppliers, and accessible public services. For instance, if a manufacturing firm relocates to an urban hub such as Montreal, productivity benefits may ripple across industries as the economic density and activity scale of the area increases. Agglomeration can enable longer-term economic benefits, through collaboration across businesses, universities, and research hubs, stimulating research and development, supporting innovation and enabling new industries to develop and grow.
Transport investments generate economic benefits and increase productivity through urbanization and localization economies. Urbanization economies (Jacobs 1969) refer to benefits arising from a business being situated in a large urban area with a robust population and employment base. This type of agglomeration allows firms to leverage broader markets and infrastructure advantages, thus achieving economies of scale that are independent of industry. Conversely, localization economies (Marshall 1920) focus on productivity gains within a specific industry, where firms in close proximity can cluster together to benefit from a specialized labor pool and more efficient supply chains. For example, as multiple manufacturing firms cluster within an area, their proximity allows them to co-create a specialized workforce and share industry knowledge, creating productivity gains unique to that industry.
In practice, improved transportation can generate agglomeration effects in two ways; first is “static clustering”, where improvements in connectivity facilitate greater movement between existing clusters of businesses and improved labor market access, without changing land use. For individuals and businesses in their existing locations, enhanced connectivity reduces the travel times and the costs of interactions, so people and businesses are effectively closer together and the affected areas have a higher effective density.
Second, “dynamic clustering” can occur when transport investments alter the location or actual density of economic activity. Dynamic clustering can lead to either increased or decreased density in certain areas, impacting the overall productivity levels across regions by altering labor and firm distributions. Conceptually, dynamic clustering’s benefits include the benefits from static clustering.
The analysis in this study is based on static clustering effects, focusing on productivity benefits arising from improved connectivity without modelling potential changes in land use or actual density. This approach estimates the direct economic gains of reduced travel times and enhanced accessibility within existing urban and industrial structures. Benefits arising from dynamic clustering are subject to greater uncertainty because it may involve displacement of economic activity between regions. In addition, variations in density across regions could be influenced by external factors – such as regional economic policies, housing availability, or industry-specific demands – that would require a much deeper and granular modelling exercise. Overall, focusing on static clustering provides a more conceptually conservative estimate of the benefits.
To estimate the agglomeration economies associated with the CR/HSR project, we utilize well-established transport appraisal methodology for agglomeration estimation (Metrolinx 2021). The analysis in this study applies one simplification to accommodate data availability, which is to undertake the analysis at an economy-wide level, rather than performing and aggregating a series of sector-specific analyses.
Overall, the three-step model estimates these agglomeration effects through changes in GDP. In the first step, the generalized journey cost (GJC) between each zone pair is calculated. This GJC serves as an average travel cost across various transportation modes (e.g., road, rail, air), taking account of journey times and ticket prices. The GJC is estimated for both the baseline (existing VIA Rail) and investment scenarios (CR/HSR), across multiple projection years. Due to the sensitivity of agglomeration calculations, in the baseline the GJC for CR/HSR, road and air are assumed to be equivalent, and in the investment scenario the GJC for road and rail are reduced by utilizing the rule of half principle (see Figure 5). The baseline utilizes Canada-wide vehicle kilometre data from Statistics Canada to estimate passenger modal shares (across existing VIA Rail, road, and air) for 2024, with the modal shares remaining constant over time in the baseline (Transport Canada 2021, Transport Canada 2018, Statistics Canada 2016). In the scenarios, the modal shares are adjusted for passengers moving from existing VIA Rail (and other transport modes) to CR/HSR, as well as induced passengers.
In the second step, the effective density of each of the four zones is calculated under all scenarios. Effective density increases in the investment scenarios because CR/HSR reduces the GJC and enhances connectivity between zones.
In the third step, changes in effective density between scenarios are converted into productivity gains measured as changes in GDP, utilizing a decay parameter of 1.8 and an agglomeration elasticity of 0.046 (Metrolinx 2021). The decay parameter (being greater than 1) diminishes the agglomeration benefits between regions that are further away from each other, such that the estimated productivity gains (arising from greater connectivity) are higher for areas that are closer together. The agglomeration elasticity is – based on academic literature – the assumed sensitivity of GDP to changes in agglomeration. Approximately, an elasticity of 0.046 assumes that a 1 percent increase in the calculated estimate for effective density (see step 2) would correspond to a 0.046 percent increase in GDP. Data on GDP and employment are sourced from Statistics Canada’s statistical tables, and forecast employment growth is assumed to align with Statistics Canada’s projected population growth rates.
Emissions
Environmental effects from transportation create a further source of economic impact. This study considers the main dimensions – greenhouse gas (GHG) emissions and air quality – each contributing to external welfare impacts that affect populations and ecosystems.
Transportation accounts for approximately 22 percent of Canada’s GHG emissions (Canada’s 2024 National Inventory Report), primarily through automobile, public transit, and freight operations. Emissions from GHGs, particularly carbon dioxide, significantly impact the global climate by contributing to phenomena such as rising sea levels, shifting precipitation patterns, and extreme weather events. The social cost of carbon (SCC) framework, published by Environment and Climate Change Canada, assigns a monetary value to these emissions, reflecting the global damage caused by an additional tonne of CO₂ released into the atmosphere. The federal government’s SCC values were published in 2023, more recently than the values recommended by Metrolinx’s 2021 guidance, and therefore the government’s values are used for the modelling in this study. For SCC, data from Environment and Climate Change Canada’s Greenhouse Gas Estimates Table are used, adjusted to 2024 values using CPI. Within the modelling, SCC values increase from $303.6 (in 2024) to $685.5 (in 2098). Using SCC in cost-benefit analyses enables more informed decisions on transportation investments by calculating the welfare costs and benefits associated with emissions under both investment and business-as-usual scenarios.
A wider set of pollutants emitted by vehicles – including CO, NOx, SO₂, VOCs, PM10s, and PM2.5s – pose further health risks, causing respiratory issues, heart disease, and even cancer. These harmful compounds, classified as Criteria Air Contaminants (CACs), impact individuals living or working in the vicinity of transport infrastructure, leading to external societal costs that are not fully perceived by direct users of the transport network. Health Canada’s Air Quality Benefits Assessment Tool (AQBAT) quantifies the health impacts of CACs, evaluating the total economic burden of poor air quality through a combination of local pollution data and Concentration Response Functions (CRFs), linking pollutants to adverse health effects. Furthermore, AQBAT considers air pollution’s effects on agriculture and visibility, allowing analysts to estimate the overall benefits of reducing transport-related emissions for communities across Canada.
This study identifies that CR/HSR has the potential to reduce emissions across multiple fronts. First, as an electrified rail system, CR/HSR is capable of operating with zero emissions, providing a cleaner alternative to existing rail services. If VIA Rail discontinues some services on overlapping routes with CR/HSR, emissions from rail transport in those areas would decrease, as per its planning forecasts. Additionally, CR/HSR’s higher speeds and greater reliability are expected to attract more passengers over time, encouraging a modal shift from more carbon-intensive forms of transportation, such as cars and airplanes. This anticipated shift would lead to a reduction in overall emissions from private vehicle and regional air travel, contributing to CR’s/HSR’s positive environmental impact.
By incorporating SCC and AQBAT metrics, the analysis offers a holistic appraisal of the environmental and social benefits of reducing emissions and improving air quality through CR/HSR, capturing the external welfare consequences beyond direct user impacts. Unit costs of CACs (see Table 3 below) are sourced from Metrolinx (2021) and are also adjusted by CPI into 2024 prices.
Results and Analysis
This section sets out the potential benefits of CR/HSR across various scenarios and sub-scenarios, spanning the 60-year period project implementation (2039 to 2098, inclusive). Results are reported in 2024 present value terms, cumulated over the 60-year period, as per cost-benefit analysis (CBA) literature (e.g., Metrolinx 2021). This cumulative present value represents the total value of benefits to 2098, with benefits in future years discounted to 2024 values. Figure 6 below illustrates the total cumulative present value of benefits for the proposed CR/HSR project, under different scenarios and passenger growth sub-scenarios in our model.
Since the HSR upsideis the most optimistic sub-scenario, with a higher speed and the highest projected growth rate for rail passengers, it yields the largest total economic benefit, estimated at approximately $27 billion. Conversely, the CR downsideassumes a comparatively lower speed and a smaller growth rate for rail passengers, resulting in the lowest benefit among all sub-scenarios, estimated at around $11 billion. This range of outcomes highlights that economic benefits are sensitive to assumptions around speed and passenger growth, underscoring the importance of these factors in the overall project evaluation.
Figure 7 illustrates the breakdown of benefits from the proposed CR/HSR project across different sub-scenarios and categories of benefits (see Table 4 in the Appendix for numerical values). User benefits form the largest component, indicating that rail passengers are expected to gain approximately $3.1–$9.2 billion in value over the modelling period, in present-day terms. Road decongestion effects, agglomeration impacts and emissions reductions are also forecast to deliver economic benefits. This study’s modelling estimates that CR/HSR could generate agglomeration effects that boost GDP by around $2.6–$3.9 billion over the 60-year analysis period, through enhancing productivity in the Ontario-Québec corridor. CR/HSR could significantly reduce greenhouse gas emissions and improve air quality, valued at approximately $2.6–$7.1 billion when considering the social cost of carbon and other pollutants. Benefits from reduced congestion on roads are estimated at $2.0–$5.9 billion. Finally, improved road safety offers an additional $0.3–$0.8 billion (approximately) in present value. Together, these impacts illustrate the wide-ranging economic, environmental, and social benefits anticipated from the CR/HSR project.
Given the potential sensitivity of economic benefits to assumptions around passenger growth, the 2011 federal government feasibility study provides a useful point of comparison for rail passenger growth under CR/HSR. The current outlook for rail passenger forecasts is not the same as it was in 2011, but some of the changes will have offsetting impacts. On one hand, Canada’s population has both grown faster (between 2011 and 2024) and is expected to grow faster in the future, relative to expectations in 2011. On the other hand, remote working has increased significantly since the COVID-19 pandemic. Passenger forecasts are discussed in more detail below.
Modelled agglomeration benefits are at the upper end of expectations. For example, the value of agglomeration effects for the HSR central scenario in this study ($3.4 billion) is almost 50 percent of the value of rail user benefits ($7.2 billion). Within academic literature, economic benefits from agglomeration are typically estimated to be in the region of 20 percent of direct user benefits on average (Graham 2018). However, across a range of studies, agglomeration benefits up to 56 percent have been identified (Oxera 2018). Therefore, the modelled estimates appear high relative to prior expectations, but within a plausible range.
To note, our agglomeration modelling (based on the Metrolinx methodology) forecasts significant economic benefits for all four of the zones. Our modelled agglomeration estimates for each zone are a function of the distance between zones (higher distance reduces agglomeration benefits due to the decay parameter), forecast uptake of CR/HSR services, and GDP. For example, Toronto’s agglomeration effect (as a percentage of GDP) is forecast to be one-third less than that of Montreal, due to be Toronto being slightly further away (from Ottawa, Montreal and Quebec City) than those cities are to each other. The agglomeration modelling is complex and sensitive to input assumptions, therefore it is important to recognize a degree of uncertainty around the precise value of agglomeration-related economic benefits.
Sensitivity Analysis
Ticket prices for CR/HSR impact the total benefits. For example, under the HSR central scenario, if HSR ticket prices were set 20 percent above existing Via Rail ticket prices, the forecast present value of user benefits falls by around 40 percent. The present value of economic benefits would fall by $4.2 billion compared to the HSR central case (from $20.7 billion to $16.5 billion), the majority being due to lower user benefits. However, recognizing cost of living concerns for Canadian households, it is also possible that median ticket prices could fall – such as through dynamic pricing – in which case economic benefits could also rise, by a similar amount.
The source of CR/HSR passengers will impact the estimated quantum of benefits, although relatively moderately. If proportions for “switchers” and “induced” passengers are sourced from VIA-HFR’s estimates, the level of economic benefits is $3.0 billion lower (falling from $20.7 billion to $17.7 billion). VIA-HFR’s forecasts assume a higher proportion of induced passengers, and also assume a greater share of switchers from air transport. As a result, the main impact of the VIA-HFR assumptions is to produce a smaller road decongestion effect, which reduces the potential benefits for road users.
The agglomeration calculation is relatively sensitive to the baseline assumption for passenger modal share. The modelling in this study is based on Canada-wide vehicle kilometre data, utilizing information from Transport Canada and Statistics Canada. Further analysis could be undertaken to refine this assumption across Ontario and Québec, while also ensuring that forecast agglomeration benefits align with wider estimates in existing transport literature.
Discussion and Qualifications
The analysis presented in this study is based on currently available information and projections, which are subject to certain limitations. Notably, there are uncertainties surrounding several key factors, including the precise routes and station locations, the design specifications (e.g., maximum achievable speed), ticket pricing, expected passenger numbers, the breakdown across ”switchers” and “induced” passengers, and passenger modal shares more generally. These elements, if altered, could impact the economic outcomes considerably.
There are several important qualifications to the scope of this study. First, it provides an analysis of potential economic benefits from CR/HSR investment but does not seek to quantify or analyze the direct costs involved in procurement, financing, construction, operations, maintenance or renewals. As such, this study constitutes an analysis of economic benefits, rather than a full cost-benefit analysis exercise. Second, this study seeks to estimate national, aggregate-level impacts, rather than undertaking a full distributional analysis of the impacts across and between different population groups. Third, this study’s primary focus is an economic assessment, rather than a transportation modelling exercise. The economic analysis utilizes and relies upon detailed, bottom-up passenger forecasts developed by VIA-HFR (received directly), cross-checked against the 2011 federal government’s previous HSR study. All three of these scope issues are important inputs to a holistic transport investment appraisal and should be considered in detail as part of investment decision-making.
Specifically, regarding this final issue – passenger forecasts – it is relevant to consider the transport modelling assumptions in further detail. As noted above, this study has not developed a full transport model, nor does it seek to take a definitive view on VIA-HFR’s forecasts. We would recommend that independent technical forecasts are developed. However, there are several relevant observations.
On one hand, VIA-HFR’s estimates do not appear implausible. For example, HSR has achieved a 7-8 percent share of passenger travel within certain routes in the United States (New York-to-Boston and New York-to-Washington), which would appear to be broadly consistent with the level of ambition within VIA-HFR’s passenger growth forecasts for the HSR central scenario (LEK 2019). The Madrid-Barcelona high speed link is estimated to serve 14 million passengers per year (International Railway Journal 2024). Internationally, HSR has achieved high market shares in Europe and Asia, such as 36 percent modal share for Madrid-Barcelona and 37 percent for London-Manchester, albeit noting that Europe typically has lower road usage and a higher propensity to use public transport (LEK 2019).
On the other hand, it is important to recognize the historic tendency for optimism bias within transportation investment projects. For example, in the UK, the HS2 project was criticized as having “overstated the forecast demand for passengers using HS2 [and] overstated the financial benefits that arise from that demand” (Written evidence to the Economic Affairs Committee, UK 2014). A review of HS2 in 2020 revised downwards previous estimates of economic benefits (Lord Berkeley Review 2020). As noted further above, analysis by the European Court of Arbiters (2018) posits that not all HSR projects induce sufficient passenger volumes to achieve net benefits over the project lifetime.
Overall, future passenger forecasts will depend upon a range of factors, including ticket prices, the availability and price of substitute modes (i.e., air), cultural preferences for private vehicle ownership, the impact of changing emission standards and the feasibility of construction plans.
This study applies some pragmatic, simplifying assumptions and approximations, applied to best practice transport appraisal (Metrolinx 2021; Department for Transport, UK, 2024). Across these modelling assumptions, there is variation in the directional impact on our estimates for economic benefits.
On one hand, some of the modelled benefits are likely to be relatively high-end estimates. First, for rail-user benefits, the modelling assumes no differential in ticket prices between existing VIA Rail services and CR/HSR. It also assumes that CR/HSR can deliver VIA-HFR’s proposed journey times with 95 percent reliability, which is achievable but not guaranteed. Second, for road congestion benefits, the forecast (direct) reductions in road congestion assume no indirect “bounce-back” effect where reduced traffic encourages new or longer trips (as noted above). For example, analysis of US highway demand suggests that capacity expansion only results in temporary congestion relief, for up to five years, before congestion returns to pre-existing levels (Hymel 2019). Third, for agglomeration, the modelled estimates for economic benefits are approximately 50 percent of rail-user benefits, which is close to the upper end of estimates from other transportation studies. Fourth, for emissions, the estimated benefits from forecast emissions savings do not seek to make assumptions about future changes to fuel efficiency for road and air transport, the emissions associated with power generation for CR/HSR, or the anticipated growth in electric vehicle adoption. In the case of electric vehicle deployment, there is uncertainty regarding the level of uptake, as well as the carbon intensity of electricity generation (albeit Ontario and Québec have relatively “clean” grids by international standards). Fifth, for benefits overall, this study leverages the VIA-HFR forecasts for passenger growth which are likely to be ambitious, though they have been robustly developed.
On the other hand, by focusing on the most material economic benefits, this study may exclude some smaller additional benefits that could be considered in further detail. First, there may be specific impacts on the tourism and hospitality sector. By enhancing travel convenience, CR/HSR is likely to draw more visitors to the various cultural, entertainment, and natural attractions across the corridor. As this influx would benefit local businesses by stimulating economic growth and job creation, these impacts are likely to be reflected within the estimate of agglomeration benefits.
Second, CR/HSR would improve national and global competitiveness, enhancing the appeal of Canadian cities to investors and environmentally conscious travellers while helping Canada align more closely with global standards for sustainable, modern infrastructure. Again, the economic benefits are likely to align with the agglomeration estimates.
Third, this study does not seek to quantify the potential gains to individual productivity from CR/HSR ridership, e.g., from individuals having time to work on the train. There is not expected to be a benefit for existing rail users, as they can already utilize Wi-Fi on existing VIA Rail services. For individuals switching to rail from road or air, potential benefits would only accrue to business users. Although switchers from road and air could have opportunities for improved individual productivity, Wi-Fi is increasingly available on airlines and individuals are able to dial into meetings remotely whilst driving.
Fourth, CR/HSR could generate wider economic benefits by increasing competition between businesses along the corridor. International transport appraisal literature suggests that enhanced transport connectivity can erode price markups (and therefore increase consumer surplus) by overcoming market imperfections (Metrolinx 2021; Department for Transport 2024). However, such impacts are likely to be relatively small, e.g., the Department for Transport (UK) estimates them at 10 percent of the benefits for rail business users only. Furthermore, sources of market power in Canada are legal in nature (e.g., interprovincial trade barriers) which rail investment alone is unlikely to overcome.
There are a further group of issues that have been excluded consciously from the methodology in this study. First, impacts on rail crowding are not considered. Some transport appraisals (such as the UK’s economic appraisal of the High Speed 2 project) do estimate the user benefits from reduced crowding. However, this is not as applicable for CR/HSR: In the UK, users of existing rail services may be required to stand if the train is overbooked, whereas users of existing VIA Rail services are guaranteed a seat with their booking. Second, impacts on land and property values are not included within the economic benefits. With greater access to efficient transportation, properties near rail stations typically see increased demand and value, boosting local tax revenues and promoting urban revitalization. While CR/HSR could increase values in areas close to the proposed stations, such changes are not additional to other wider economic benefits, but rather reflect a capitalization of those benefits. To avoid the risk of double counting the economic benefits already estimated, these are excluded (Department for Transport 2024).
CR/HSR may improve social equity and accessibility by offering affordable, reliable travel options for those without cars, including low-income individuals, students, and seniors. This expanded access enables broader employment, education, and healthcare opportunities, contributing to a more inclusive society. Whilst this study does not include a distribution analysis, social benefits from greater inclusion and social equity would constitute a benefit of CR/HSR investment and merit further detailed analysis.
Finally, in addition to policy considerations, major investment decisions have a substantial political dimension. For example, Canada is the only G7 country without HSR infrastructure. While cognizant of the political context, the analysis in this study is purely an economic assessment and does not consider political factors.
Conclusion
Canada’s population and economy continue to expand, particularly within the Toronto-Québec corridor. Existing transportation routes can expect greater congestion over time, particularly capacity-constrained VIA Rail services. In this context, can Canada afford not to progress with faster, more frequent rail services? There are significant opportunity costs to postponing investment.
This study has developed quantified estimates of the economic benefits of investing in the proposed Rapid Train project in the Toronto-Québec City corridor. Cumulatively, in present value terms, these economic benefits are estimated to be $11-$17 billion under our modelled conventional rail (CR) scenarios, and larger – at $15-$27 billion – under high-speed rail (HSR) scenarios. Economic benefits arise from several areas, including rail user time savings and improved reliability, reduced congestion on the road network, productivity gains through enhanced connectivity, and environmental benefits through emission reductions. With many commentators highlighting that Canada is experiencing a “productivity crisis” and a “climate emergency,” the projected productivity gains and lower-emission transportation capacity from the Rapid Train project present particularly valuable opportunities.
This study has assessed major economic benefit categories as identified within mainstream transport appraisal guidance. Further research could include additional sensitivity analysis around key parameters, as well as consideration of potential dynamic clustering effects, and projections for housing and land values.
Clearly, there is a cost to investment in a new dedicated passenger rail service: upfront capital investment, ongoing operations and maintenance expenditure, and any financing costs. These costs are not assessed in this study and will need to be considered carefully by policymakers. However, inaction – by continuing with the status quo rail infrastructure – also has a significant opportunity cost. Canada would forgo billions of dollars worth of economic advantage if it fails to deal with current challenges, including congestion on the rail and road networks, stifled productivity, and environmental concerns.
This study identifies the multi-billion-dollar economic benefits from the proposed Rapid Train project. While these benefits will need to be weighed alongside the forecast project costs, this study provides a basis for subsequent project evaluation and highlights the significant opportunity costs that Canada is incurring in the absence of investment.
Appendix
For the Silo, Tasnim Fariha, David Jones. The authors thank Daniel Schwanen, Ben Dachis, Glen Hodgson and anonymous reviewers for comments on an earlier draft. The authors retain responsibility for any errors and the views expressed.
References
Ahlfeldt, G., Feddersen, A., 2017. “From periphery to core: measuring agglomeration effects using high-speed rail.” Journal of Economic Geography.
Albalate, D., and Bel, G. 2012. “High‐Speed Rail: Lessons for Policy Makers from Experiences Abroad.” Public Administration Review 72(3): 336-349.
Amtrak. 2023. Amtrak fact sheet: Acela service.
Atkins, AECOM and Frontier Economics. 2014. First Interim Evaluation of the Impacts of High Speed 1, Final Report, Volume 1. Prepared for the Department of Transport, UK.
Blanquart, C., and Koning, M. 2017. “The local economic impacts of high-speed railways: theories and facts.” European Transport Research Review 9(2): 12-25.
Bonnafous, A. 1987. “The Regional Impact of the TGV.” Transportation 14(2): 127-137.
California High-Speed Rail Authority. 2022. “2022 Business Plan.” Sacramento: State of California.
Central Japan Railway Company. 2020. “Annual Environmental Report 2020.” Tokyo: JR Central.
Crescenzi, R., Di Cataldo, M., and Rodríguez‐Pose, A. 2021. “High‐speed rail and regional development.” Journal of Regional Science 61(2): 365-395.
Dachis, B., 2013. Cars, Congestion and Costs: A New Approach to Evaluating Government Infrastructure Investment. Commentary. Toronto: C.D. Howe Institute. July.
Dachis, B., 2015. Tackling Traffic: The Economic Cost of Congestion in Metro Vancouver. Commentary. Toronto: C.D. Howe Institute. March.
Department of Transport (Ireland). 2023. “Transport Appraisal Framework, Appraisal Guidelines for Capital Investments in Transport, Module 8 – Detailed Guidance on Appraisal Parameters.”
Department for Transport (UK). 2024. “National Road Traffic Survey, TRA0308: tra0308-traffic-distribution-by-time-of-day-and-selected-vehicle-type.ods (live.com).”
International Railway Journal. 2024. “Spanish high-speed traffic up 37 percent in 2023.”
International Transport Forum-OECD. 2013. “High Speed Rail Performance in France: From Appraisal Methodologies to Ex-post Evaluation.”
International Union of Railways (UIC). 2022. “High-Speed Rail: World Implementation Report.” Paris: UIC Publications.
International Union of Railways (UIC). 2019. “Carbon Footprint of Railway Infrastructure.” Paris: UIC Publications.
Jacobs, J. 1969. The Economy of Cities. New York: Random House.
Kojima, Y., Matsunaga, T., and Yamaguchi, S. 2015. “Impact of High-Speed Rail on Regional Economic Productivity: Evidence from Japan.” Research Institute of Economy, Trade and Industry (RIETI) Discussion Paper Series 15-E-089.
Lawrence, M., Bullock, R. G., and Liu, Z. 2019. “China’s High-Speed Rail Development.” World Bank Publications.
LEK. 2019. New Routes to Profitability in High-Speed Rail.
Lord Berkeley Review. 2020. A Review of High Speed 2, Dissenting Report by Lord Tony Berkeley, House of Lords: Lord-Berkeley-HS2-Review-FINAL.pdf.
Marshall, A. 1920. Principles of Economics. London: Macmillan.
Metrolinx. 2018, GO Expansion Full Business Case.
________. 2021. Business Case Manual Volume 2: Guidance.
________. 2021, Traffic Impact Analysis Durham-Scarborough Bus Rapid Transit.
Morgan, M., Wadud, Z., Cairns, S. 2025, “Can rail reduce British aviation emissions?” Transportation Research Part D 138.
National High Speed Rail Corporation Limited (NHSRCL). 2023. “Mumbai-Ahmedabad High Speed Rail Project Status Report.”
Office National des Chemins de Fer (ONCF). 2022. “Al Boraq High-Speed Rail Service: Five Year Performance Review.”
OAS. 2019. “High Speed Rail vs Air: Eurostar at 25, The Story So Far.”
Oxera. 2018. “Deep impact: assessing wider economic impacts in transport appraisal.”
Reiter, V., Voltes-Dorta, A., Suau-Sanchez, P. 2022, “The substitution of short-haul flights with rail services in German air travel markets: A quantitative analysis.” Case Studies on Transport Policy.
Rete Ferroviaria Italiana (RFI). 2023. “Alta Velocità Network Expansion: Naples-Bari Route Completion Report.”
Rossa et al. 2024. “The valuation of delays in passenger rail using journey satisfaction data.” Elsevier, Part D (129).
Rungskunroch, P. 2022. “Benchmarking Operation Readiness of the High-Speed Rail (HSR) Network.”
Statistics Canada. 2023. Table 36-10-0468-01 Gross domestic product (GDP) at basic prices, by census metropolitan area (CMA) (x 1,000,000).
______________. 2024. Table 14-10-0420-01 Employment by occupation, economic regions, annual.
______________. 2024. Table 17-10-0057-01 Projected population, by projection scenario, age and gender, as of July 1 (x 1,000).
_____________. 2016. Table 8-1: Domestic Passenger Travel by Mode, Canada.
______________. 2014, Canadian vehicle survey: Canadian vehicle survey, passenger-kilometres, by type of vehicle, type of day and time of day, quarterly (statcan.gc.ca).
Transport Canada. 2021. Transportation in Canada 2020, Overview Report, Green Transportation.
_______________. 2018. RA16-Passenger and Passenger-Kms for VIA Rail Canada and Other Carriers.
Ministry of Transportation of Ontario & Transport Canada. 2011. “Updated feasibility study of a high-speed rail service in the Québec City – Windsor Corridor: Deliverable No. 13 – Final report.”
Vickerman, R. 2018. “Can high-speed rail have a transformative effect on the economy?” Transport Policy 62: 31-37.
Wang, X., and Chen, X. 2019. “High-speed rail networks, economic integration and regional specialisation in China.” Journal of Transport Geography 74: 223-235.
Installation view of Torkwase Dyson, Errantry, 2024, at Art Basel Unlimited. Image courtesy Gary Yeh / ArtDrunk.
Chicago Gallery
GRAY is pleased to present Torkwase Dyson: Of Line and Memory, the artist’s first solo exhibition in GRAY’s Chicago gallery. Installed over three distinct spaces, the exhibition debuts a monumental sculpture in steel and painted wood, an immersive installation of new paintings, and new cast glass and wood constructions. Of Line and Memory opens at GRAY Chicago with a public reception for the artist on November 8 and remains on view through January 25, 2025.
Dyson works across the disciplines of painting, drawing, installation, and sculpture, distilling the spatial and affective residues of diasporic histories to envision new modes of environmental liberation. Through an improvisational process of mindful abstraction, which she calls “Black Compositional Thought,” Dyson seeks to create work that is fluid, abstract, poetic, and open to possibility. “If there is systemic oppression, there must be systemic liberation,” says the artist, “and I am in that zone… trying to condition myself in this relationship of a transhistorical liberation practice.”1
Of Line and Memory draws from years of research and Dyson’s own spatial memory of navigating the waterways and urban architecture of Chicago. Using the South Shore Cultural Center, a lakeshore landmark with rich historical and architectural significance, as a point of departure, Dyson extracts, reduces, and refines architectural and visual cues into geometric shapes and painterly abstractions. According to the artist, “Of Line and Memory asks, as we move through dramatic and ever-changing geographies, what memories are stored in these new and improvisational choreographies?”
Down-down, 2018 Exhibited inTorkwase Dyson, 2021-22 Hall Art Foundation Schloss Derneberg Museum, Holle, Germany
An immersive, dynamic interplay of materials emerges throughout the exhibition. The Clearing, a cantilevered steel, wood, and graphite sculpture in two parts, balances monumental, curved shapes upon the weight of rectangular steel bases. Dyson’s new paintings unlock a sense of “state change” between thinly poured layers of deep blues and reds, opaque blacks, and the shapes and lines of geometric abstraction. Likewise, her Hypershape constructions in glass and graphite-coated wood balance the solidity of wood and graphite with the translucence of cast glass.
Of Line and Memory underscores Torkwase Dyson’s deep commitment to transforming complex histories of diasporic and urban landscapes into powerful abstractions. The artist states: “the topography echoes familiar and enigmatic ecologies in my consciousness without the promise of stability. Embracing this indeterminacy, I think through how the transhistorical ethos of infrastructure space, both visible and invisible, resonates in liberation and world-building.”
ABOUT TORKWASE DYSON
American interdisciplinary artist Torkwase Dyson (b. 1973 Chicago) combines expressive mark-making and geometric abstraction to explore the continuity between ecology, infrastructure, and architecture. Working across the disciplines of painting, sculpture and architecture, Dyson deconstructs, distills, and interrogates the built environment, exploring how individuals, particularly black and brown people, negotiate, negate, and transform systems and spatial order. Throughout her work and research, Dyson confronts issues of environmental liberation and envisions a path toward a more equitable future.
One of today’s most innovative artists, Dyson’s work has been the focus of solo exhibitions at ‘T’ Space Rhinebeck, New York; Mildred Lane Kemper Art Museum, St. Louis, Missouri; New Orleans Museum of Art, Louisiana; Colby College Museum of Art, Maine; Graham Foundation for Advanced Studies in the Fine Arts, Chicago, Illinois; Schuylkill Center for Environmental Education, Philadelphia, Pennsylvania; Suzanne Lemberg Usdan Gallery, Bennington, Vermont; Hall Art Foundation, Derneburg, Germany; and Serpentine Galleries, London, UK.
Group exhibitions and biennials include the Liverpool Biennial, Liverpool, UK; Bienal de São Paulo, Brazil; Desert X, California; California African American Museum, Los Angeles; The Museum of Modern Art, New York; Studio Museum in Harlem, New York; Whitney Museum of American Art, New York; The Drawing Center, New York; Corcoran School of the Arts and Design, Washington DC; Smithsonian National Museum of African Art, Washington, DC; and Wexner Center for the Arts, Columbus, Ohio, among others. Her architectural sculpture Liquid Shadows, Solid Dreams (A Monastic Playground), commissioned for the 2024 Whitney Biennial, is on view at the Whitney Museum of American Art’s fifth floor terrace through February 9, 2025. Torkwase Dyson will create the conceptual design for The Costume Institute’s Spring 2025 exhibition, Superfine: Tailoring Black Style, at The Metropolitan Museum of Art.
Public collections include the Art Institute of Chicago, Illinois; Hall Art Foundation, Reading, Vermont; Hirshhorn Museum and Sculpture Garden, Washington, DC; The Long Museum, Shanghai, China; Mead Art Museum, Amherst College, Massachusetts; Mildred Lane Kemper Art Museum, St. Louis, Missouri; Smith College Museum of Art, Northampton, Massachusetts; Smithsonian National Museum of African American History & Culture, Washington, DC; Studio Museum in Harlem, New York; and Williams College Museum of Art, Massachusetts. Dyson studied sociology and social work at Tougaloo College, Mississippi, and received a Bachelor of Fine Arts in Painting from Virginia Commonwealth University and a Master of Fine Arts in Painting from Yale School of Art. Dyson lives and works in Beacon, New York.
PUBLICATION The exhibition will be accompanied by a fully illustrated catalogue, to be published in 2025.
ABOUT GRAY
GRAY is a globally recognized team of art professionals devoted to fostering the development of historically important artists’ careers and to building outstanding art collections. Founded in 1963, GRAY has established its reputation as a resource for Modern, Postwar, and Contemporary art with prominent private and institutional clients worldwide. Known for producing critically acclaimed exhibitions and programming from its galleries in Chicago and New York, GRAY represents a roster of internationally recognized artists such as McArthur Binion, Torkwase Dyson, Theaster Gates, David Hockney, Rashid Johnson, Alex Katz, Ellen Lanyon, Jaume Plensa, Leon Polk Smith, and Evelyn Statsinger.
1 Torkwase Dyson, lecture, SAIC Visiting Artists Program, School of the Art Institute of Chicago, March 7, 2023.
Featured image- Tuning (Hypershape, 311-520), 2018, exhibited in Torkwase Dyson 2022 Hall Art Foundation, Schloss Derneberg Museum, Holle, Germany
June,2024 – Lengthy delays and regulatory uncertainty is deterring investment in major infrastructure projects in Canada, according to a new report from the C.D. Howe Institute. In “Smoothing the Path: How Canada Can Make Faster Major-Project Decisions”, authors Charles DeLand and Brad Gilmour find that Canada’s regulatory approval process is creating high costs for investors and preventing critical projects in hydrocarbon production, mining, electricity generation, electricity transmission, ports and other infrastructure from being built.
Sectors that have historically driven business investment and productivity in Canada—mining, oil and gas—are most affected by complex regulatory procedures.
While investments in these sectors have supported high incomes for workers and high revenues for government in the past, they are now trending downwards. “Canada is struggling to complete large infrastructure projects in a reasonable time frame and at a reasonable price and the proposed amendments to the Impact Assessment Act (IAA) are insufficient,” says Gilmour.
Canadians have been debating whether Canada’s regulatory and permitting processes strike the right balance between attracting investments in major resource projects and mitigating potential harm from those investments.
These regulatory processes typically apply to complex and expensive projects, such as mines, large hydrocarbon production projects (oil sands, liquefied natural gas [LNG], offshore oil), electricity generation (hydroelectric dams, nuclear), electricity transmission (wires), ports and oil or natural gas pipelines. These projects often involve multiple levels of jurisdiction and can prove particularly slow to gain government approval.
Canada struggles to complete large infrastructure projects, let alone cheaply and quickly. We propose improving major project approval processes by: (a) ensuring that provincial and federal governments respect jurisdictional boundaries; (b) leaving the decision-making to the expert, politically independent tribunals that are best positioned to assess the overall public interest of an activity; (c) drafting legislation with precision that focuses review on matters that are relevant to the particular project being assessed; and (d) confirming the need to rely on the regulatory review process and the approvals granted for the construction and operation of the project.
There you have it… from Dr. Peter Vincent Pry himself, director of the EMP Task Force on National and Homeland Security… An electromagnetic pulse (EMP for short) would literally send an entire country back in the 1800’s in a matter of seconds, by frying everyone’s electronics and leaving us in the dark.
Here’s Ben Carson explaining EMPs…
Mainstream media has been silent about this for the last decade. And now folks are finally starting to see the truth…I believe an electromagnetic pulse is imminent and I want to show you how to make this cheap set-up that can shield any device against an EMP.
Let me give you a few shocking stats and facts that have scared the daylights out of some top US politicians.
Wired Magazine said there was a 12% chance the Sun would blast a Coronal Mass Ejection (or CME) at 300 miles per second towards Earth by 20201.
Now as far as we know 😉 that didn’t happen. But it seems mathematically certain to happen in the very near future.
A Space Weather study quoted by Gizmodo2 estimates it would cost the US $41.5bn / day, and it would take months if not years for the power grid to be replaced and for things to get back to some sort of normal.
Given that it produces an average of 3 CMEs EVERY SINGLE DAY3, the Sun is nothing but a ticking time bomb waiting to “explode”, destroy the grid and any device that’s plugged in, and ultimately paralyze society…
Then you’ve got nations such as Russia, China, North Korea and Iran, playing with high-altitude HEMP bombs, which can be even MORE devastating, because they can even fry electronics that are not connected to the grid, such as phones and flashlights.
In fact, Russia sold such devices to North Korea in 2014 4 5 and here’s why:
If you’re still skeptical about N. Korea’s abilities, keep in mind that they now have two satellites orbiting the Earth at low altitude, the KMS-3 launched in 2012 and the KMS-4 launched in 2016.6
…and guess what? They both hover over the United States7!
And let’s not forget ISIS, who’ve been planning grid attacks for a long time, are extremely self-motivated.
So what happens if any of these scenarios come true? Total collapse.
The large power transformers (that are keeping the power grid alive) will be completely fried, turning entire countries into a veritable electronics graveyard. Trucks will come to a screeching halt, and will stop delivering food, water, and medicine to stores across the nation.
People will be hungry and scared, turning against their fellow men in desperate attempts to feed their families. Looting will be the new national sport, and disease the new biggest killer… That’s when the real “fun” starts…
Law enforcement will be paralyzed and unable to communicate to keep things under control. And what will you eat when all of this happens?
EMP rehearsals
I like to call blackouts “EMP rehearsals”… because they too can leave entire cities in the dark for days or even weeks on end, and scare millions of people…Like this woman, for instance… who got trapped in an elevator during a blackout. If that were an EMP, she’d most likely experience a deadly free fall:
The aging US power grid is hit every FOUR DAYS on average by either a cyber or a physical ATTACK9… 225,000 Ukrainian households were left in the dark in 2015, after the power grid was hacked10.
The number of power outages doubles every 5 years11, mostly because of our increased energy needs, but also due to storms, earthquakes, tornadoes and even heat waves. And what will happen when millions of electric cars owners will plug their vehicles into the grid every night, all at once, and let them charge over night for 8 or 9 hours?
Look no further than 3rd world countries such as India to see what that would look like. In 2002, 700 MILLION souls were left in the dark… It was horrible… According to The Guardian13, “electric crematoriums stopped operating, some with bodies left half burnt before wood was brought in to stoke the furnaces”…
In 2014, the entire country of Yemen was left without power for an entire week after al-Qaeda attacked it14. It wasn’t the first time, either…
Still, it’s hard to imagine what happens when an electromagnetic tsunami completely fries the aging power grid, phones, laptops, medical equipment such as pacemakers, fridges (keeping anything from food to insulin cold), and even some cars. The cost of replacing everything is unimaginable. Plus, even if your car does survive, remember gas pumps also run on electricity…
So what can you do to protect your electronics? All you need is this one weird box you can make at home called a “Faraday cage”, with simple materials lying around in your kitchen or garage right now that, if done right, will guarantee that all the electronics inside will survive.
“If done right” is key here, because there’s a lot of confusion on making them… Many folks are convinced that things like cars and microwaves will work, but they’re completely wrong.
I cringe every time I hear this, because I know that if the shield is not fully enclosed, the electromagnetic pulse will go right through and fry everything inside… Many Faraday cages have holes in them14 and are useless in front of a powerful EMP. What you need is a fully-enclosed shield.
There’s a simple 30 second test you can do right now, to see for yourself. Place your phone and a portable radio inside a microwave, trashcan, or anything else you think would work as a shield. Turn both devices on, and make sure your radio is tuned in to an AM station.
Now try calling your phone. Is it ringing? What about your radio, are you getting anything? If the answer to any of these questions is “yes”, then that is not a Faraday shield and it will fail you.
Why does the test work? Because EMP pulses hit on a very wide frequency range that those used by cell phones and radios.
Now, to make a real Faraday cage, there are two simple rules you need to follow…
Rule #1: the gadgets inside should not touch the outer metal casing…
And rule #2, the metal container must not have any holes or cracks in it, no matter how small.
A box full of working gadgets won’t cover your basic survival needs, so it’s critical that you get over your addiction to electricity. Just like a drug, you’re dependent on it because it makes everything so much easier… And when it’s gone, when you can’t use your phone or laptop, you feel totally helpless.
You gotta learn to live without it, because most people won’t…
Modern life made everyone soft, people can’t even change a tire these days. They can’t fix their house, cook on an open fire or grow their own food, heck, most can’t even change a tire…
The other thing we need to talk about is generating your own electricity post-EMP with parts kept safe inside these Faraday cages. You’ll then be able to run electric tools and appliances such as chainsaws, pressure cookers and washing machines. This is actually something you can do today to slash your electric bill…
To recap, the 3 layers of EMP preparedness are:
Layer #1: Faraday shields
Layer #2: living without electricity
and Layer #3: free energy…
Don’t worry, though, because we’ve already done all the hard work for you. Me and my amazing prepper writers at Survival Sullivan have once again outdone ourselves and came up with hands-down the best course for surviving blackouts and EMPs anyone ever made:
*This product is digital. The image is for information purposes.
We call it: “EMP Protocol”
…and I’m excited to give you a taste of what’s inside:
● Step-by-step videos and pictures on how to make these 3 Faraday boxes types that will protect your devices against even the strongest EMP. You don’t have to pay $30,000 for a copper chamber, or even $30 for Faraday cages advertised on various websites. We’ll show you how to make them for less than $5usd each… You get the exact materials for every type of box, plus step-by-step instructions. Plus, one of these types of cages is small and light enough to fit in your bug out bag…
● What to do the moment an EMP happens. Whether you live in the city or on a farm, whether you’re bugging in or out, we’ll tell you how to move fast, stay safe and protect yourself and your family.
● The 3 best ways to safely generate electricity post-collapse. Just keep the spare parts in Faraday shields, and you’ll have light for years to come.
● 12 electronics you need to salvage in Faraday cages. Yes, flashlights and emergency radios are on the list, but if you truly want to be prepared for a long-term disaster, you definitely need the others.
● How to hide the fact that you have electricity… If someone sees light in your window, or if your kid is playing outside with a flashlight, they’ll instantly know you have it. These stealth tactics are what you need to make sure no neighbor or even the law enforcement will take your devices.
● How to prepare your vehicle for an EMP. Plus, a list of cars models that are sure to survive it.
● How to make bug out bags, get home bags and everyday carry kits for you and your family, that work not just in EMPs, but in any kind of emergency. We’re going deep down the rabbit hole, covering every possible aspect, making sure all the items inside are protected against shocks, water, puncturing by sharp objects, and even theft.
● How to bug out on foot. If your car won’t work, you’ll have no choice but to leave it behind. The roads could be dangerous, but fear not because we’ll tell you how to get to your bug out location safely and in record time.
● Last but not least, we’re going to have a conversation about how to survive without electricity in the long hard years following an EMP event. Nothing is left out, including food and water procurement, hygiene and sanitation, alternative communication methods, and even things that are often overlooked such as home schooling
We really went out of our way to weed out the bad information about EMPs. Best of all, these things will help you survive and thrive in almost any other disaster or emergency, such as social unrest, hurricanes and an economic collapse. Click here to receive your EMP Survival guide. For the Silo, Dan F. Sullivan.
Cyclones in the Caribbean and Pacific, devastating bushfires in Australia, recurrent floods and droughts in Asia and Africa, increasingly bring tragic loss of life to our nations and communities, inflicting physical and mental trauma on survivors, and causing irreparable damage to centuries old ways of life and undermining prospects for future prosperity and growth.
The current bushfires in Australia have been among the most distressing manifestations, leading the government to declare a state of emergency.
The total cost to the economy of the bushfires with which Australia is grappling seems likely to run into billions of dollars. Continuous drying of undergrowth creates optimal conditions for bushfires, leading to tragic loss of human lives and destruction of infrastructure. There is devastating impact on the precious biodiversity of flora and fauna, threatening drastically to affect the ecology of the region. Heightened levels of air pollution in the affected and adjoining regions are having adverse impacts on the respiratory health of scores of people.
Such extreme events are occurring with rising frequency, destroying the means of livelihood for millions people in Commonwealth countries, increasing vulnerability and reducing resilience. The Commonwealth collectively recognises that without well-planned and integrated national and international action, natural disasters and extreme events will continue to challenge the resilience of affected communities and smaller countries. The Commonwealth Secretariat is working alongside member nations to protect the environmental health of fragile and susceptible ecosystems, including through increased national preparedness for tackling natural disasters and mobilising resources.
For the arid and drought-prone member countries, which are highly vulnerable to dryness and bushfires, the Commonwealth provides support for governments to develop projects on sustainable and resilient landscape management, with the Commonwealth Climate Finance Access Hub (CCFAH) helping to unlock necessary financial resources. Similarly, by pooling information into a streamlined platform for better and more convenient access to information, the Commonwealth Disaster Risk Finance Portal currently in development will help countries find suitable sources of finance and support to deal with disasters.
On behalf of citizens of all Commonwealth countries, I express my heartfelt condolences to all families and communities who have lost loved ones in the tragic events of recent days. I commend the courage and commitment of firefighters, emergency service personnel and all others who are battling to rescue and protect people and property, wildlife and natural resources, or human infrastructure. In these testing times, the wider Commonwealth family stands in solidarity alongside the Government and people of Australia. For the Silo, by Patricia Scotland, Commonwealth Secretary-General
Featured photo- Luca Parmitano ESA Astronaut – Australia “Ash cloud” as viewed from the ISS International Space Station.
Patrick Brown spoke to the Ontario Road Builders Association where he made a number of false statements about the province. Facts Still Matter in Ontario, especially when it comes to the historic amount of transportation infrastructure being built right now across the province.
He said:“I believe we’ve seen lip service to infrastructure over the last 10 years but we’re not seeing shovels in the ground”
Fact: Here are some pictures of shovels in the ground
He said:“You go to Gujarat, you think you’re on Canadian roads. They’ve really invested in Infrastructure. No wonder they’ve seen their economy grow. No wonder Gujarat was leading India in job growth.”
Fact: The next time he wants to make this point he’s welcome to use Ontario as an example. It’s no coincidence that our government is making the largest infrastructure investment in Ontario’s history and leading the G7 in economic growth.
He said:“We want to make sure that historic infrastructure 130 billion is actually spent on infrastructure not spent simply on, on promises, on press releases”
Fact: Cost of the new GO station in Richmond Hill: $22 million, cost of the press release announcing it was open: $0, cost of catching Patrick Brown making up facts: priceless
He said:“We have become the capital of red tape in North America”
Fact: The CFIB nominated has nominated the Ontario government for its golden scissors award for cutting red tape 3 years in a row. This year the government received two nominations.
He said: “Projects need to start within mandate… It’s an insincere commitment promising something for 2019 or 2031”
Fact: Meaningful projects take longer than 4 years to build. If Patrick Brown won’t build anything that takes longer than 4 years that means he wouldn’t build any new subways or LRT’s.
He said:“The biggest announcement was for Hydro One, government said we’d get money for infrastructure. Of the first $4 billion sold, 0 went into infrastructure, money has been diverted to general revenue”
Fact: All of this money went into the Trillium Trust to be spent on projects like like GO Regional Express Rail, Mississauga and Hamilton LRT’s and the recently announced natural gas expansion.
Ontario has updated its contract with Bruce Power and will proceed with the refurbishment of six nuclear units at the Tiverton-based nuclear generation station.
Nuclear refurbishment will boost economic activity across Ontario, create jobs, ensure savings for ratepayers and secure a clean supply of reliable electricity. The Bruce Power refurbishment project will make up to 23,000 jobs possible and generate about $6.3 billion in annual economic benefits in communities throughout the province. Ontario is home to a globally recognized CANDU nuclear supply chain with more than 180 companies employing thousands of highly skilled workers.
Note: At Bruce Power-station, each reactor has its own turbine set.
The government was further able to optimize the nuclear refurbishment schedule in order to maximize the value of existing nuclear units. The revised timeline will mean construction commences in 2020, rather than the previously estimated start date of 2016.
Accordingly, the updated agreement has achieved $1.7 billion in savings for electricity customers when compared to the forecast in the 2013 Long-Term Energy Plan (2013 LTEP). This means a reduction in forecast household electricity bills by about $66 each year over the next decade. The contract also protects the interests of electricity consumers by ensuring Bruce Power assumes full risk for any potential cost overruns or delays.
Key aspects of the updated agreement include:
Securing 6,300 MW of emissions-free, baseload generating capacity while deferring major project work to 2020, to maximize value of the units
Bruce Power would invest approximately $13 billion of its own funds and agrees to take full risk of cost overruns on refurbishments of the six nuclear units
Initial price for Bruce Power’s generation set at $65.73/MWh starting January 1, 2016. The average price over the life of the contract is estimated to be $77/MWh, or 7.7 cents per kilowatt hour (kWh).
Both prices are within the range assumed in the 2013 LTEP for refurbished nuclear energy and are lower than the average price of electricity generation in Ontario, which in 2015 was $83/MWh
Definitive contract off-ramps that allow the government to assess Bruce Power’s cost estimates for each reactor prior to its refurbishment and stop the refurbishment if the estimated cost exceeds a pre-defined amount
The province is achieving balance by contracting affordable, stable and reliable generation for residents and businesses while securing investments that will be a key source of local job creation and economic growth.
Securing clean, reliable baseload power for decades to come is part of the government’s plan to build Ontario up. The four-part plan is includes investing in people’s talents and skills, making the largest investment in public infrastructure in Ontario’s history, creating a dynamic, innovative environment where business thrives and building a secure retirement savings plan.
QUOTES
“This agreement makes 23,000 jobs possible and supports an estimated $6.3 billion in annual, local economic development. Our updated agreement with Bruce Power secures 6,300 MW of emission-free, low-cost electricity supply. These actions will save the electricity system $1.7 billion and provide important relief for electricity consumers.”
— Bob Chiarelli, Minister of Energy
““Today is a major milestone in the history of Bruce Power as we build on our existing agreement with the province and extensive experience to enter the next phase of our site development. This provides us the opportunity to secure our long-term role as a supplier of low-cost electricity by demonstrating we can successfully deliver this program incrementally.”
— Duncan Hawthorne, President and CEO, Bruce Power
QUICK FACTS
Following the release of the 2013 LTEP, the amended BPRIA was negotiated over two years by the Independent Electricity System Operator (IESO).
The Bruce nuclear site is the world’s largest operating nuclear facility. Since it was formed in 2001, Bruce Power and its industry partners have engineered and developed first-of-a-kind technologies that helped return four dormant nuclear units to service.
Nuclear energy plays a fundamental role in Ontario’s electricity system. It provides over half of Ontario’s annual generation, meeting most of Ontario’s baseload requirements.


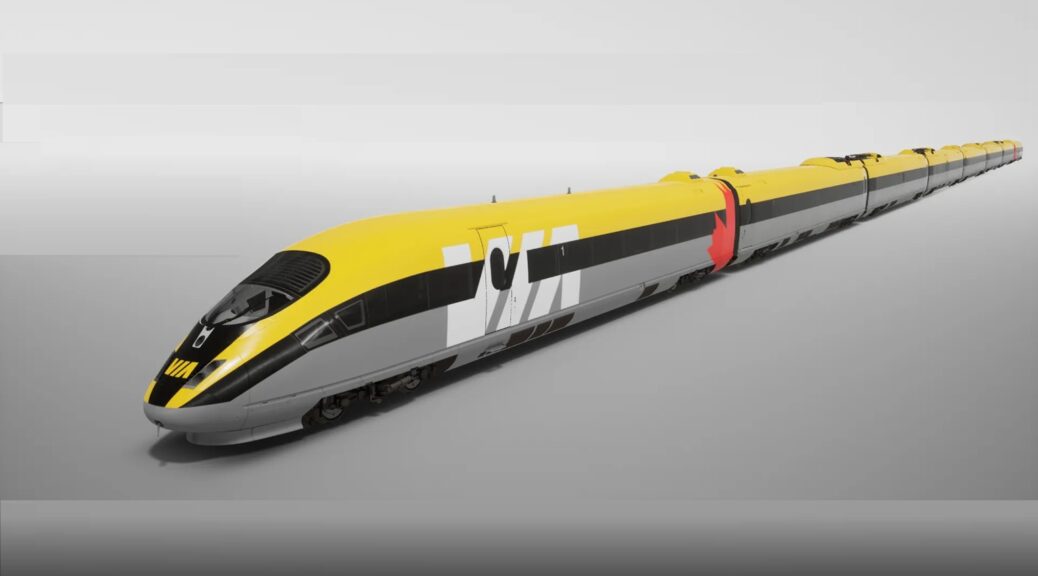
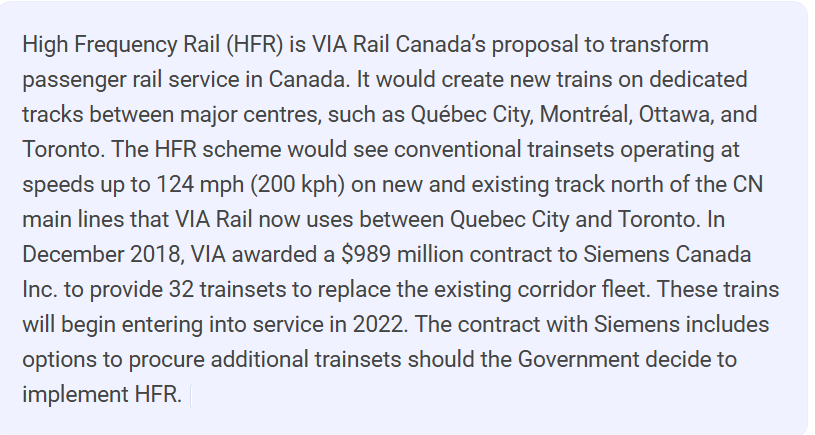
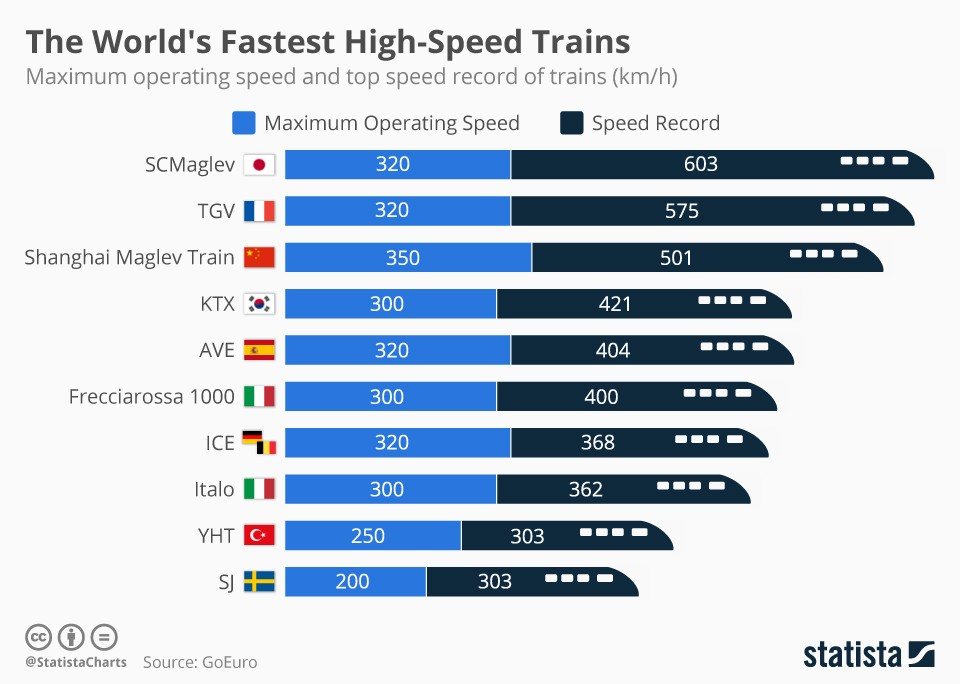


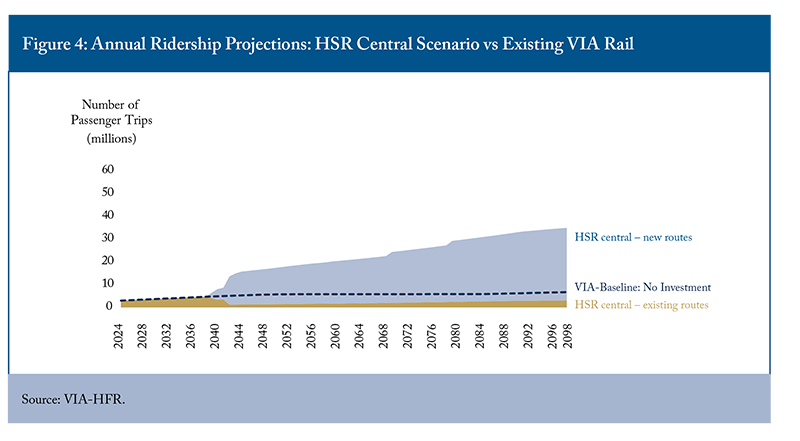


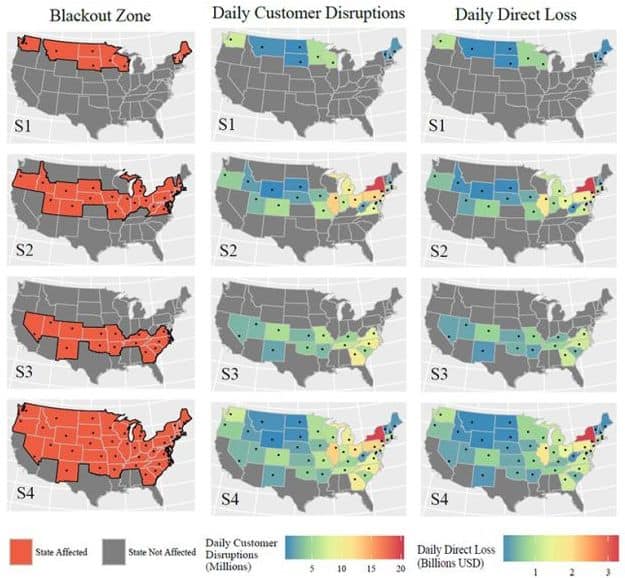


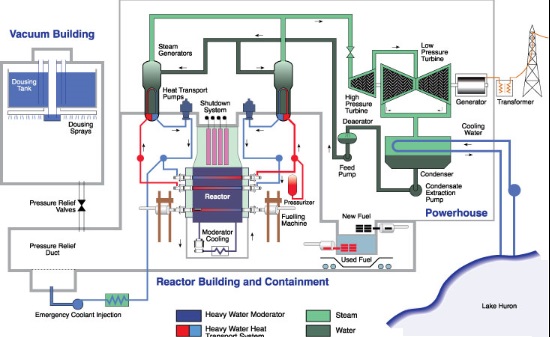
