Tag Archives: world ranking

Canada’s Largest Port Ranks 375 Out Of 400 In The World

Trade Diversification Ambitions Face a Container Port Reality 

Alberta recently submitted its West Coast pipeline proposal to Ottawa’s Major Projects Office, a major plank in the federal government’s goal to double exports to non-US markets by 2035. 

For that to succeed, more of Canada’s exports will need to move by water, already the largest mode for non-U.S. trade by value. And container shipping is part of that. 

So how do Canada’s container ports stack up?

 The short answer: Not well. Rectifying that would help Canada meet its trade-diversification goals. 

Roads were Canada’s dominant export mode over the 12 months ending in May, carrying 37 percent of export value. But those roads cross just one border. Strip out the United States and the picture flips entirely. Water carries 54 percent; air carries 41 percent. Road  falls to 3 percent. Put differently, the infrastructure we’ll need to reach the 2035 target looks almost nothing like today’s. 
What is the Container Port Performance Index?

The Container Port Performance Index (CPPI), produced by the World Bank, is a global scorecard for container shipping efficiency. Canada’s performance should raise alarm bells.   

The Index tracks total time a container ship spends under a port’s control, from the moment it arrives in the harbour to the moment it leaves the berth. Rather than grading ports on a traditional scale of zero to 100, the index uses a statistical baseline centred on the global average and adjusts for the size of a vessel and its cargo volume. A negative score means a port is operating below that benchmark. It simply means that for the same job, a ship sits idle longer than at an average gateway anywhere else. 

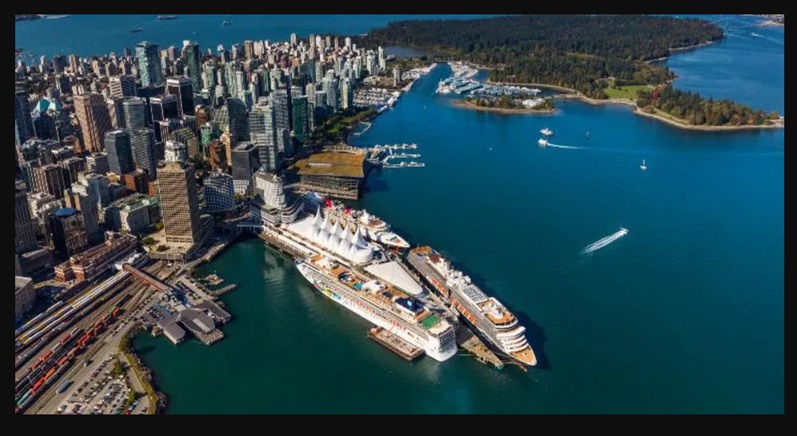
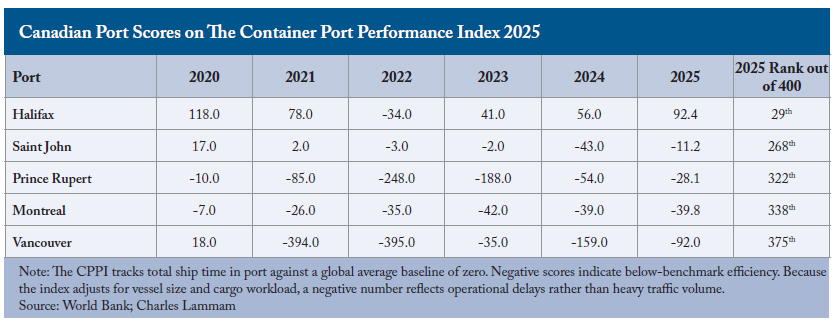
The Port of Vancouver, which handles fully 42 percent of Canada’s container shipments, ranks 375th out of 400 ports worldwide in the newly released 2025 ranking, with a score of minus 92. That’s actually an improvement on minus 159 in 2024: a dismal 389th. Vancouver was among the 20 most-improved ports in the world year over year. But even after climbing 67 points, a hole this deep still leaves you in the hole.  

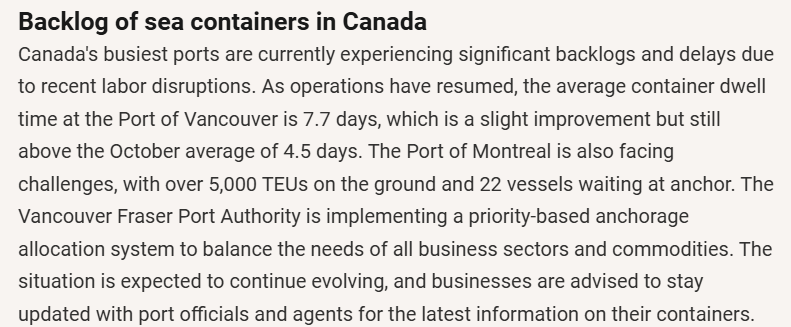
Vancouver’s CPPI score has been negative in five of the last six years, including a catastrophic collapse to minus 394 and 395 scores in 2021 and 2022, which also coincided with a historic BC flood that severed rail lines into the port for more than a week, layered on top of a pandemic-era demand surge hitting ports worldwide. Even so, strip those two years out and Vancouver’s score still never turns positive again. 
Vancouver is part of a broader Canadian pattern. Prince Rupert ranks 322nd, despite handling a meaningful share of Canada’s transpacific container trade, and its year-to-year swings are significant: from minus 10 in 2020 to minus 248 in 2022 to minus 54 in 2024. Montreal sits at 338th. Saint John is slightly better at 268th. 

The one major exception is Halifax, which has become a genuine success story: 29th in the world in the latest data, up from a middling performance just a few years ago, and 55th last year. Three of Canada’s busiest ports still rank in the bottom fifth of the world. Halifax proved it doesn’t have to be that way. 

The World Bank isn’t the only one flagging this.

A recent Bank of Canada analysis of satellite vessel-tracking data found that Canada’s rank for total ship capacity moving through its ports fell from sixth in the world in 2016 to 23rd by 2023, a steeper drop than almost any other major trading nation. Part of the reason: the newest ultra-large container ships carry more than 20,000 containers while the largest vessels Canadian ports can handle top out around 15,000. As a result, some cargo bound for Canada comes through a US port. 

Infrastructure isn’t the whole story. Labour issues also lengthen the time ships spend in Canadian ports, and addressing them matters just as much as modernizing the infrastructure itself. 

After Nutrien decided to build its new billion-dollar potash export terminal in the United States rather than in Canada, Transport Minister Steven MacKinnon, made an unusually blunt admission for a sitting minister about his own file: Canada’s transportation policy and supply chain management need to be the best in the world given the country’s geography, and right now they aren’t.  

Nutrien’s decision came even after the 2025 federal budget had already been tabled. That budget dedicated $5 billion, or 4 percent, of its $115-billion  infrastructure plan to bolster Canada’s trade and transport infrastructure. Whether allocating more to such infrastructure would generate a bigger bang for the buck is a fair question. 

Carney’s Ambitions

The PM’s ambitions depend on a clear-eyed read of where Canada’s port performance actually stands. The pattern holds across almost every major Canadian port, year after year, even as Ottawa doubles down on trade diversification. Halifax shows that the climb from a lower tier is possible. Until the rest of Canada’s ports make it too, the 2035 target will likely stay out of reach. 
For the Silo, Charles Lammam -senior adviser at the C.D. Howe Institute. 
How Canada Ranks In World For Thrill Seekers

With over 40% of travellers looking for heart-pounding thrills in 2024, the global adventure tourism market is predicted to grow to a staggering 2,824 billion usd dollars/ 3,840 billion cad dollars at time of publishing by 2030, as more seek adrenaline-fuelled experiences.

So if you are a relentless adventure junkie, which countries should be on your radar this year?

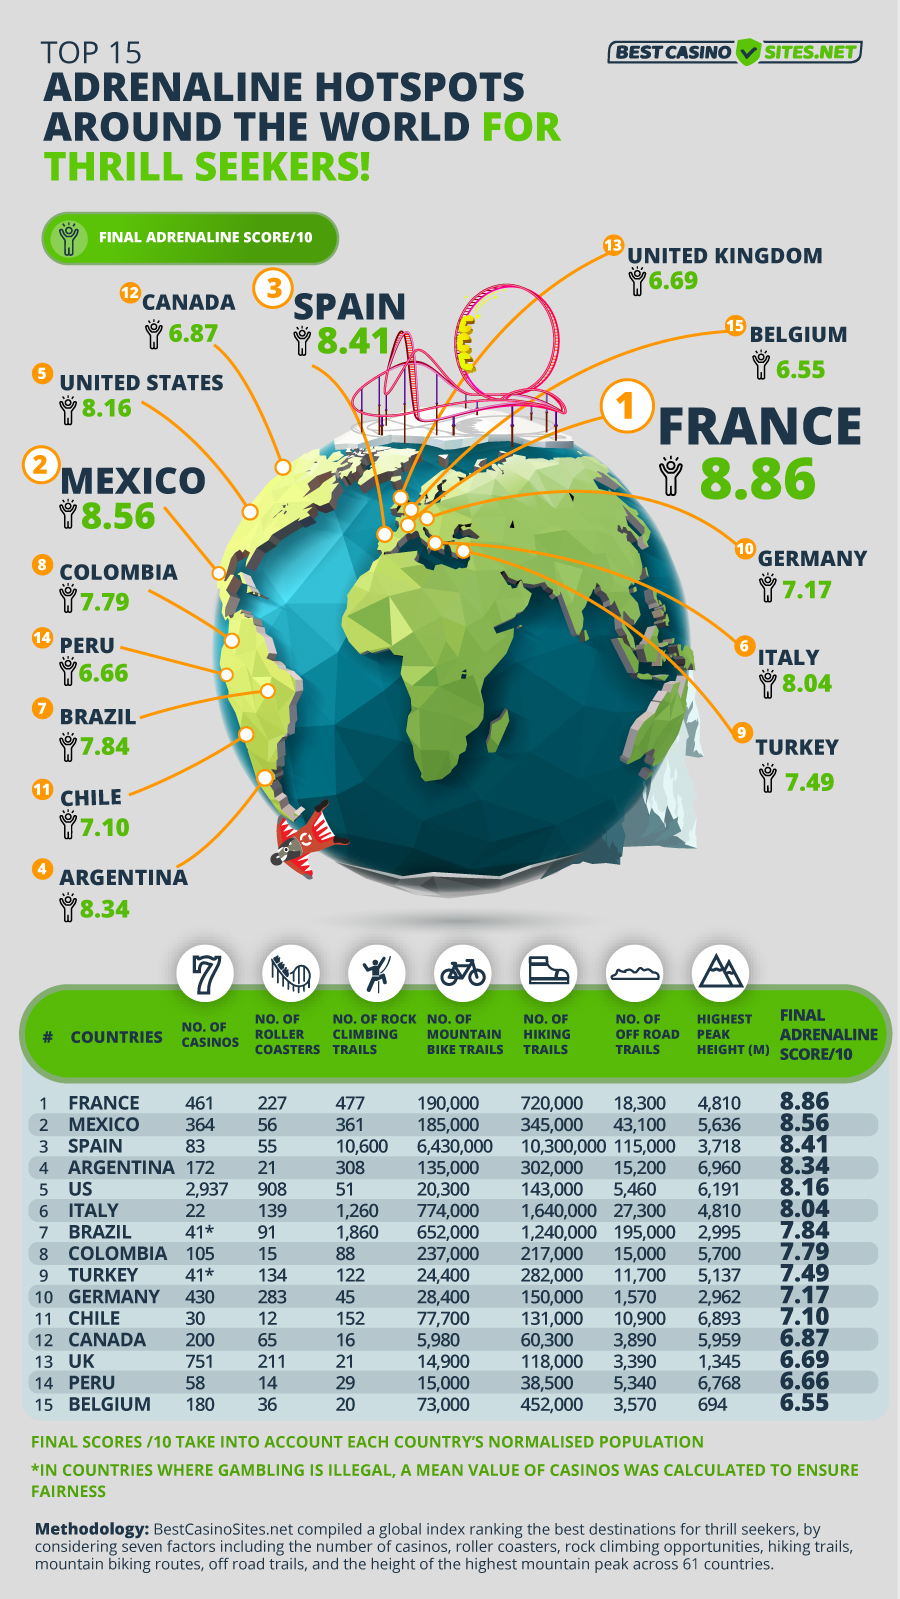
Our friends at BestCasinoSites.net evaluated factors including the number of roller coasters, casinos, rock climbing opportunities, mountain bike routes, hiking trails, and off-road trails in 61 countries, to compile a global index ranking the best countries to visit for thrill-seekers.

Canada among top 15 countries for adventure lovers

From biking the Gulf Islands to ziplining over Niagara Falls, Canada ranks 12th best country to get that adrenaline fix, earning a notable final score of 6.87/10. With 60,300 hiking trails and 5,980 mountain biking routes, Canada boasts a geographically diverse landscape and is home to North America’s second-highest peak, Mount Logan, topping out at 5,959 meters.

Mount Logan is a whopping 6KM in elevation and ranks sixth in the world for most prominent peak.

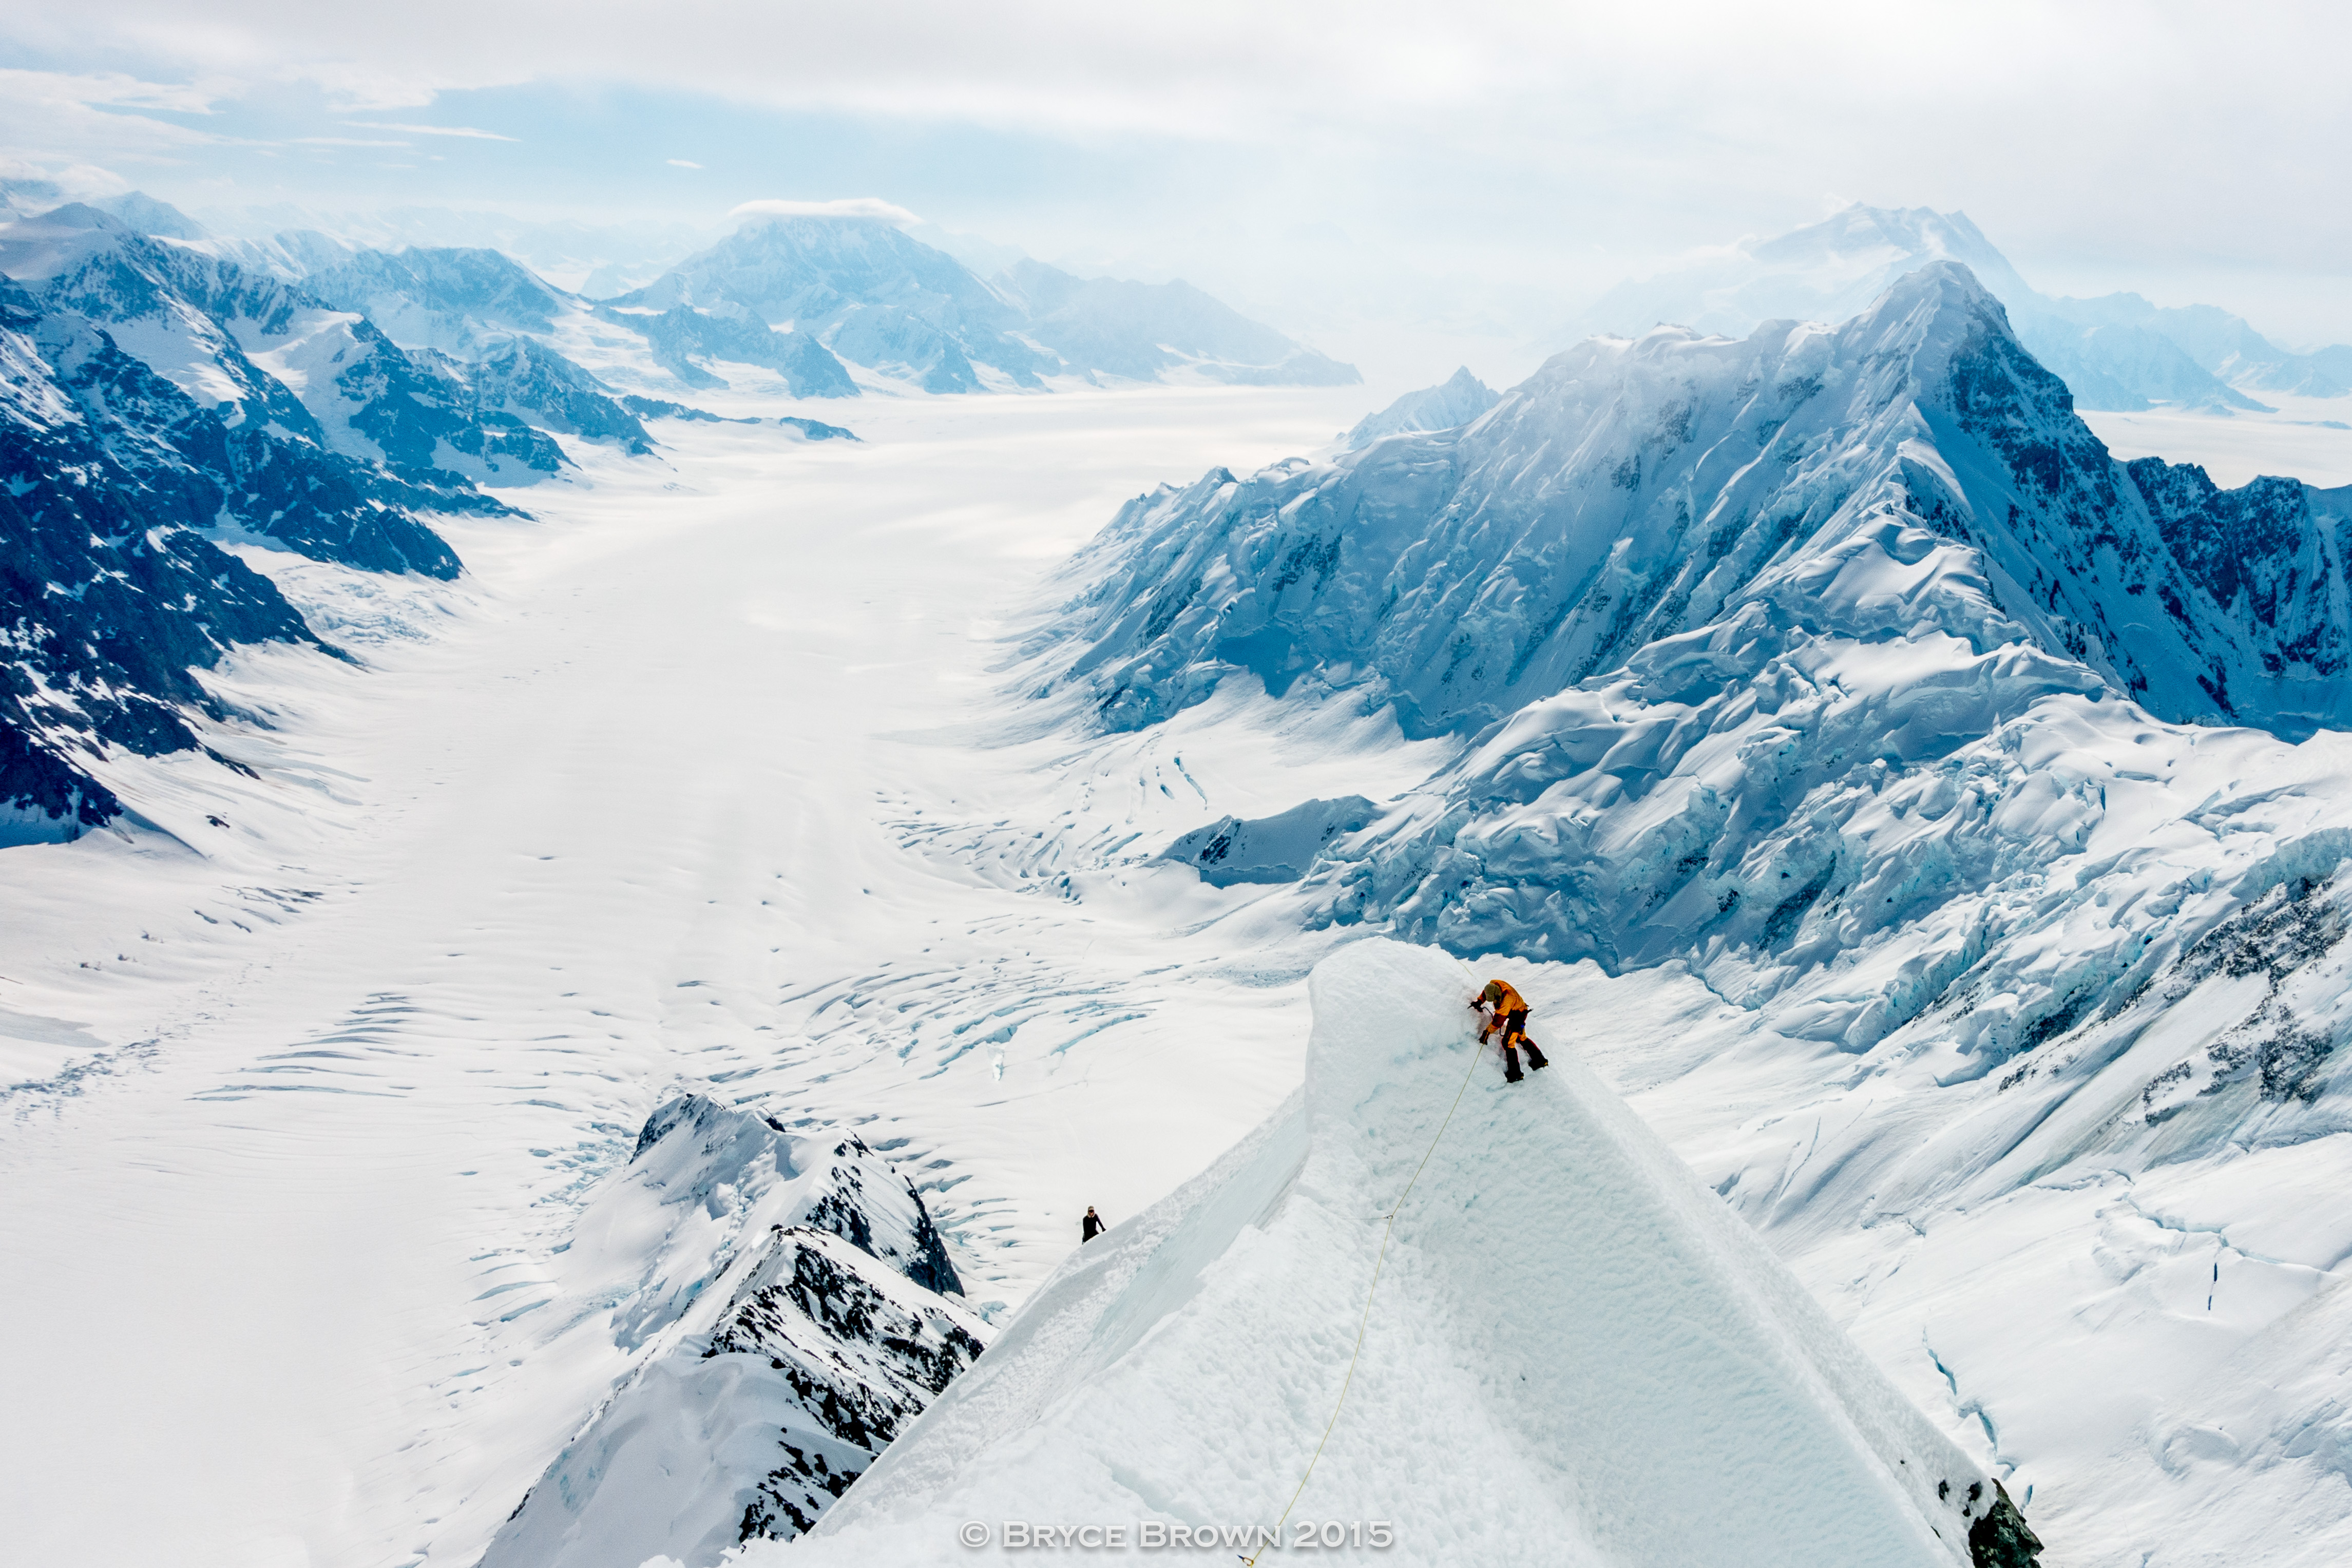
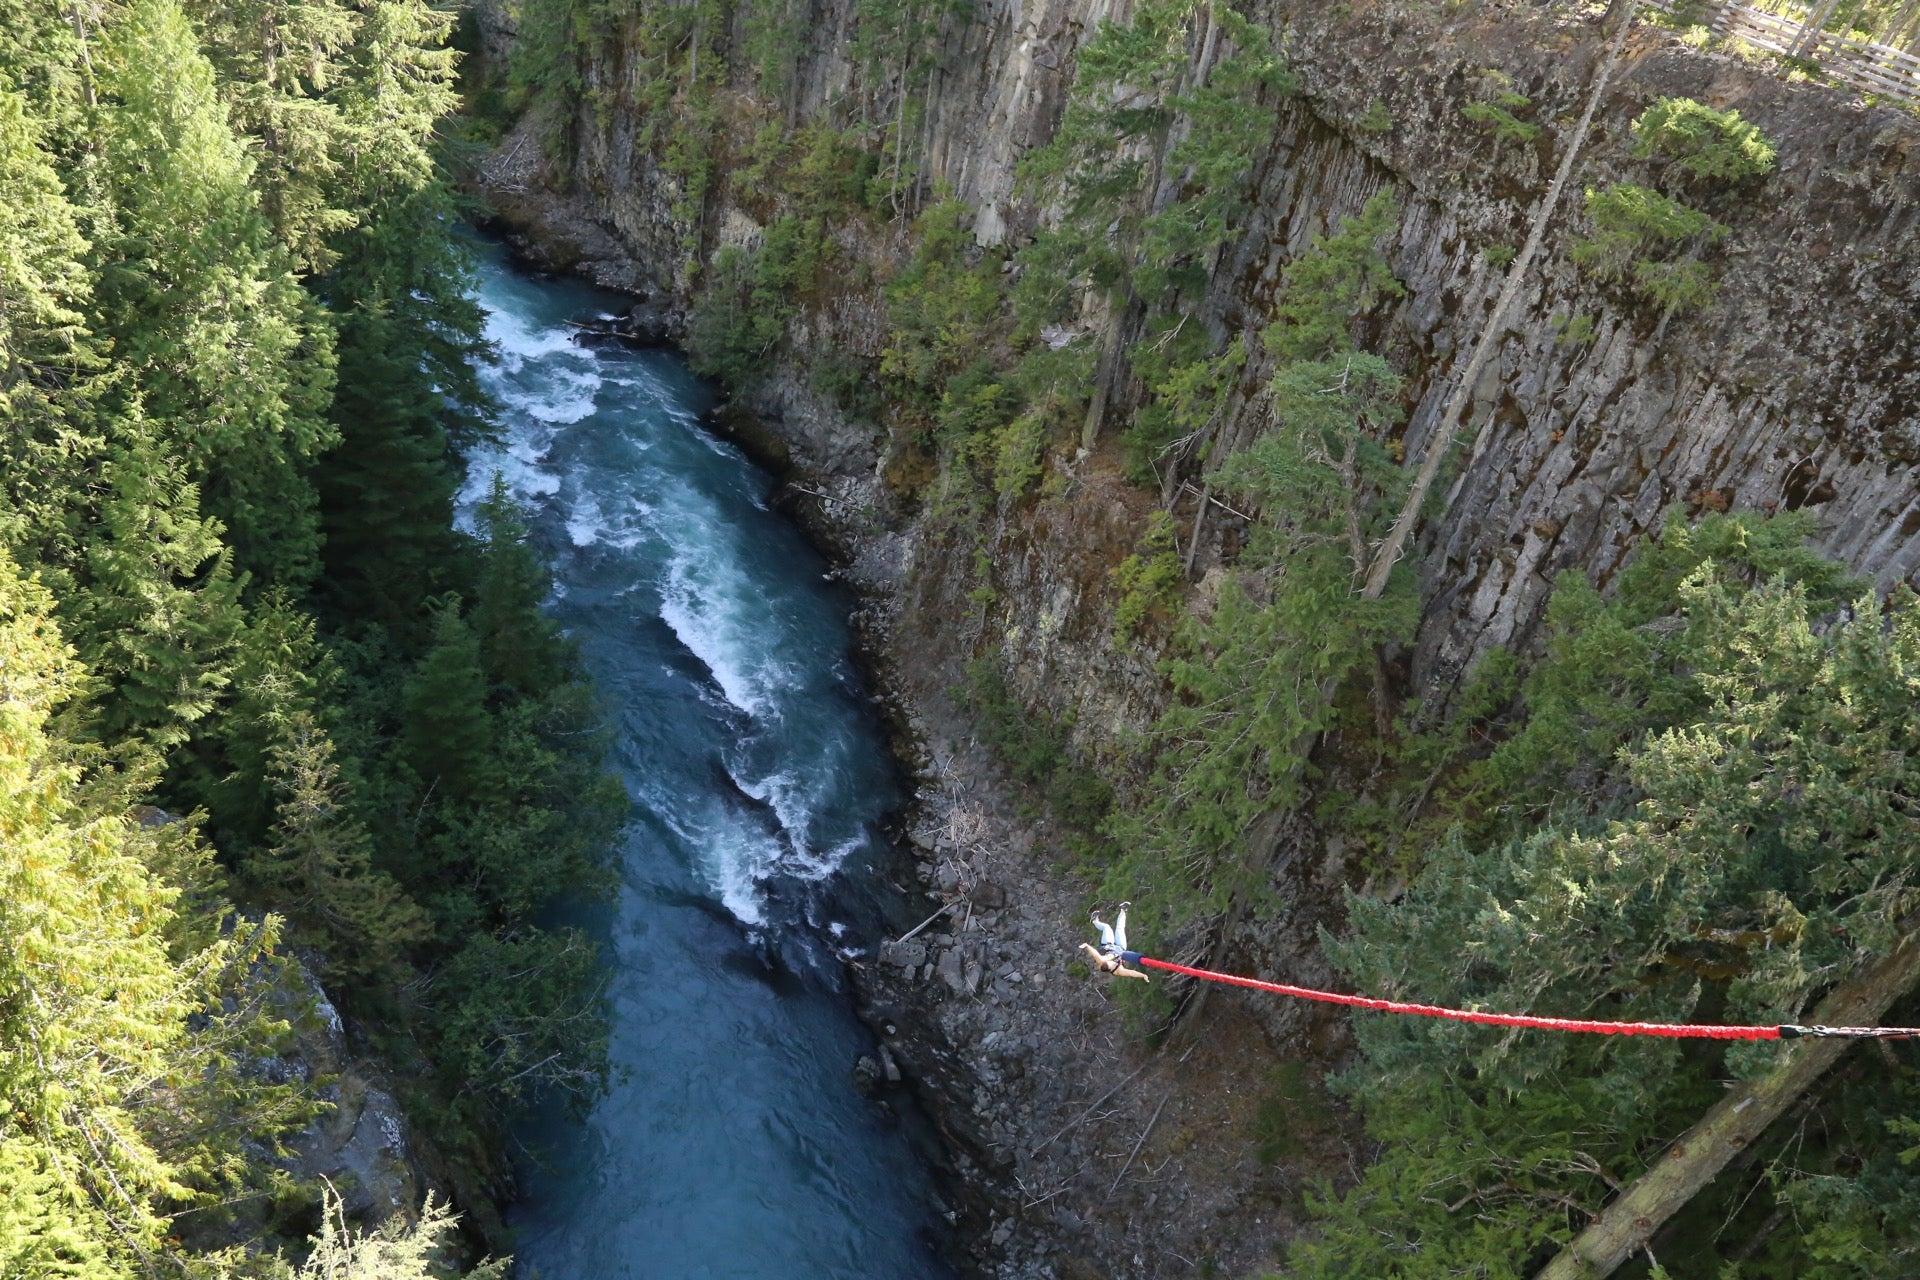
Adrenaline checklist in Canada: Experience Niagara Falls on a zipline, Rock or ice climb in the Rocky Mountains, Jump over the Cheakamus River with Whistler Bungee.

Whistler Bungee: offering a 160 foot jump over the glacially fed River below.

France reigns as the adventure capital of the world

According to the study, France is the world’s adventure capital, boasting an overall adrenaline score of 8.86/10. Prized for its stunning mountain ranges from the Pyrenees, Alps to Chamonix, the country offers over 720,000 hiking trails. Test your limits by conquering Europe’s highest peak, the Mont Blanc ranges, towering at 4,810 metres, or by jumping on one of France’s 227 thrilling roller coaster rides!

Adrenaline checklist in France: Cliff Jumping from the Calanques, Rock climbing overhanging limestone in Provence, Cycling on a glacier.

Trailing behind in second is Mexico, achieving a final score of 8.56/10. Your journey to this Latin American gem can be incredibly action-packed as you scale Mexico’s iconic snow-capped cone, Pico de Orizaba, with a peak of 5,636 metres above sea level; tackle one of the world’s biggest sport climbing areas at El Potrero Chico; or indulge in the thrill of games at any of the 364 casinos* Mexico boasts.

Adrenaline checklist in Mexico: Extreme urban downhill biking in Taxco; Bungee jumping at Los Cabos, Zip-lining in the Jungles of Yucatan.

The land of paella and sangria ranks as the third must-visit destination for adventurous souls, scoring 8.41/10Spain offers an enticing array of outdoorsy pursuits, boasting the highest number of thrill-seeking trails – from rock climbing (10,600)mountain biking (6,430,000), to hiking (10,300,000) – among all cities studied. Spain’s pristine landscape appears tailor-made for adventure enthusiasts.

Adrenaline checklist in Spain: Rock climbing In Picos De Europa; Canyoning at Junta de los Rios; Andalucía, Walking the El Caminito del Rey.

Argentina takes fourth place, earning an impressive final score of 8.34/10. Home to the third highest peak (6,960 metres) in the study, The Aconcagua attracts over 3,000 mountaineers annually, despite being nicknamed the ‘Mountain of Death’. With a whopping 172 casinos*, including South America’s largest casino complex, the Trilenium, Argentina offers ample opportunities for both seasoned risk-takers and casual players alike.

Adrenaline checklist in Argentina: Mountain biking in Bariloche; Ice trek on top of Perito Moreno Glacier, Paragliding with Condors in Córdoba.

From kayaking down the Grand Canyon to cliff camping in Colorado, the United States rounds off the top five adrenaline hotspots, earning an impressive final score of 8.16/10. With the highest density of casinos in the study totalling 2,937 across the country, and over 900 roller coasters – including the world’s second-fastest roller coaster, Kingda Ka – America is a must-visit if you crave the rush of adrenaline.

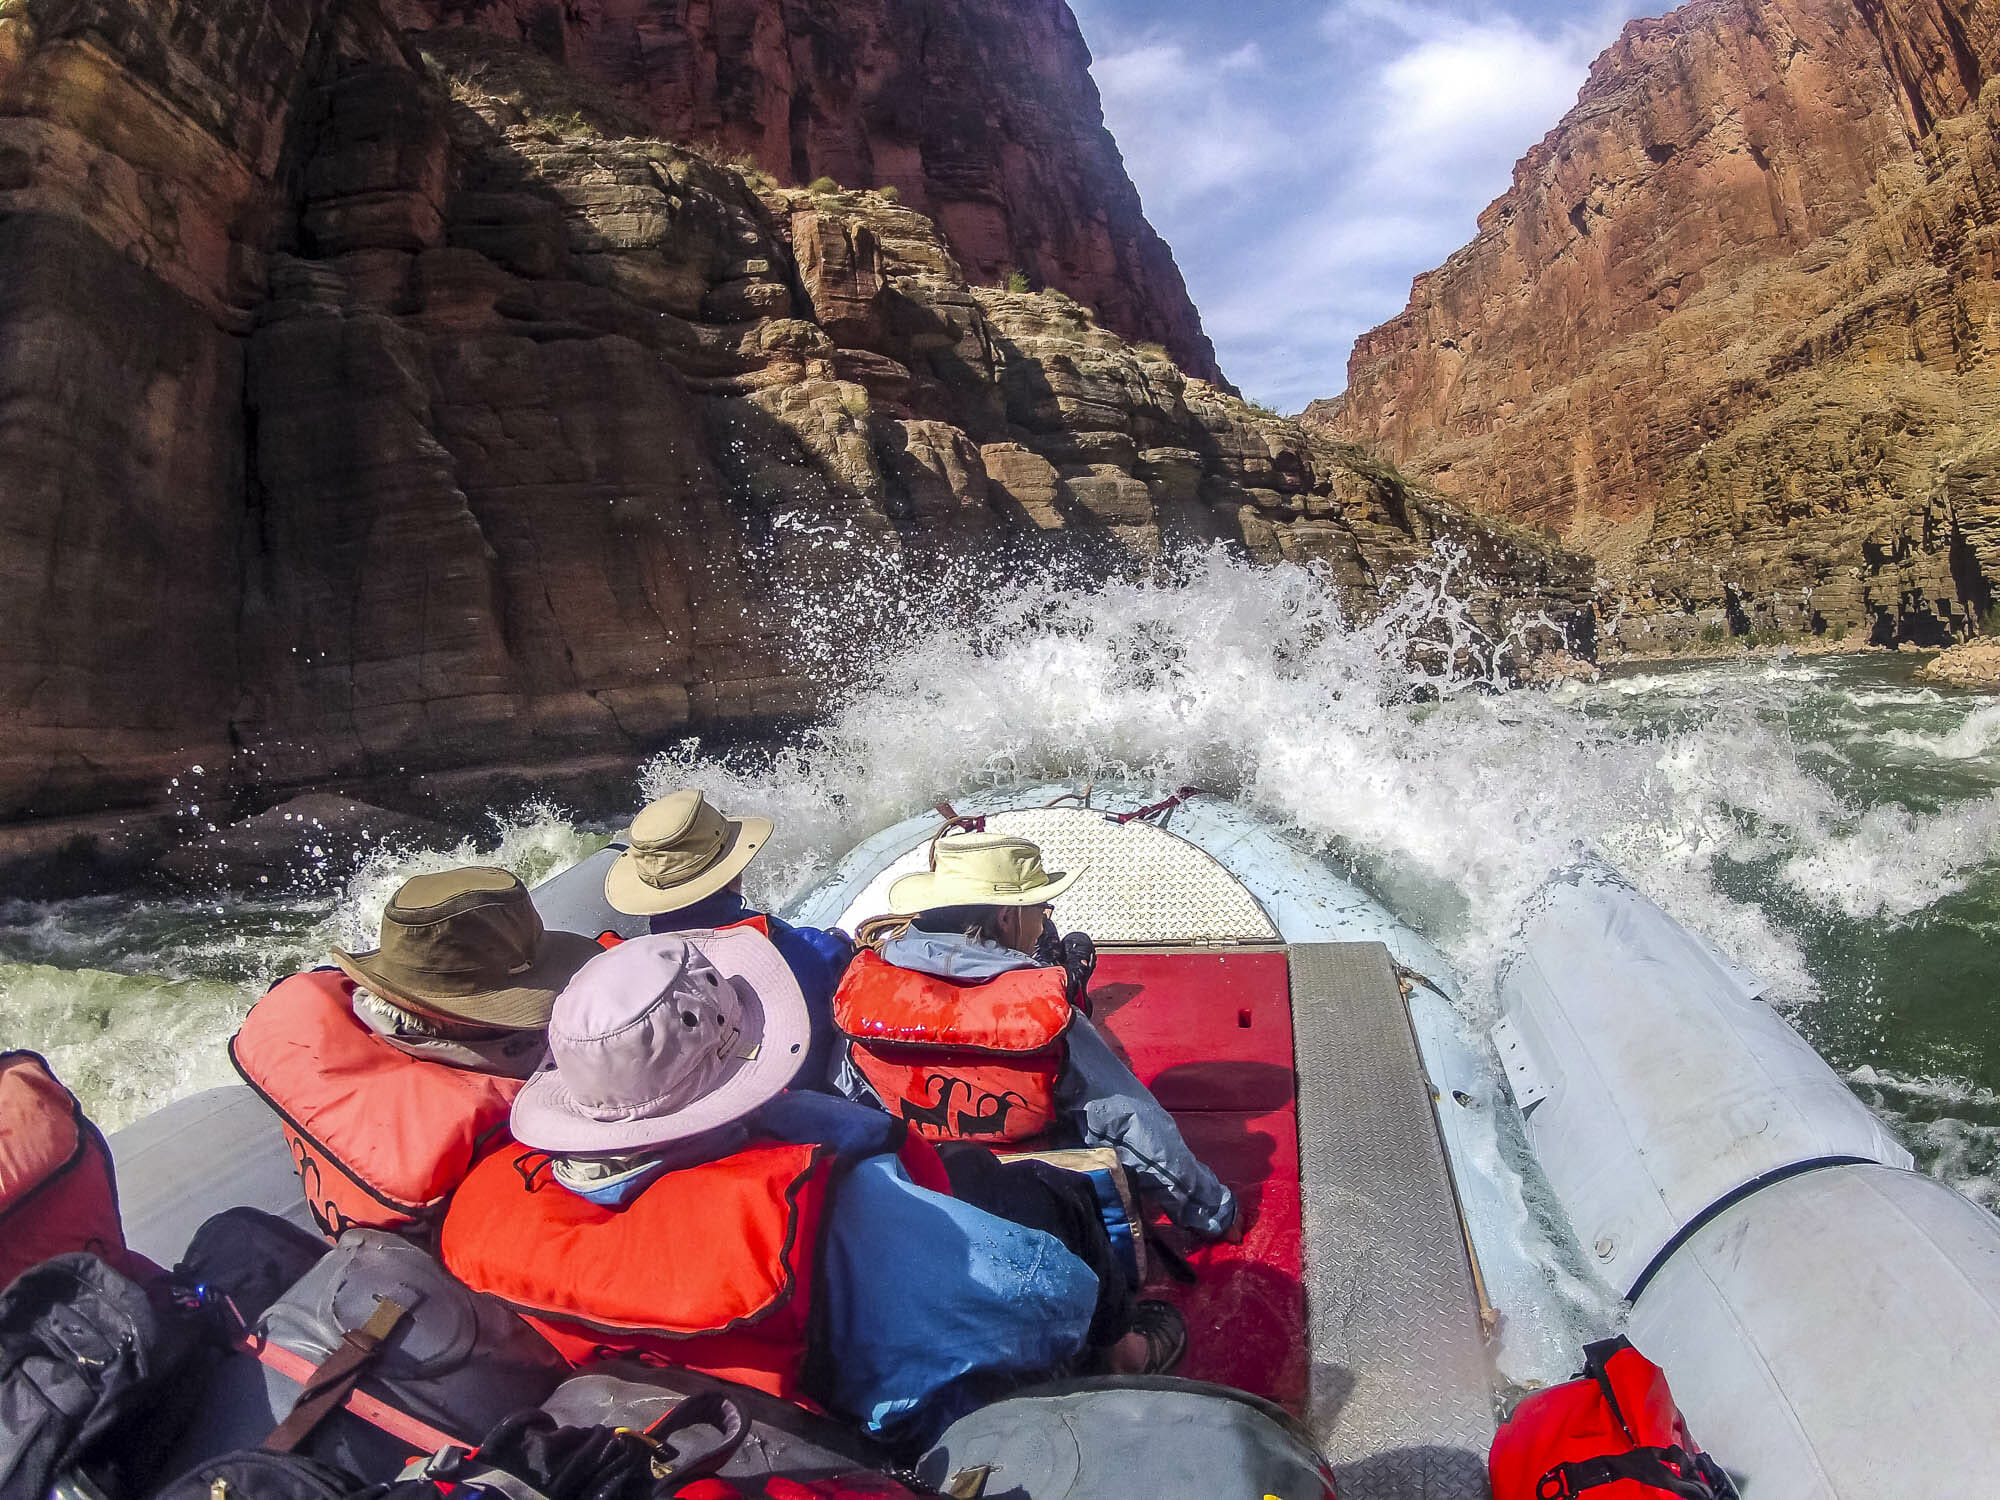
Adrenaline checklist in the US: Rafting in the Grand Canyon, Mountain biking the Grand Staircase in Utah, Rock Climbing in Yosemite National Park.

For the Silo, Alasdair Lindsay.

Methodology

  1. The experts at BestCasinoSites.net compiled a global index ranking the best countries for thrill-seekers by considering seven factors, including: (i) Number of casinos (ii) Number of roller coasters (iii) Number of rock climbing trails (iv) Number of mountain bike trails (v) Number of hiking trails (vi) Number of off road trails and (vii) Highest peak height in each country.

Note: Countries with more than two missing values were omitted, resulting in 61 countries in the final dataset.

  1. The experts collected the data from the below sources:

(i) Number of casinos: https://www.casinocity.com/casinos/ 

Note: In countries where gambling is illegal, the average number of casinos of all countries was taken (excluding US because of being a huge outlier) to ensure fairness and avoid penalising any specific country.

(ii) Number of roller coasters: https://rcdb.com/location.htm

(iii) Number of rock climbing trails: https://www.wikiloc.com/trails

(iv) Number of mountain bike trails: https://www.wikiloc.com/trails

(v) Number of hiking trails: https://www.wikiloc.com/trails

(vi) Number of off road trails: https://www.wikiloc.com/trails

(vii) Highest peak height in each country: https://flagpedia.net/lists/highest-point 

Note: The number of rock climbing, mountain bike, hiking and off road trails were sourced from user-posted data

  1. After collecting the numbers, the experts logarithmically normalised the figures in order to reduce skewness between countries with different sizes.
  2. A final adrenaline score out of 10 was calculated for each country to reveal the top 15 adrenaline hotspots across the globe.
  3. All data was collected on 5th February 2024 and is correct as of then.

*It’s crucial to thoroughly review the rules and regulations governing gambling in various countries before engaging in any gambling activities.