Tag Archives: Canada Economy

Canada’s Financial Rules May Be Holding Growth Back

  • In the second year of our regulatory scorecard paper, results continue to show the need for a more balanced approach to financial oversight, one that explicitly incorporates innovation and competition alongside traditional stability and consumer protection goals.
  • Newly issued and updated regulatory documents did not change previous results.
  • The imbalance reflects the mandates of Canadian regulators, which stand in contrast to those of their UK, Australian, and US peers, where innovation and competition are more explicitly recognized.
  • The study highlights deficiencies in the implementation and communication of cost-benefit analyses. Compliance costs are increasingly embedded across most of the financial sector workforce, with the share of labour costs and revenues devoted to compliance rising steadily, significantly exceeding international counterparts, and falling disproportionately on smaller firms.
  • If left unaddressed, these asymmetric and rising compliance costs risk diverting skilled labour and capital away from core business functions, undermining productivity, innovation, and the overall competitiveness of Canada’s financial sector.
  • Modernizing the mandates of Canadian regulators to explicitly recognize the tradeoffs between stability, investor protection, and economic dynamism is an economic imperative.

1. Introduction

Canada continues to face a well-documented struggle with weak productivity growth, poor business investment, and sluggish economic expansion.1 There is also a quantifiable link in Canada between growing regulatory burdens, including financial sector regulation and weaker growth.2 The challenge, therefore, is not whether to regulate, but how: regulators must find a balance between safeguarding financial stability and enabling economic dynamism. Achieving such a balance could be especially consequential in Canada, where both growth and competitiveness remain fragile.

Against this backdrop, a crucial question is whether Canadian financial regulators operate within a sound and structured framework that ensures the implementation of truly necessary rules and regulations. To provide an answer, this paper builds on the work of Bourque and Caracciolo (2024)3 which employed two complementary types of analysis – one theoretical, one empirical – to shed light on the strengths and the weaknesses of Canada’s regulatory landscape.

The theoretical analysis established the foundation for evaluating regulatory effectiveness by defining the core principles that should guide financial regulators in building a sound and efficient regulatory framework.4 It identified three essential steps that should underpin any regulation-making process: (1) thoroughly identifying the problem; (2) conducting a comprehensive cost-benefit analysis to weigh the implications of potential regulations; and (3) clearly articulating objectives to ensure predictability and consistency.

The empirical analysis involved a two-stage quantitative and qualitative textual analysis. The first stage consisted of an international comparison, where the performance of Canada’s primary federal financial regulator – the Office of the Superintendent of Financial Institutions (OSFI) – was benchmarked against two international counterparts: the United Kingdom’s Prudential Regulation Authority (PRA) and the Australian Prudential Regulation Authority (APRA). This comparative analysis helped contextualize OSFI’s regulatory approach in relation to best practices observed in other financially comparable jurisdictions.

The second stage dug deeper into the Canadian financial regulatory landscape, evaluating the regulations of the main federal and provincial bodies against the principles identified in the theoretical framework. To do this, Bourque and Caracciolo (2024) developed a comprehensive scorecard that assessed core regulatory documents to determine the extent to which Canadian regulators adhered to these principles.

The findings showed that although Canadian regulators have generally succeeded in crafting well-structured regulations, their approach often falls short of adhering – on aggregate – to the core principles outlined in the framework. This leads to a lack of predictability and a more reactive, rather than proactive, set of rules and regulations. In this environment, rules are introduced in response to emerging challenges rather than through proactive, forward-looking planning. Further, there is a notable lack of systematic and substantive use of cost-benefit analysis, both in the development of regulations and in communicating their expected impact.

The scorecard allowed for an investigation into the priorities of Canadian regulators. Most of the current regulations in Canada place financial stability and consumer protection as their primary goals. These are, of course, both crucial objectives; however, they are too often pursued without adequate consideration of their interplay with innovation and competition. As a result, regulatory frameworks may end up stifling growth, particularly among smaller firms that lack the resources to absorb compliance costs as easily as larger institutions.

Building on last year’s study, this paper has three principal objectives. First, it updates the regulatory scorecard. An annual update makes it possible to track how Canadian regulatory priorities evolve over time and assess whether any progress is being made in addressing the shortcomings identified earlier. Notably, this updated scorecard reveals that the fundamental orientation of Canadian financial regulation remains largely unchanged: stability and consumer protection continue to dominate (if anything, with a slight uptick), while considerations of dynamism, innovation, and competition remain on the back burner. To be sure, some rebalancing is emerging. Ad hoc initiatives – such as blanket orders, sandbox activities, and similar discretionary measures – have introduced some pockets of innovation and efforts to reduce administrative burden. Nevertheless, our main point persists: without a deeper shift in regulatory philosophy, such measures risk remaining isolated exceptions, rather than indicative of a broader shift.

To probe the core of Canadian regulators’ philosophy – and to test whether the observed regulatory imbalance is structural – the analysis is extended to include foundational documents that set out regulators’ objectives, mandates, and missions.5 Examining these texts allows for an assessment as to whether the current priorities are rooted in the very design and self-perception of regulatory institutions, rather than from recent or temporary policy choices. The results show a clear hierarchy of objectives in regulator mandates across the country, with stability and consumer protection firmly dominant. This stands in contrast to the mandates of regulators in the UK, Australia, and the US, where innovation and competition feature more prominently. Without a shift toward a more balanced regulatory philosophy, Canada risks falling further behind in competitiveness, innovation-driven growth, and overall economic resilience.

One consequence of this regulatory imbalance is the potential for disproportionate compliance costs – relative to benefits – being imposed on the financial sector. Hence, the third goal of the paper is to evaluate the cost side of cost-benefit analysis in regulatory decision-making. We do this by quantifying and identifying compliance costs imposed by financial regulations across different financial subsectors, with particular attention to varying firm sizes. By empirically assessing these costs, this study fills a critical gap in the literature, offering concrete evidence of how current regulatory frameworks affect businesses, especially smaller firms that may face a heavier burden. Our aim is to start a new, thorough, and reliable database that will create valuable insights for policymakers and regulators.

The first wave of results is concerning.

Although the benefits of regulation are difficult to measure, compliance duties are becoming increasingly embedded across most of the financial sector workforce. The share of labour and revenues devoted to compliance continues to rise – well above international counterparts – and the burden falls disproportionately on smaller firms. If left unaddressed, these asymmetric and rising compliance costs risk diverting skilled labour and capital away from core business functions, further undermining productivity, innovation, and the overall competitiveness of Canada’s financial sector.

2. The Updated Scorecard

2.1 Methodology

To update the regulatory scorecard, we employ the same textual and topic analysis framework as in the previous study (Bourque and Caracciolo 2024), applying it to newly issued and updated regulatory documents from the past year (June 2024 to June 2025) alongside previous documents. Our focus remains on key regulatory materials across the banking, insurance, pensions, and securities sectors, including Financial Services Regulatory Authority of Ontario (FSRA) Guidelines, Autorité des marchés financiers (AMF) Guidelines, Office of the Superintendent of Financial Institutions’ (OSFI) Guideline Impact Analysis (and related documents), and Canadian Securities Administrators’ (CSA) Companion Policies.6

Using natural language processing (NLP) techniques (see Bourque and Caracciolo [2024] for a more complete description), we extract and classify key terms, sentences, and logical arguments to assess how these documents address market failures (e.g., market abuse, asymmetric information, systemic and liquidity risk), policy objectives (e.g., stability, transparency, efficiency), and cost-benefit considerations.7 This allows us to evaluate the extent to which Canadian regulators align with the core principles of sound regulatory decision-making: problem identification, cost-benefit assessment, and clear articulation of objectives.

While the core methodology remains unchanged, this iteration refines our classification process.8 We will perform this update on an annual basis, allowing us to systematically track shifts in regulatory priorities over time. The full updated scorecard, which reflects these refinements and new findings, is presented in online Appendix C (Table 1).

2.2 Results

This updated regulatory scorecard reveals similar results as last year in Canadian financial regulation: the fundamental priorities of regulatory authorities have remained largely unchanged, with consumer protection, transparency, and stability dominating the regulatory agenda. Despite ongoing discussions about the need to stimulate economic growth in Canada, our analysis indicates that a more balanced approach to financial oversight, one that explicitly incorporates innovation and competition alongside these traditional goals, remains largely absent from newly issued and updated regulatory documents (evaluated alongside existing documents).

Most regulatory initiatives (approximately 92 percent versus 89 percent of last year) primarily target market abuse, stability, transparency, and, ultimately, improved consumer protection. On the other hand, a smaller fraction (around 14 percent, compared to 16 percent last year) explicitly aim to enhance efficiency, promote growth and innovation, and take into account the stability versus dynamism trade-off that is a critical part of any regulatory structure.

One notable exception among the newly analyzed documents is delivered by FSRA’s Guideline GR0014APP, which demonstrates a departure from the prevailing regulatory narrative. This document explicitly acknowledges the importance of fostering a more dynamic financial marketplace, introducing measures aimed at reducing barriers to entry and enhancing the competitive landscape.9 We also acknowledge that CSA’s National Instrument 81-101 Mutual Fund Prospectus Disclosure, which focuses on enhancing transparency and investor protection through standardized disclosure requirements, aims to simplify the disclosure procedure and, therefore, represents an important step forward in regulatory efficiency.

Beyond these individual measures, we note that FSRA and CSA have also set out broader ambitions. FSRA’s 2024–2027 Strategic Plan highlights burden reduction and regulatory efficiency, while CSA’s 2025–2028 Business Plan emphasizes internationally competitive markets and regulatory approaches that adapt to innovation and technological change. These commitments are commendable and encouraging, but they remain largely aspirational: they signal intent, but the challenge is whether they will translate into consistent features of day-to-day regulatory instruments. Our annual updated scorecard will be able to monitor this.

Breaking down our analysis to the single regulator level, FSRA stands out as the one that has gone furthest in bridging the gap between intentions and actions: around 17 percent of its analyzed documents now contain growth or innovation considerations (up from 13 percent last year). By contrast, CSA – which admittedly had the highest percentage last year – OSFI, and AMF remain closer to their prior levels, with innovation-oriented content in only 18 percent, 10 percent, and 10 percent of their documents, respectively. For now, the broader regulatory environment continues to disproportionately prioritize risk mitigation and consumer safeguards over fostering a more adaptive and competitive financial sector.

Moreover, and again consistent with last year, there is a dearth of explicit cost-benefit analysis or meaningful discussion of the broader economic costs imposed by the regulatory interventions across nearly all examined documents.10

3. Where Does This Imbalance Come From?

Our scorecard raises a fundamental question: is this imbalance an unintentional result, or does it reflect the regulators’ mandate and therefore a structural feature of Canada’s regulatory landscape? To answer this, we examined the mandates and missions of Canadian financial regulators (prudential and securities regulators alike). For the vast majority, dynamism, competition, and capital formation are typically only included following the mission statements – OSC being a notable exception. The primary focus of the mission statements remains on stability, investor protection, and market integrity, which are vital but fall short of capturing the full potential of a dynamic, innovative financial sector.

For example, OSFI’s mandate is to:

  • “ensure federally regulated financial institutions (FRFIs) and federally regulated pension plans (FRPPs) remain in sound financial condition;
  • ensure FRFIs protect themselves against threats to their integrity and security, including foreign interference;
  • act early when issues arise and require FRFIs and FRPPs to take necessary corrective measures without delay;
  • monitor and evaluate risks and promote sound risk management by FRFIs and FRPPs.”11

It is only after that that they say, “In exercising our mandate:

  • for FRFIs, we strive to protect the rights and interests of depositors, policyholders and financial institution creditors while having due regard for the need to allow FRFIs to compete effectively and take reasonable risks.”

To further substantiate this point, we look to see whether the secondary status of competition, cost, and innovation in Canadian regulators’ mandates is a uniquely Canadian phenomenon or part of a broader international pattern. Benchmarking against international best practices is particularly relevant in financial regulation, where peer jurisdictions face similar market dynamics and policy tradeoffs. By comparing Canada’s regulatory mandates to those of similar international counterparts, we can better assess whether the Canadian approach reflects a deliberate policy choice or a missed opportunity to align with evolving global standards.

As in the scorecard, we conducted a systematic textual analysis of the mandates and missions of major financial regulators in Canada, the UK,12 Australia,13 and the United States.14 Using natural language processing techniques, we extracted and quantified the most prominent themes and keywords in these foundational documents.15 The results are visually summarized in the accompanying wordclouds. The size of each word reflects its frequency and “keyness” – a measure of statistical importance and relevance within the analyzed texts. Unlike simple term frequency, this approach highlights the concepts and priorities regulators emphasize disproportionately relative to the overall corpus, providing a more nuanced quantitative assessment. The wordclouds thus offer an intuitive visual snapshot of the dominant regulatory themes.

What emerges from this analysis is a clear divergence in regulatory philosophy. The wordclouds for the UK and Australia show that terms such as “competition,” “growth,” and “cost” are extremely relevant in the language of their regulators’ mandates. This reflects an explicit and deliberate embedding of economic dynamism and efficiency into their regulatory objectives.

Indeed, the UK’s PRA and Australia’s APRA, while maintaining stability and consumer protection as core priorities, have made efforts to explicitly incorporate competition, innovation, and market adaptability into their mandates over the past decade (Figure 1). The PRA, for example, makes the case that long-term resilience requires a financial sector that is not only stable but also competitive, forward-looking, dynamic, and innovative. By integrating efficiency and market innovation, the PRA looks to ensure that the financial ecosystem can grow and evolve with emerging market demands.

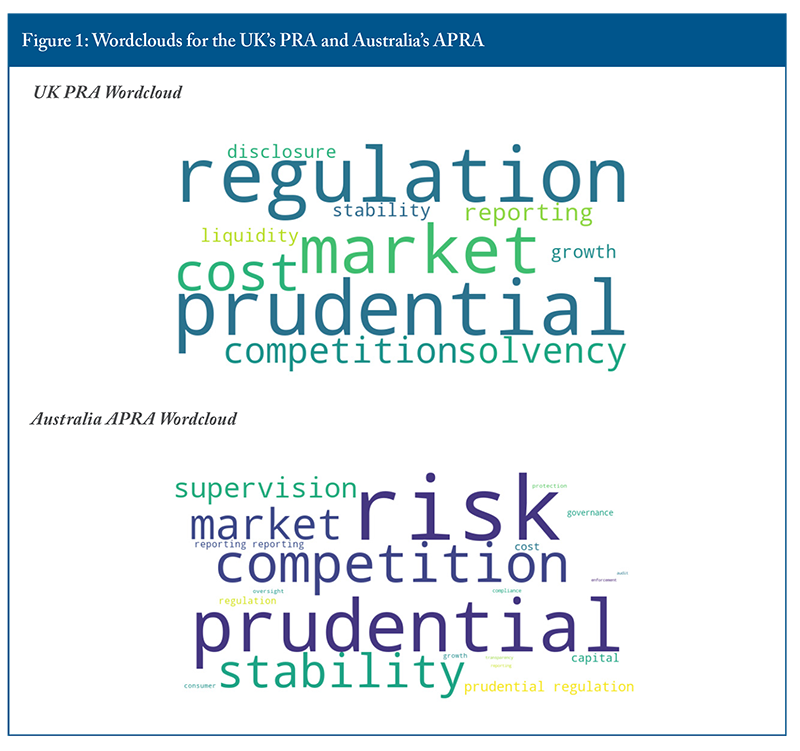
Similarly, APRA’s mandate balances the primary objective of safety “with considerations of competition, efficiency, contestability (making barriers to entry high enough to protect consumers but not so high that they unnecessarily hinder competition) and competitive neutrality (ensuring that private and public sector businesses compete on a level playing field).”16

In contrast, the wordclouds for Canadian deposit-taking and insurance regulators reveal a notable absence of such language (see Figure 2 for OSFI, FSRA17, and AMF18). Their mandates and mission, while perhaps containing references to competition and growth, are dominated by terms like “stability,” “solvency,” “obligation,” and “consumer protection.”

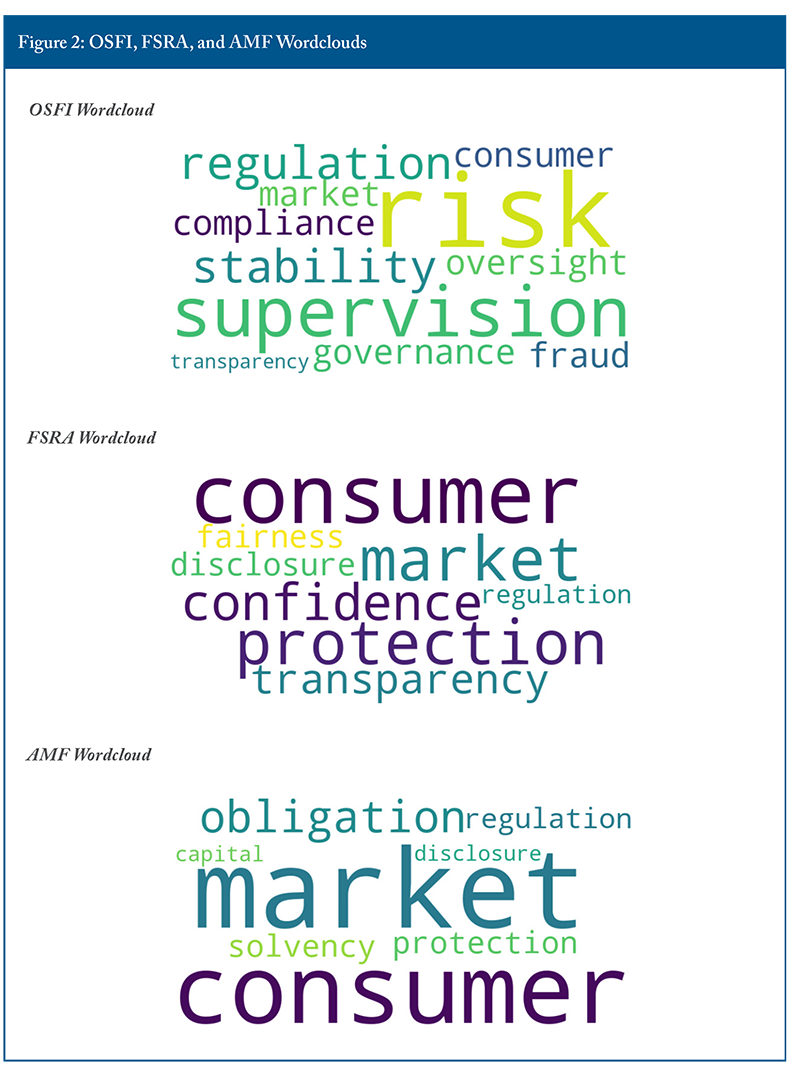
This linguistic gap is not just cosmetic; it reflects a structural difference in regulatory philosophy. Without a formal mandate to consider competition or cost, many Canadian regulators have less incentive to systematically integrate these factors into their rulemaking.

A similar divergence is evident in securities regulation. The UK’s Financial Conduct Authority (FCA) and the US Securities and Exchange Commission (SEC) place competition, growth, dynamism, and capital formation at the centre of their regulatory mandates (Figure 3).19

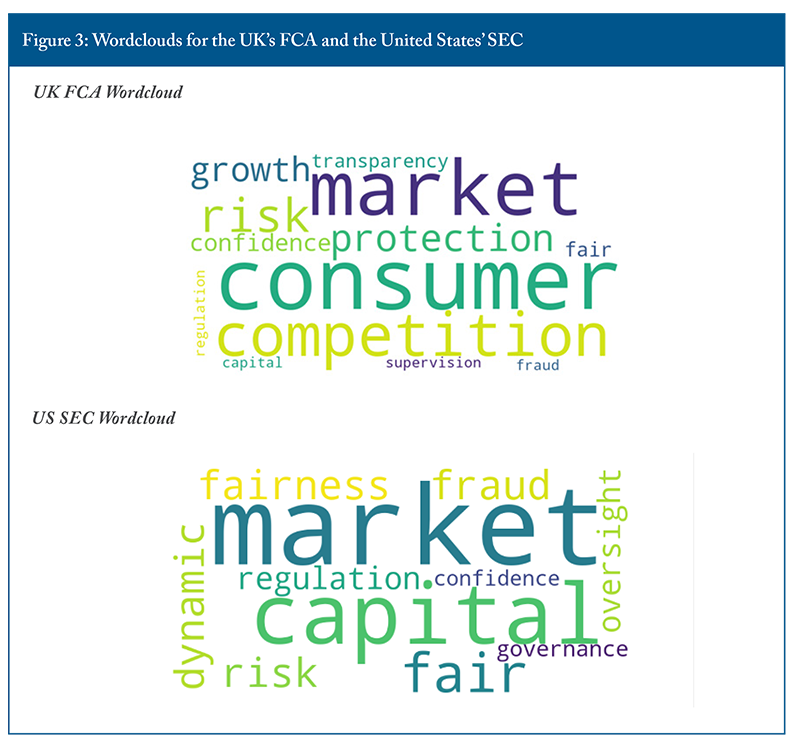
These are not just theoretical differences. SEC’s statutory responsibility to facilitate capital formation led to a practical framework that drives policies to increase market access for a broader range of firms. The SEC has introduced initiatives such as Regulation A+ and crowdfunding exemptions, which aim to make it easier for small and emerging firms to raise capital while balancing investor protection. The FCA’s mandate similarly incorporates competition as a core principle, emphasizing measures to ensure that financial markets remain vibrant and responsive to technological progress, highlighting also how this, in turn, will increase investors’ welfare.

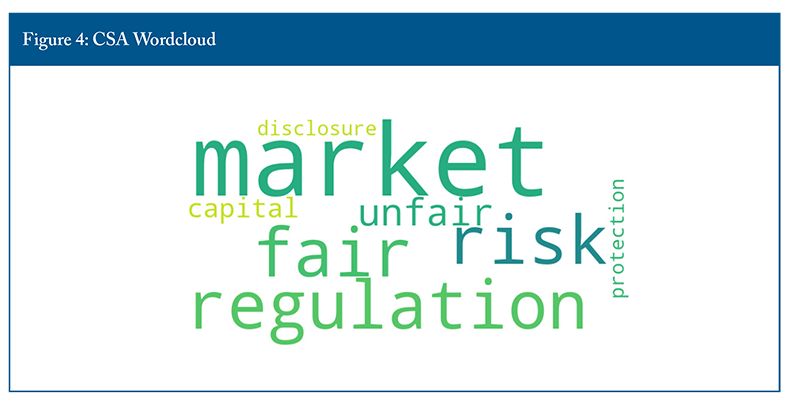
In contrast, although some of the largest securities commissions – such as the OSC, BCSC, and ASC – are notable exceptions, explicit competition or capital formation mandates are not necessarily the norm across our 13 provincial securities commissions, nor at the umbrella organization, the CSA (see Figure 4 for CSA’s wordcloud).20 The Ontario government did take a step in this direction in 2021, when it expanded the OSC’s mandate to include fostering capital formation and competition.

While investor protection and market integrity remain fundamental and essential objectives, the absence of a consistently clear directive to foster market dynamism means that regulatory actions are more likely to be slanted towards a more cautious, conservative approach. There have certainly been some targeted efforts to support innovation and broaden access to capital, such as the CSA’s Financial Innovation Hub21 and their harmonized crowdfunding rules, but these remain isolated and ad hoc. Unlike the systematic, mandate-driven commitment seen in the UK and the United States, Canadian initiatives are not consistently rooted in a formal regulatory priority to promote capital formation.

This regulatory gap is particularly concerning given Canada’s persistent struggles with weak productivity growth, poor investment, sluggish economic expansion, and relatively low levels of innovation adoption.22 A financial regulatory environment that does not explicitly encourage competition, innovation, and capital formation may reinforce these trends by raising barriers to entry, increasing compliance costs for smaller firms, and discouraging capital market participation, particularly from high-potential startups and emerging sectors. The absence of a statutory capital formation mandate within securities regulation means that new firms seeking to grow or disrupt established industries may face challenges in accessing the funding they need, further contributing to a stagnant market environment.

Modernizing the mandates of Canadian regulators to explicitly recognize the tradeoffs between stability, investor protection, and economic dynamism is an economic imperative. Without a shift toward a more balanced regulatory philosophy, Canada risks falling further behind in capital market competitiveness, innovation-driven growth, and overall economic resilience. Financial stability does not have to come at the expense of progress, and as other international regulators are trying to do, we should aim to achieve the best-designed regulatory framework in order to foster both stability and market growth. A more forward-looking mandate, in which competition, capital formation, and innovation are treated as integral to the health of the financial system, would not only strengthen Canada’s economic position but also ensure that its regulatory framework remains adaptable to future challenges and opportunities.

4. Neglected by Design: Quantifying the Costs of Regulation

A practical consequence of the imbalance in regulatory priorities are gaps in how cost-benefit analyses are designed and implemented in Canadian financial regulation. A further goal of this paper is to help push this issue ahead by developing a method for more accurately quantifying regulatory costs. The aim is to create a new, annually updated and survey-based cost database that provides a new lens on the regulatory burden and equips regulators with a tool to better understand the real impact of their activity across firms of different sizes and sectors. We acknowledge upfront that we focus specifically on the cost side of the analysis, leaving the benefits assessment to future work.

4.1 The Importance of Quantifying Regulatory Costs and the Difficulties Implied by the Task

The costs of regulations – across all industries, including financial services – are often cited as one of the biggest factors contributing to reduced market entry, increasing industry concentration, and weak investment. This pattern is evident worldwide, including in the United States and Canada (Gutiérrez and Philippon 2019, 2017), as well as in many other developed countries (Aghion et al. 2021). The mechanism postulated by the literature above is that compliance costs as a result of government regulations disproportionately impact small firms, creating barriers to new entrants, inhibiting business growth, and therefore ultimately slowing down productivity. Additionally, when large incumbents face increased regulatory costs, they either incur them, which may affect other parts of their business, or pass some of these costs on to consumers, especially if, given higher barriers, they end up possessing significant market power. As a result, consumers will also be adversely affected, which has broader implications for the overall economy.

The central issue remains the unresolved question of how to define and quantify the total compliance cost properly, as well as how to assess whether these costs affect small and large firms differently. Measuring compliance costs at the firm level is, in fact, a highly complex challenge from both qualitative and quantitative perspectives.

First, from a qualitative perspective, there is no unanimous agreement on which costs to include and how to model their impact on different firms. While some argue that the biggest part of compliance costs can be significantly decreased through economies of scale and lobbying, and therefore are much smaller for larger firms (Davis 2017; Alesina et al. 2018; Gutiérrez and Philippon 2019; Akcigit and Ates 2020; Aghion et al. 2021), others suggest that small businesses are, in fact, the ones in a better position, as they receive plenty of exemptions (Brock and Evans 1985; Aghion et al. 2021).23

Second, from a quantitative perspective, measuring firm-specific regulatory burdens presents numerous obstacles. Quantifying firm-level compliance costs is complex due to limited granular data. Existing studies often focus on broad relationships or industry-level shocks (Gutiérrez and Philippon 2019), lacking detailed evaluations of individual business burdens. These obstacles include variations in regulatory requirements across financial subsectors, overlapping regulations from different government levels, tiered compliance rules, varying inspection stringency, and differing technological and efficiency constraints across firm sizes (Agarwal et al. 2014; Stiglitz 2009; Kang and Silveira 2021; Goff et al. 1996). As Goff et al. (1996) noted, “the measurement problems are so extensive that directly observing the total regulatory burden is practically impossible.”

4.2 Modelling and Measuring Compliance Cost and Its Impact on Labour Productivity: Traditional Methods and Our Approach

Traditional approaches to quantifying the regulatory burden typically fall into two broad categories: counting the number of regulations in force or measuring the size of compliance departments within firms.24 The first approach, despite its widespread use, is simplistic and can be misleading. It assumes that each new regulation automatically adds the same weight to firms’ compliance burdens, failing, therefore, to account for differences in complexity, enforcement, and actual economic impact. Most importantly, it also disregards the fact that not all regulatory documents impose additional costs. Some provide clarifications, interpretation, simplify compliance procedures, or consolidate existing rules, thereby reducing uncertainty and making it easier for businesses to adhere to legal requirements. A regulatory framework with an extensive set of well-organized, clearly written guidelines can be far easier to navigate than a system with fewer but ambiguous or conflicting regulations. Yet, a raw count of regulations makes no such distinctions, treating all rules as equally burdensome and limiting insights into the real costs faced by businesses.

The second common approach – measuring the size of compliance departments – is somewhat more informative but still incomplete. This method operates on the assumption that regulatory costs can be estimated by looking at the number of employees explicitly assigned to compliance roles.25 While this metric does offer a tangible measure of firms’ direct expenditures on compliance, it fails to capture the reality that regulatory obligations extend far beyond dedicated compliance teams. In practice, firms cannot limit compliance tasks to a single department; employees across multiple functions – including finance, operations, and even customer service – must allocate significant portions of their work to meeting particular regulatory requirements. These responsibilities often divert employees from their core business functions, increasing operational complexity and reducing efficiency in ways that are difficult to measure using traditional methods.

The failure to account for these indirect costs leads to a fundamental misrepresentation of how regulatory compliance affects firms, particularly with respect to labour productivity. Standard measures of productivity typically calculate output per worker, assuming that all employee time is dedicated to value-generating activities. However, when employees across departments must dedicate significant portions of their time to compliance, their effective contribution to production decreases even if they are not officially counted as part of the compliance workforce. This distortion is particularly relevant in highly regulated industries, such as the financial sector, where firms must continuously adapt to evolving rules, engage in periodic audits, and maintain detailed reporting practices. These obligations consume work hours that could otherwise be devoted to innovation, strategic growth, or client service. By failing to account for these hidden labour costs, traditional approaches systematically underestimate the true economic impact of regulatory compliance.

Evidence in support of this argument comes from occupational data sources such as the US O*NET database, which provides firm-level insights into job responsibilities at the single-employee level across industries. These data reveal that compliance-related tasks affect, to different extents, most of the workers, and are not confined to designated regulatory personnel.26

A more accurate framework for assessing regulatory costs must therefore go beyond these limited proxies and capture the full extent of compliance-related labour reallocation. This is precisely what we try to accomplish with our project. Through detailed firm-level surveys, we collect data not only on compliance department size but also on how regulatory responsibilities are distributed across the entire workforce. By distinguishing between employees who are fully dedicated to compliance and those who must allocate a portion of their time to regulatory tasks, we can develop a more precise estimate of how compliance demands affect firms’ overall labour productivity and financial performance. Our approach, which we call the Compliance Labour Cost Index, allows us to measure variation in regulatory costs across firms of different sizes and financial subsectors, helping to assess whether burdens are proportionate or not.27

Furthermore, our survey methodology captures the evolution of compliance intensity over time. This paper presents the first wave of our survey, with our long-term goal being to conduct it every year, thereby creating a dynamic, up-to-date resource for understanding regulatory costs. By maintaining a consistent, structured approach to data collection, we will be able to track changes in compliance burdens over time, offering insights into whether new regulations are increasing costs, whether firms are finding more efficient ways to comply, and how regulatory expenses vary across different business models. This database will provide a clearer picture of regulatory costs at the firm level and also equip policymakers with the empirical evidence necessary to design smarter, more effective regulations – ones that balance economic growth with necessary oversight.

4.3 Survey Results

28

The results presented here are based on an unbalanced panel29 of survey responses covering three fiscal years: 2019, 2023, and 2024.30 This structure allows us to capture both pre- and post-pandemic conditions while filtering out the most acute COVID-19-related distortions in 2020, 2021, and 2022. The panel includes firms of varying sizes across the different subsectors of the Canadian financial sector, enabling both an aggregate view and size-based comparisons. The key findings from this survey can be grouped into four main observations, each highlighting a distinct aspect of the compliance burden.

Fact 1: Compliance is Everyone’s Job!

Compliance work is now deeply embedded across the financial sector workforce. In 2024, on average, 73 percent of employees had at least some compliance-related duties, and close to 8 percent spent the majority of their time (75–100 percent) on such tasks. As postulated in the previous sections, regulatory obligations are not confined to specialist compliance teams but are interwoven into the daily operations of most departments, diverting time and focus away from activities that directly generate value for clients or shareholders. The pervasiveness of compliance roles means that regulation is no longer something handled at the margins of the business, but rather a constant presence shaping workflows across the organization.

Fact 2: Compliance Is Eating Payroll – A Growing Regulatory Burden Is Reshaping Workforce Allocation

The share of total labour costs devoted to compliance-related activities (time and salaries spent meeting regulatory requirements rather than delivering core products or services) has been rising steadily. Our Compliance Labour Cost Index stood at approximately 16 percent in 2019, rose to around 19 percent in 2023, and reached 22 percent in 2024. To put it differently, around one dollar in every five spent on payroll is now directed to tasks that exist solely to ensure regulatory adherence. To put these figures in context, Trebbi et al. (2023), using US establishment-level O*NET data, estimate that regulatory compliance accounts for 2.3 percent to 2.7 percent of total labour costs across the US financial sector. This divergence highlights the crucial need for a more systematic cost-benefit approach in Canadian regulatory design. We simply cannot afford such a big gap.31

Fact 3: External Compliance Costs Are Also Surging, and Are Eating into Revenues

While internal labour costs capture the human effort behind compliance, they tell only part of the story. A significant (and growing) portion of the regulatory burden is channelled through external spending: advisory fees, legal fees, compliance technologies, governance structures, and membership dues. These costs are less visible but no less impactful, directly affecting firms’ bottom lines and reducing their strategic flexibility. To gauge both their scale and their evolution over time, we measure external compliance costs as a share of total revenues. We can observe how this ratio has risen steadily over the three years analyzed, climbing from about 1.2 percent in 2019 to 1.6 percent in 2024. The increase reinforces how compliance imposes a mounting financial strain beyond internal labour, diverting resources that could otherwise be invested in innovation, growth, and other productive initiatives.

Fact 4: Size Matters (a Lot!) – The Compliance Burden Hits Small Firms Hardest

A striking asymmetry emerges between small firms (under 100 employees) and large firms (over 100 employees).32 While the growth rate of compliance involvement and costs appears independent of firm size, their magnitude is not. In both 2023 and 2024, an average of 35 percent of workers in small firms had high or medium compliance involvement, compared with just 13 percent in larger ones.

As a natural consequence, smaller institutions shoulder significantly higher compliance costs: in 2024, the labour cost index reached 20 percent for small firms, compared with 12 percent for larger ones.

This imbalance is particularly worrying when we consider that small firms and startups are often the main engines of innovation, and as they grow, of productivity growth as well. Yet, these seem to be precisely the firms disproportionately drained by regulatory demands, risking a throttling effect on the dynamism and competitiveness of the entire financial sector.

In short, these facts require attention. Reassessing compliance costs must be an urgent priority on the regulators’ agenda, as it is essential to ensure the health and resilience of our financial sector.

5. Policy Discussion and Conclusion

The updated regulatory scorecard confirms that the core patterns identified in prior analysis persist. Canadian financial regulation continues to focus overwhelmingly on stability and consumer protection, while innovation, competition, and cost-efficiency remain secondary. This regulatory orientation is not just a product of recent policy inertia; it is deeply rooted in the structural design of mandates and institutional priorities. Current mandates apply a lexicographic hierarchy that prioritizes financial stability and consumer safeguards above all else – often at the expense of reducing unnecessary regulatory burdens and fostering economic dynamism and growth.

This imbalance is set to become an even greater challenge amid profound global shifts. Political instability in the United States, ongoing conflicts, and broader geopolitical tensions have created a more volatile and unpredictable environment. Stability will remain crucial, but Canada also has an opportunity to adopt regulatory frameworks that actively promote efficiency, innovation, and growth. With such elements in place, Canadian financial institutions can better thrive in a changing world while reinforcing the very stability regulators aim to safeguard.

The costs of the current imbalance are already evident. Evidence shows that compliance burdens are rising sharply, with significant implications for firms’ competitiveness. Our Compliance Labour Cost Index, which tracks regulatory labour across the sector, reveals that compliance demands grew from 16 percent of total internal labour in 2019 to 21 percent in 2024. The strain is particularly acute for smaller firms, where compliance costs reached 28 percent of payroll – double the share borne by larger institutions. External compliance expenses, including advisory, technology, and governance costs, have also grown, further restricting firms’ ability to invest in growth and innovation.

These findings show that stability-focused regulation, absent economic balance, can erode productivity, innovation, and long-term market vitality. Smaller firms are particularly vulnerable, even though they are central drivers of competition and innovation. Policy responses should therefore focus on two priorities.

First, regulatory mandates must be modernized to recognize the full set of policy objectives: stability, investor protection, efficiency, growth, and competition. Explicitly embedding economic goals alongside traditional safeguards would bring Canadian practice closer to international standards and create a more adaptive framework. Encouragingly, securities regulators in Ontario, BC, and Alberta, as well as Ontario’s provincial prudential regulator, FSRA, have already begun acknowledging this need in business plans that emphasize competitiveness and in guidelines aimed at reducing regulatory burden. Our scorecard will continue to track whether such commitments translate into practice.

Second, regulatory design should always require rigorous cost-benefit analyses that are made publicly available at the outset of rulemaking. Transparent, upfront cost-benefit analyses would establish clear benchmarks against which post-implementation reviews can be meaningfully conducted. Tools such as our Compliance Labour Cost Index can enrich this process of comparison. Institutionalizing public cost-benefit analyses would ensure that regulations are evaluated not only against their intended goals but also against their real-world economic costs, enabling more proportionate and adaptive policymaking.

In sum, safeguarding stability and protecting consumers remain essential. But stability itself increasingly depends on Canada’s ability to sustain competitive, innovative, and efficient financial markets.

The author extends gratitude to Pragya Anand, Angélique Bernabé, Ian Bragg, Jeff Guthrie, Sarah Hobbs, Jeremy Kronick, Peter MacKenzie, Grant Vingoe, Mark Zelmer, Tingting Zhang, and several anonymous referees for valuable comments and suggestions. The author retains responsibility for any errors and the views expressed.

For the Silo, Gherardo Caracciolo – C.D. Howe Institute.

REFERENCES

Agarwal, Sumit, David Lucca, Amit Seru, and Francesco Trebbi. 2014. “Inconsistent Regulators: Evidence from Banking.” The Quarterly Journal of Economics 129(2): 889–938.

Aghion, Philippe, Antonin Bergeaud, Timo Boppart, Peter J. Klenow, and Huiyu Li. 2019. “Missing Growth from Creative Destruction.” American Economic Review 109(8): 2795–2822.

Akcigit, Ufuk, and Sina T. Ates. 2020. “Ten Facts on Declining Business Dynamism and Lessons from Endogenous Growth Theory.” American Economic Journal: Macroeconomics 13(1): 257–298.

Alesina, Alberto, Carlo A. Favero, and Francesco Giavazzi. 2018. “What Do We Know about the Effects of Austerity?” American Economic Association Papers and Proceedings 108: 524–530.

Bourque, Paul C., and Gherardo Gennaro Caracciolo. 2024. The Good, the Bad and the Unnecessary: A Scorecard for Financial Regulations in Canada. Commentary 664. Toronto: C.D. Howe Institute. July. https://cdhowe.org/publication/good-bad-and-unnecessary-scorecard-financial-regulations-canada/.

Brock, William A., and David S. Evans. 1985. The Economics of Small Businesses: Their Role and Regulation in the U.S. Economy. New York: Holmes & Meier.

Davis, Steven J. 2017. “Regulatory Complexity and Policy Uncertainty: Headwinds of Our Own Making.” Brookings Papers on Economic Activity (Fall): 301–375.

Eichenbaum, Martin, Michelle Alexopoulos, and Jeremy Kronick. 2024. “Economists Must Convince the Public That Productivity Isn’t Just a Number.” The Globe and Mail. August 5. https://cdhowe.org/publication/eichenbaum-alexopoulos-kronick-economists-must-convince-public-productivity-isnt-just/.

Goff, Brian L., et al. 1996. Regulation and Macroeconomic Performance. Vol. 21. New York: Springer Science & Business Media.

Gu, Wulong. 2025. “Regulatory Accumulation, Business Dynamism and Economic Growth in Canada.” Analytical Studies Branch Research Paper Series, no. 481. Statistics Canada. February 10. https://doi.org/10.25318/11f0019m2025002-eng.

Gutiérrez, Germán, and Thomas Philippon. 2017. “Declining Competition and Investment in the U.S.” NBER Working Paper No. 23583. https://doi.org/10.3386/w23583.

_______________. 2019. “The Failure of Free Entry.” NBER Working Paper No. 26001.

Kang, Karam, and Bernardo S. Silveira. 2021. “Understanding Disparities in Punishment: Regulator Preferences and Expertise.” Journal of Political Economy 129(10): 2947–2992.

Restuccia, Diego, and Richard Rogerson. 2008. “Policy Distortions and Aggregate Productivity with Heterogeneous Establishments.” Review of Economic Dynamics 11(4): 707–720.

Robson, William B.P., and Mawakina Bafale. 2024. Underequipped: How Weak Capital Investment Hurts Canadian Prosperity and What to Do about It. Commentary 666. Toronto: C.D. Howe Institute. September. https://cdhowe.org/publication/underequipped-how-weak-capital-investment-hurts-canadian-prosperity-and-what/.

Stiglitz, Joseph. 2009. “Regulation and Failure.” In New Perspectives on Regulation, edited by David Moss and John Cisternino, 11–23. Cambridge, MA: The Tobin Project.

Trebbi, Francesco, Miao Ben Zhang, and Michael Simkovic. 2023. “The Cost of Regulatory Compliance in the United States.” USC Marshall School of Business Research Paper. January 15. https://doi.org/10.2139/ssrn.4331146.

Let’s Transform Canada’s AI Research Into Real World Adoption

October, 2025 – Canada has world-class strength in AI research but continues to fall short in widespread adoption, according to a new report from the C.D. Howe Institute. On the heels of the federal government’s announcement of a new AI Strategy Task Force, the report highlights the urgent need to bridge the gap between research excellence and real-world adoption.

In “AI Is Not Rocket Science: Ideas for Achieving Liftoff in Canadian AI Adoption,” Kevin Leyton-Brown, Cinda Heeren, Joanna McGrenere, Raymond Ng, Margo Seltzer, Leonid Sigal, and Michiel van de Panne note that while Canada ranks second globally in top-tier AI researchers and first in the G7 for per capita publications, it is only 20th in AI adoption among OECD countries. “This matters for the economy as a whole, because such knowledge translation is a key vehicle for productivity growth,” the authors say. “It is terrible news, then, that Canada experienced almost no productivity growth in the last decade, compared with a rate 15 times higher in the United States.”

The authors argue that new approaches to knowledge translation are needed because AI is not “rocket science”: instead of focusing on a single industry sector, the discipline develops general-purpose technology that can be applied to almost anything. This makes it harder for Canadian firms to find the right expertise and for academics to sustain ties with industry. Existing approaches – funding academic research, directly subsidizing industry efforts through measures such as SR&ED and superclusters, and promoting partnerships through programs like Mitacs and NSERC Alliance – have not solved the problem.

Four ideas to help firms leverage Canadian academic strength to fuel their AI adoption include: a concierge service to match companies with experts, consulting tied to graduate student scholarships, “research trios” that link AI specialists with domain experts and industry, and a major expansion of AI training from basic literacy to dedicated degrees and continuing education. Drawing on their experiences at the University of British Columbia, the authors show how local initiatives are already bridging gaps between academia and industry – and argue these models should be scaled nationally.

“Canada’s unusual strength in AI research is an enormous asset, but it’s not going to translate into real-world productivity gains unless we find better ways to connect AI researchers and industrial players,” says Kevin Leyton-Brown, professor of computer science at the University of British Columbia and report co-author. “The challenge is not that AI is too complicated – it’s that it touches everything. That means new models of partnership, new incentives, and new approaches to education.”

AI Is Not Rocket Science- 4 Ideas in Detail

Idea 1: A Concierge Service for Matchmaking

We have seen that it is hard for industry partners to know who to contact when they want to learn more about AI. Conversely, it is at least as hard for AI experts to develop a broad enough understanding of the industry landscape to identify applications that would most benefit from their expertise. Given the potential gains to be had from increasing AI adoption across Canadian industry, nobody should be satisfied with the status quo.

We argue that this issue is best addressed by a “concierge service” that industry could contact when seeking AI expertise. While matchmaking would still be challenging for the service itself, it could meet this challenge by employing staff who are trained in eliciting the AI needs of industry partners, who understand enough about AI research to navigate the jargon, and who proactively keep track of the specific expertise of AI researchers across a given jurisdiction. This is specialized work that not everyone could perform! However, many qualified candidates do exist (e.g., PhDs in the mathematical sciences or engineering). Such staff could be funded in a variety of different ways: for example, by an AI institute; a virtual national institute focused on a given application area; a university-level centre like UBC’s Centre for Artificial Intelligence Decision-making and Action (CAIDA); a nonprofit like Mitacs; a provincial ministry for jobs and economic growth; or the new federal ministry of Artificial Intelligence and Digital Innovation.

Having set up an organization that facilitates matchmaking, it could make sense for the same office to provide additional services that speed AI adoption, but that are not core strengths of academics. Some examples include project management, programming, AI-specific skills training and recruitment, and so on. Overall, such an organization could be funded by some combination of direct government support, direct cost recovery, and an overhead model that reinvests revenue from successful projects into new initiatives.

Idea 2: Consultancy in Exchange for Student Scholarships

Many businesses that would benefit from adopting AI do not need custom research projects and do not want to wait a year or more to solve their problems. The lowest-hanging fruit for Canadian AI adoption is ensuring that industry is well informed about potentially useful, off-the-shelf AI technologies. We thus propose a mechanism under which AI experts would provide limited, free consulting to local industry. AI experts would opt in to being on a list of available consultants. A few hours of advice would be free to each company, which would then have the option of co-paying for a limited amount of additional consulting, after which it would pay full freight if both parties wanted to continue. The company would own any intellectual property arising from these conversations, which would thus focus on ideas in the public domain. If the company wanted to access university-owned IP, it could shift to a different arrangement, such as a research contract. This system would work best given a concierge service like the one we just described. The value offered per consulting hour clearly depends on the quality of the academic–industry match, and some kind of vetting system would be needed to ensure the eligibility of industry participants.

Why would an AI expert sign up to give advice to industry? All but the best-funded Canadian faculty working in AI report that obtaining enough funding to support their graduate students is a major stressor. Attempting to establish connections with industry is hard work, and such efforts pay off only if the industry partner signs on the dotted line and matching funds are approved. There is thus space to appeal to faculty with a model in which they “earn” student scholarships for a fixed amount of consulting work. For example, faculty could be offered a one- semester scholarship for every eight hours set aside for meetings with industry, meaning that one weekly “industry office hour” would indefinitely fund two graduate students. Consulting opportunities could also be offered directly to postdoctoral fellows or senior (e.g., post-candidacy) PhD students in exchange for fellowships. In such cases, trainees should be required to pass an interview, certifying that they have both the technical and soft skills necessary to succeed in the consulting role. The concierge service could help decide which industry partners could be routed to PhD students and which need the scarcer consulting slots staffed by faculty members.

The system would offer many benefits. From the industry perspective, it would make it straightforward to get just an hour or two of advice. This might often be enough to allow the company to start taking action towards AI adoption: there is a rich ecosystem of high-performance, reliable, and open-source AI tools; often, the hard part is knowing what tool to use in what way. Beyond the value of the advice itself, consulting meetings offer a strong basis for building relationships between academics and industry representatives, in which the academic plays the role of a useful problem solver rather than of a cold-calling salesperson. These relationships could thus help to incubate Mitacs/Alliance-style projects when research problems of mutual interest emerge (though also see our idea below about how restructuring such projects could help further).

For academics, the system would constitute a new avenue for student funding that would reward each hour spent with a predictable amount of student support. Furthermore, it would offer scaffolded opportunities to deepen connections with industry. The system would come with no reporting requirements beyond logging the time spent on consulting. The faculty member would be free to use earned scholarships to support any student (regardless, for example, of the overlap between the student’s research and the topics of interest to companies), increasing flexibility over the Mitacs/Alliance system, in which specific students work with industry partners. Students who self-funded via consulting would learn valuable skills and would expand their professional networks, improving prospects for post-graduation employment.

Finally, the system would also offer multiple benefits from the government’s perspective. It would generate unusually high levels of industrial impact per dollar spent (consider the number of contact hours between academia and industry achieved per dollar under the funding models mentioned in Section 3). All money would furthermore go towards student training. The system would automatically allocate money where it is most useful, directing student funding to faculty who are both eager to take on students and relevant to industry, all without the overhead of a peer-review process. And it would generate detailed impact reports as a side effect of its operations, since each hour of industry–academia contact would need to be logged to count towards student funding.

Idea 3: Grants for Research Trios

Our third proposal is an approach for expanding the Mitacs/Alliance model to make it work better for AI. Industry–academia partnerships leverage two key kinds of expertise from the academic side: methodological know-how for solving problems and knowledge about the application domain used for formulating such problems in the first place. In fields for which the set of industry partners is relatively small and relatively stable, it makes sense to ask the same academics to develop both kinds of expertise. In very general-purpose domains like AI, it holds back progress to ask AI experts to become domain experts, too. Instead, it makes sense to seek domain knowledge from other academics who already have it. We thus propose a mechanism that would fund “research trios” rather than bilateral research pairings. Each trio would contain an AI expert, an academic domain expert, and an industry partner. This approach capitalizes on the fact that there is a huge pool of academic talent outside core AI with deep disciplinary knowledge and a passion for applying AI. While such researchers are typically not in a position to deeply understand cutting-edge AI methodologies, they are ideally suited to serve as a bridge between researchers focused on AI methodologies and Canadian industrial players seeking to achieve real-world productivity gains. In our experience at UBC, the pool of non-AI domain experts with an interest in applying AI is considerably larger than the pool of AI experts. One advantage of this model is that projects can be initiated by the larger population of domain experts, who are also more likely to have appropriate connections to industry. Beyond this, involving domain experts increases the likelihood that a project will succeed and gives industry partners more reason to trust the process while a solution is being developed. The model meets a growing need for funding researchers outside computer science for projects that involve AI, rather than concentrating AI funding within a group of specialists. At the same time, it avoids the pitfall of encouraging bandwagon-jumping “applied AI” projects that lack adequate grounding in modern AI practices. Finally, it not only transfers AI knowledge to industry, but also does the same to both the domain expert and their students.

Idea 4: Greatly Expanded AI Training

As AI permeates the economy, Canada will face an increasing need for AI expertise. Today, that training comes mostly in the form of computer science degrees. Just as computer science split off from mathematics in the 1960s, AI is emerging today as a discipline distinct from computer science. In part, this shift is taking the form of recognizing that not every AI graduate needs to learn topics that computer science rightly considers part of its core, such as software engineering, operating systems, computer architecture, user interface design, computer graphics, and so on. Conversely, the shift sees new topics as core to the discipline. Most fundamental is machine learning. Dedicated training in AI will require a deeper focus on the mathematical foundations of probability and statistics, building to advanced topics such as deep learning, reinforcement learning, machine learning theory, and so on. Various AI modalities also deserve separate study, such as computer vision, natural language processing, multiagent systems, robotics, and reasoning. Training in ethics, optional in most computer science programs, will become essential.

Beyond dedicated training in the core discipline, we anticipate huge demand for broad-audience AI literacy training; for AI minors to complement other disciplinary specializations; for continuing education and “micro-credential” programs; and for executive education in AI. There is also a growing need for “AI Adoption Facilitators”: bridge-builders who can help established workers in medium-to-large organizations understand how data-driven tools could offer value in solving the problems they face. Training for this role would emphasize business principles and domain expertise, but would also require firmer foundations in machine learning and data science than are currently typical in those disciplines.

Read the full report via our friends at C.D. Howe Institute here.

Immigration Is Not Canada Cure All- Here’s Why

May, 2025 – Canada cannot rely on immigration alone to address the challenges posed by its ageing population and relentless decline in fertility rates [ see Canada’s Soaring Housing and Living Costs Stop Baby Making CP], according to a new report from our friends at the C.D. Howe Institute. Without a broader population strategy, rising immigration could fuel rapid growth while straining housing, healthcare, and infrastructure – without fully resolving rising old-age dependency ratios or labour force pressures.

In this post, Daniel Hiebert confronts an important policy dilemma: although immigration increases overall population and helps address short-term labour gaps, the long-term trade-offs are significant. Without corresponding investment and planning, rising immigration risks compounding the very pressures it aims to alleviate.

“This is a particularly opportune moment to reflect on how immigration fits into Canada’s long-term demographic strategy, especially as both permanent and temporary immigration surged between 2015 and 2024, and are now being scaled back,” says Hiebert. “We need to think ahead about what kind of future we are building — and how we get there.”

Based on current patterns, it takes five new immigrants to add just one net new worker, once dependents and added consumer demand are factored in — a reality that undermines assumptions about immigration as a direct fix for labour shortages.

Hiebert argues that Canada must move beyond short-term immigration planning and adopt a long-range population strategy — one that combines immigration with other tools like delayed retirement, increased workforce participation, and stronger productivity growth. The alternative, he warns, is a “population trap”: a scenario where growth outpaces the country’s capacity to support it, undercutting prosperity in the process.

The report also calls on governments to coordinate immigration levels with long-term planning in housing, healthcare, education, and infrastructure.

“There’s no question that immigration is integral to Canada’s future,” says Hiebert. “But assuming it can carry the load alone ignores the structural pressures we’re facing — and the investments we need to make today to ensure future stability.”

Balancing Canada’s Population Growth and Ageing Through Immigration Policy

  • Canada faces twin demographic pressures: an ageing population and rapid population growth driven by immigration. The report argues that immigration levels must strike a careful balance – sufficient to offset some effects of low fertility and an ageing workforce, but not so high as to outpace infrastructure and economic capacity.
  • A sustainable population strategy requires coordinated planning across immigration, infrastructure, workforce participation, and capital investment. The report calls for long-term planning that aligns immigration policy with economic and social goals and emphasizes the need to manage absorptive capacity to avoid overburdening housing, healthcare, and public services.

Introduction

Declining fertility is a global trend and is especially pronounced in countries with high levels of economic development. These countries share the common challenge of ageing populations, with rising old-age dependency ratios (OADRs)1 and a shrinking portion of the population in prime working age. Several policy responses have been established to deal with this emerging reality, including pronatalist and other family-based social programs, efforts to enhance automation and productivity, incentivization of a larger proportion of the population to enter the formal labour force, delaying retirement benefits, and increasing the rate of immigration. The success of these approaches has varied, raising critical questions for policymakers: which strategies are the most efficient? What are their costs? And which policies offer the best balance between risk and reward?

This Commentary explores the potential role and limitations of immigration in alleviating Canada’s challenges of low fertility and ageing. This is a particularly opportune moment to consider such an issue given that both permanent and temporary immigration strongly increased between 2015 and 2024 and will be reduced for the 2025 to 2027 period.

Using custom demographic projections, this paper examines how various immigration scenarios – ranging from historical rates to the peak of 2024 – will affect Canada’s demographic outlook over the next 50 years. The analysis investigates the role immigration could play in mitigating the effects of an ageing population, while also acknowledging the associated trade-offs, including pressures on infrastructure and rapid population growth. The findings highlight that Canada’s immigration policy, while important, should be framed within a long-term population strategy that aligns immigration policy with broader economic and social goals – including capital investment, productivity, delayed retirement, and expanded social infrastructure – to ensure sustainable growth and enhanced prosperity for all Canadians.

Canada’s Demographic Challenge and Recent Immigration Policy Responses

Canada’s current demographic challenge is the product of two primary factors: low fertility and the ageing and retirement of the Baby Boom generation. Canada’s fertility rate first rapidly declined from the peak of the Baby Boom (1950s) to the early 1970s, when it first fell below the replacement level. Since then, it has continued with a slower, though persistent decline, interrupted by occasional slight recoveries. Most recent calculations reveal that Canada’s fertility rate is now at 1.26 – a level unprecedented in Canadian history and among the lowest globally. The consequences of low fertility are particularly pronounced today due to the ageing of the Baby Boom generation. In 2025, this cohort ranges in age from 59 to 79 years old, while the average age of retirement in Canada was 65.1 in 2023. Around two-thirds of boomers have already reached the age of 65, with the remaining third expected to follow in the coming years. The impact of this demographic shift is therefore ongoing and continues to affect the labour market and economy at large.

Throughout its history, Canada has turned to immigration to resolve demographic challenges (Hiebert 2016). From the late 1940s to the mid-1980s, Canada admitted an average of 150,000 permanent residents annually, though numbers fluctuated. By the end of that period, concerns over low fertility began to be articulated. This prompted the government to increase annual immigration levels to 250,000, a figure that was quite consistent over the following 30 years, with annual rates ranging from the low to high 200,000s. By the end of the 20th century, immigration accounted for over half of Canada’s population growth and labour force expansion.

The most recent shift in immigration policy began in late 2015 under the Liberal government, which pursued an expansionary strategy. Annual immigration targets and admission levels increased – save for the 2020 pandemic year – leading to a target of 500,000 for 2025. However, this target will no longer be realized following the revised plan announced at the end of 2024. Along with increased permanent immigration, the government had adopted a more facilitative approach to temporary migration, leading to rapid growth in the number of international students, temporary foreign workers, and other non-permanent residents. In 2023, the Canadian population expanded by 1.27 million, representing an annual growth rate of 3.2 percent, which is highly unusual among advanced economies. For example, the average population growth rate of the other G7 countries in 2023 was less than 0.5 percent (Scotiabank 2023).2

Given Canada’s low fertility, 98 percent of this growth stemmed from net immigration, both temporary and permanent (Statistics Canada 2024a). Today, Canada is approaching a point where all population growth and most of the impetus for population renewal (Dion et al. 2015) will come from immigration. However, the “big migration” trajectory of 2015 to 2024 has shifted. While public opinion historically supported ambitious immigration targets, this sentiment changed sharply in 2024. Concerns about housing shortages, infrastructure strain, and what has been termed a “population trap” – where population growth outpaces capital investment capacity – have fueled resistance to current immigration levels. These pressures clearly influenced the 2025 to 2027 plan, which curtails permanent immigration targets by approximately 20 percent and tightens restrictions on temporary migration programs.

Short- and Long-Term Immigration Policy

Before focusing on the relationship between immigration and demography, it is instructive to explore a fundamental tension in immigration policy: should the Government of Canada prioritize the “maximum social, cultural and economic benefits of immigration”3 for today or for the future? These goals may not always align: satisfying the needs of today may have long-term consequences – a trade-off familiar to anyone who has managed a budget.

It has been long underappreciated that Canada’s immigration policy is built around a combination of short- and long-term goals. Economic selection practices provide a helpful example. Since the introduction of the points system nearly 60 years ago, selection priorities have oscillated between addressing short-term labour market needs (e.g., incorporating and/or prioritizing job offers in selection criteria) and building the human capital of the future workforce, under the assumption that highly skilled individuals can adapt and drive productivity, and therefore prosperity. Striking the right balance between these priorities is challenging and requires careful planning.

The balance between short- and long-term immigration perspectives is reflected in the combination of the economic selection system and levels planning. The former – which includes permanent skilled immigration – involves trade-offs between filling immediate labour shortages and building future human capital.4 The latter determines the scale and composition of Canada’s permanent immigration system. In contrast, temporary migration programs are almost entirely shaped by short-term planning horizons – with the partial exception of the International Student Program, which operates in accordance with a medium-term planning horizon in five-year increments.5

These issues are pivotal to considerations of the relationship between immigration and demography. The impact of immigration extends beyond the number of admissions. If immigrants are selected to enhance the human capital of Canada’s workforce and integrate productively, they can potentially raise per capita GDP and mitigate the challenges of an ageing population (Erkisi 2023; Montcho et al. 2021). Conversely, if the system prioritizes lower-skilled individuals, fails to utilize the skills of highly educated immigrants, or admits newcomers at a scale that exceeds the economy’s capacity to absorb them, it risks lowering per capita GDP and compounding demographic challenges (Smith 2024).

Immigration, therefore, has both scale and compositional effects. Scale impacts include changes to population size, age structure, and regional distribution, which directly affect housing demand and social services. Compositional impacts include broader socioeconomic outcomes such as income inequality, productivity, and trade relationships. While this paper focuses on scale impacts, readers should bear these compositional effects in mind.

Another critical consideration is the relationship between admission levels and the expected economic outcome of admitted immigrants. In Canada’s Express Entry system, admission thresholds are adjusted based on the number of entries. Larger admission cohorts tend to lower the points threshold, potentially reducing the overall human capital of entrants (Mahboubi 2024).

Immigration and Canada’s Demographic Challenge

This paper argues that long-term considerations should play a larger role in immigration levels planning. Immigration decisions made today shape Canada’s demographic structure for decades, as immigrants become part of the population, contribute to fertility, enter the workforce, and eventually retire. These stages must be incorporated into demographic projections and policy planning, yet they are often overlooked due to the focus on immediate needs and political cycles.

To illustrate the long-term demographic impact of immigration, consider two extreme scenarios. In the first, Canada’s fertility rate declines to 1.0 (the 2023 rate in British Columbia) and net migration falls to zero, implying no population growth from migration. Under these conditions, Canada’s population would shrink from 40 million in 2023 to 12.3 million by 2100. In the second scenario, the extraordinary 2023 growth rate of 3.2 percent continues indefinitely, with rising migration levels. By 2100, Canada’s population would reach 452 million.

While neither of these scenarios is realistic, they illustrate the decisive influence that fertility and migration have in shaping the future scale of Canada’s population. Despite their seemingly preposterous nature, the key point remains: with fertility rates remaining low,6 the state is entirely responsible for determining the scale of the Canadian population. Decisions about temporary visas and permanent residence serve as the primary levers of control. Policymakers must recognize that the choices made today will have profound and lasting effects on Canada’s demographic and economic future.

Population Projections and Their Implications

Statistics Canada produced a recent population projection for various scenarios in January 2025, covering the period of 2024 to 2074.7 Across the scenarios, total fertility rates range from 1.13 to 1.66, permanent immigration rates vary from 0.70 to 1.2 percent per year, and net temporary migration figures are assumed to decline in the short term before stabilizing. The selected scenarios suggest that the projected population of Canada would range from 45.2 to 80.8 million in 2074 – a difference of over 35 million people, roughly equivalent to Canada’s current population. The scale of infrastructure and social investments needed to accommodate such growth would be enormous.

Beyond sheer numbers, government policy also affects the age structure of Canada’s future population. The OADR is expected to rise, and increased immigration is often proposed as a solution. However, the retirement age is, to an important extent, a social construct and this paper explores the efficiency of changing Canada’s retirement age compared with adjusting immigration levels to address the issue.

While migration can temporarily mitigate low fertility effects by maintaining a larger workforce, it cannot fully offset population ageing (Robson and Mahboubi 2018). Even doubling Canada’s population through immigration would only reduce the average age by five years, as immigrants’ average age is close to that of the receiving population (around 30 versus 40).8 Doyle et al. (2023) argue that increasing immigration could delay ageing impacts but would require continuously higher volumes, becoming unsustainable.9 Immigrants are typically concentrated in the labour force ages (25-40) but, in 30-35 years, this group will be approaching retirement, creating an economic challenge similar to the Baby Boom generation’s retirement. Unless increasing rates of immigration are in place continuously (an unrealistic scenario), at some point society must adjust to a smaller, older population.

Moreover, there appear to be additional costs to rapid population growth that are driven by high immigration. Doyle et al. (2023 and 2024) contend that when the labour force expands faster than investment in capital and infrastructure, the result is a dilution of capital per worker, reducing Canada’s productivity and living standards. This concern highlights not only the pace of immigration-driven growth but also Canada’s historically low levels of business and infrastructure investment, suggesting a need to boost investment alongside population growth.10

Research shows that while larger immigration targets increase real GDP through a larger labour supply, they could also reduce GDP per capita (El-Assal and Fields 2018).11 Indeed, in recent years of very high population growth through net international migration (2022-2023), Canada’s level of real GDP per capita has been stagnant.12

Furthermore, house price escalation associated with a surge in demand may negatively affect fertility decisions, particularly for families renting homes (Dettling and Kearney 2014; Fazio et al. 2024). In other words, compensating for low fertility through high rates of immigration may indirectly contribute to additional fertility decline.

Studies show that immigration alone has a limited impact on altering age composition (Robson and Mahboubi 2018). Even doubling immigration rates would only slightly improve the OADR (Beaujot 2001). All of the immigrants admitted by Canada between 1951 and 2001, for example, are believed to have reduced the median age of Canadians in 2001 by only 0.8 years.

The effect of younger immigrants, as seen in Australia’s approach, would improve outcomes,13 but Guillemette and Robson (2006) found that this impact would still be modest. An unintended consequence of focusing on younger immigrants is that it contrasts with Canada’s economic selection system, which rewards human capital development. Half of the 2022 Express Entry applicants were 30 or older (IRCC 2022), challenging the idea that immigration could rapidly reduce the average age of the population.14

A Custom Glimpse of the Future

To update our understanding of the role immigration could play in Canada’s demography, this section explores the results of a special population projection, using Statistics Canada’s microsimulation model called Demosim, to assess the impact of varying immigration rates on the Canadian population in the future. Two demographic outcomes are highlighted in this analysis: population size and the OADR.

While population size is a straightforward measure, the exclusive focus on the OADR – without also considering the youth dependency ratio (YDR) – may raise questions about the completeness of the analysis. After all, both young and older people place disproportionate demands on social services. One could also argue that increasing the rate of immigration (depending on the age profile of newcomers, other things being equal) could reduce the OADR while increasing the YDR. There are two major reasons for focusing on the OADR in this analysis. First, it is the most widely used indicator of the ageing population and has particularly profound impacts on the cost of healthcare, Canada’s most expensive social program.15 Second, while the YDR and OADR reflect dependency burdens, they have very different long-term implications: a high YDR represents a short-term fiscal cost but also an investment in the future workforce. In contrast, a rising OADR signals a more permanent shift in the age structure of the population, with fewer economic offsets. For these reasons, and to maintain analytical clarity and focus, the YDR has been omitted from this analysis.

Demographic variables used in the projection, except for the immigration rate, were either held constant (e.g., fertility rate at the 2023 level of 1.33 and the temporary resident population assumed to remain constant at around two million after 2021) or based on assumptions from recent Statistics Canada projections (e.g., emigration rate, life expectancy).16 Using the 2021 base population,17 projections were provided for 50 years. Six scenarios were created based on annual permanent immigration rates ranging from 0.3 percent to 1.8 percent. These correspond to immigration levels in 2025 between around 125,000 and 750,000, based on the 2024 Q4 population estimate of 41.5 million. From 2000 to 2015, the immigration rate averaged 0.6 percent per year (Scenario 2), rising to nearly 1.2 percent per year by 2024 (Scenario 4). The 2025-2027 immigration plan aligns with Scenario 3, at a rate of around 0.9 percent. In essence, the scenarios reflect both current and recent immigration rates, allowing for expansion or contraction, as shown in Table 1.

Population projections vary significantly across the scenarios (Figure 1). As Canada’s natural population growth is rapidly approaching zero and is expected to turn negative in the coming years – and with emigration remaining steady – an immigration rate of 0.3 percent of the population would result in virtually no net international migration. Under this scenario, the population would begin to decline slightly. At the same time, Canada’s OADR would more than double, rising from 29.5 retirees (65 and older) per 100 working-age individuals (18-64) to 48.2 in 2046 and 61.6 in 2071 (Figure 2).18 Such a demographic structure would be unprecedented and pose a significant challenge to economic prosperity. For context, Japan currently has the highest OADR globally, at approximately 48 per 100.19

The second scenario, reflecting Canada’s immigration levels from 2000 to 2015, would add 4.6 million to the population by 2046 and another two million by 2071. The OADR would rise to 44.5 by 2046 and 55.8 in 2071. The third scenario most closely aligns with the 2025 to 2027 immigration plan (though it excludes the projected reduction in temporary residents). If immigration remains at 0.9 percent of the population for the next 50 years, the national population would reach 55.6 million in 2071, and the OADR would be 50.8. The fourth scenario extends the higher 1.2 percent immigration rate from 2024, projecting a population of 67.2 million by 2071. Despite this growth, the OADR would still rise to 46.5 by 2071 – similar to Japan’s current level. Reducing the immigration target from 1.2 percent to 0.9 percent in the 2025-27 plan would result in 11.6 million fewer people by 2071, assuming a stable rate. The sixth scenario, though ambitious, is instructive. If IRCC raised the permanent immigration target to 1.8 percent annually and maintained it for 50 years, Canada’s population would increase to nearly 62 million by 2046 and exceed 91 million by 2071. Even with this growth, the OADR would still rise to 39.5 by 2071. A visual scan of the relevant figure suggests that it would take an immigration rate of around 2.7 percent per year to hold the dependency ratio constant. Moreover, it would be challenging to sustain Canada’s high-human-capital selection threshold in the Express Entry system under this scenario.

Note another important trend. Figure 1 shows that the population diverges across the six scenarios over time, demonstrating the growing efficiency of immigration rates in changing Canada’s population growth over time. In contrast, the OADRs across the scenarios in Figure 2 remain roughly parallel after 2046 and begin to converge a little in the later years, illustrating that immigration ultimately becomes less efficient at altering the age structure of the population over time. Why? A population with low fertility receiving a steady flow of younger immigrants will, in the short term, have a younger average age due to the immigrants’ youth. However, as the immigrant population ages, its average age eventually surpasses that of the receiving population, making the overall population older in the long term.20 Therefore, the effect of steady immigration on the age structure diminishes over time, and only a continuous increase in immigration would prevent this.

Further, it is also important to acknowledge that once there is a sustained period of high immigration (i.e., the case of Canada between 2015 and 2024), a dramatic reduction in the rate of immigration will result in a demographic “bulge” with a large cohort followed immediately by a smaller one – akin to the relationship between the Baby Boom and Generation X. This would ultimately set in motion the same demographic dynamic that Canada faces today, with the larger generation eventually retiring and the OADR increasing. The demographic lesson is clear: shocks in the age structure of a population – whether through dramatic increases or declines in fertility or through major changes in the rate of net migration – place stress on infrastructure and, if they are large, may challenge the long-term stability of the welfare state.

Before reflecting further on these findings, consider the impact of varied immigration rates on the cultural composition of the Canadian population (Vézina et al. 2024). In 2021, approximately 44 percent of the Canadian population had an immigrant background – either as non-permanent residents, immigrants, or individuals with at least one immigrant parent (see Table 2). Under the third scenario, which aligns with the 2025 to 2027 immigration plan, this proportion would nearly reverse by 2046 and change even more dramatically by 2071, with nearly two-thirds of all Canadians being persons with an immigrant background.21

Such a shift would redefine immigrant integration and public perceptions of multiculturalism. Whether this level of cultural change would be widely accepted remains uncertain. If the high 2024 immigration rate was sustained, nearly three-quarters of Canadians in 2071 would be either immigrants or children of immigrants.

Immigration and Other Policy Levers in Addressing Population Ageing

This section assesses how immigration compares to other policy tools in addressing the demographic challenges of an ageing population. Governments have several policy tools to either shape demography directly or mitigate societal consequences. The key concern in an ageing society is the impact of a shrinking labour force on the ability to sustain social services such as healthcare, education, and pensions. The principal direct policies are encouraging fertility and increasing immigration (Lee 2014). Governments can also address the fiscal impact of ageing by: boosting workforce participation among working-age adults; delaying retirement and enlarging the working-age population; raising tax rates; reducing expenditures – especially those related to the elderly population; and increasing the productivity of labour (Lee et al. 2014; Beaujot 2017). Some of these choices are more efficient than others. Pronatalist policies have been established in some 60 countries, yet none have been successful in restoring fertility to a replacement level (UNFPA 2019). Moreover, their effects tend to be short-lived.22

How efficient is immigration in mitigating population ageing and its effects? The data explored so far indicate that while increasing the rate of immigration is highly effective at generating population growth, it is less effective at significantly changing the age composition of the population. A recent analysis by British Columbia Ministry of Advanced Education and Skills Training provides additional depth on this issue.23 Their study presents a simple but informative labour force participation ratio: for every 10 permanent immigrants admitted to the province, six will find work relatively quickly, while the remaining four will be too young or old, pursuing education, or not immediately ready to join the labour market. This reflects the broader reality that approximately half of all economic-class immigrants are spouses and dependents and that only around 60 percent of immigrants are admitted through the economic class to begin with.

It would be tempting, but also simplistic, to see this as the direct impact of immigration on the labour force (i.e., 10 newcomers equate to six net new workers), but there is an important additional dimension that must be considered. Adding 10 people to the population generates consumer demand for goods and services including shelter, food, transportation, and many other things. Meeting this demand requires four additional workers. These four additional workers expand the scale of the economy but do not create net new workers (Fortin 2025).

When 10 newcomers are admitted, given that four will not immediately enter the labour force and another four workers will be required to satisfy extra consumer demand, only two net new workers are added. That is, to add one net new worker to the labour force requires five new permanent immigrants (and therefore approximately two additional dwellings). This is nicely summarized in a ratio: 10-6-4-2. There is no reason to expect that this ratio would be appreciably different in other provinces or Canada as a whole. Just as immigration is more efficient at increasing the size of the population than it is at changing the age structure, the same holds true for the relationship between immigration and net workers added to the labour force.

An example can help illustrate this point. Imagine an ageing society with a population of one million and 1,000 doctors. As more doctors retire than can be replaced through domestic training, the government looks to immigration to fill the gap. It estimates that 100,000 newcomers must be admitted, since only a small fraction of new immigrants will be doctors. This produces the desired effect, and the number of doctors remains stable. However, the population has grown to 1.1 million, and to preserve the same level of access to care, 1,100 doctors are now required. Simply stabilizing the labour force while adding population is an insufficient way to resolve emerging labour shortages because it ignores the additional demand created by population growth (Fortin 2025). This mirrors the earlier point: immigration adds workers, but it also adds consumers. As a result, the net gain to the labour force is much smaller than the headline number of newcomers might suggest.

It is beyond the scope of this paper to investigate the efficiency of all the other measures in mitigating the effects of ageing or increasing the size of the labour force. However, Figure 3 illustrates the demographic impact of one such lever – delaying the average retirement age to 70, compared to maintaining it at 65 – as an example to demonstrate how different policies vary in their ability to influence the OADR.

Figure 3 shows that, under this policy shift, maintaining immigration at the rate of the 2025 to 2027 plan (Scenario 3) would be sufficient to stabilize the OADR to 2046 – keeping it just below 30, similar to its level in 2021. None of the immigration scenarios alone achieve this outcome if the retirement age stays at 65. While the OADR increases over time in all scenarios, delaying retirement significantly slows both the pace and magnitude of this rise.24 However, the purpose of this example is not to propose a specific change. Instead, it highlights the relative effectiveness of this particular lever and emphasizes the need for a multifaceted strategy to address demographic challenges.

In summary, Canada’s demographic challenges stem from low fertility and the retirement of the Baby Boom generation. Immigration can delay and mitigate the effects of ageing but cannot fully counteract them without immediate and dramatic increases. As long as immigration remains within historical levels, ensuring a sufficient workforce will require a combination of immigration and complementary policies.25

Demography and Levels Planning

The policy dilemma implied by demographic realities is both straightforward and immensely complex: it is now impossible to maintain the age composition of the Canadian population while also maintaining its size without turning back the clock more than 50 years in terms of fertility. At the extremes, there are two stark policy choices: maintain the current size of the Canadian population but adjust expectations to accommodate a vastly higher OADR (approximately that of Scenario 1); or maintain the age structure of the Canadian population and plan for a vastly larger population (larger than any projected in the scenarios used in this study). The real policy choice will lie somewhere between these extremes and will require a combination of accommodations.

Table 3 summarizes more realistic options by showing the level of population increase and the different OADRs projected for 25 and 50 years forward. It compares the scenarios that most closely approximate Canada’s permanent immigration targets for the recent past – Scenario 2 (pre-2015 consensus), Scenario 4 (2024 rate), and Scenario 3 (2025 to 2027 plan). Had the Liberal government maintained the earlier rate of immigration after 2015 (that is, maintaining the 0.6 percent rate of immigration), Canada’s population would have grown by around 7.5 million by 2071, but with an OADR higher than any country today (55.8 senior citizens per 100 working-age people). By shifting to, and maintaining, a 1.2 percent annual immigration rate between 2015 and 2024, the population would grow much faster – by 29 million more people over half a century – while the OADR would be lower, at 46.5 per 100. Notice that the change in policy would lead to nearly four times the population growth compared to the reduction in the OADR, which improves by only 17 percent. Scaling back the rate of permanent immigration in 2025 to 2027 moderates both the population increase and the OADR improvement. Nevertheless, it would still yield a population growth of over 17 million in the next 50 years, with Canada’s OADR surpassing that of contemporary Japan.

Regardless of the choice being made, Canada will be both larger and older in the coming decades. This shift has significant implications and calls for strategic long-term planning. For example, the country will need to invest simultaneously in child benefits and new schools, as well as in elder care facilities. Housing demand will continue to mount unless significant changes occur in housing investment policies and outcomes. It also means investing in infrastructure to sustain key public services – such as increasing hospital capacity and expanding public transit. Without these adjustments, the quality of life for Canadians would decline. Crucially, this must occur while public finances are adjusted in light of a rising OADR (or the retirement age is raised).26 It also necessitates a continuing cultural diversification of the population through immigration and temporary migration. Ongoing and growing investments in social inclusion will be required.

The greatest challenge for government is to decide on the optimum balance between ageing and growth while securing public buy-in for immigration policies.27 All of this must occur against the backdrop of other pressing issues such as global climate change, geopolitical instability, technological change, and political polarization – not to mention the need to be mindful of the relationship between immigration, ethnocultural diversity, linguistic and religious groups, Indigenous Peoples, and other equity-seeking groups. Assiduous attention must be paid to Canada’s demographic challenge, despite these powerful intersecting concerns.

Consider financial investment, where growth is based on compounded rates of interest. One of the most common recommendations made by financial advisors is to harness the power of compounded growth by starting to invest early in one’s life. Even small amounts invested in one’s twenties can pay remarkable dividends forty years later. The same logic applies to population management; demographic choices today will have far-reaching consequences in subsequent decades. Adding four to five million to Canada’s population over the next decade cannot simply be undone at the end of that period. The same ageing pressures will remain, but with a larger population that may require even higher immigration levels. As long as fertility remains well below replacement, this issue will persist – regardless of Canada’s population size. There will always be the looming threat of population decline and its consequences.

Short and Long Policy Horizons

Population change is cumulative and difficult to reverse, making it imperative to consider the long-term implications of both temporary and permanent immigration together. This requires viewing them as components of the same system – particularly given the many pathways that allow temporary residents to transition to permanent status, and the increasing reliance on temporary residents within Canada’s permanent immigration system (Crossman et al. 2020). In recent years, temporary migration has increasingly become a kind of “down payment” to Canada’s permanent immigration system, a shift that has transformed Canada’s immigration system into a more fluid, two-step process, although this flow-through process may be interrupted given the latest levels plan (i.e., there is a large gap between the number of temporary residents in Canada and the “room” accorded to that population in the new plan). A comprehensive approach also demands that levels plans, which currently establish expectations for a three-year period, be developed with longer time horizons in mind.28 In other words, immigration levels should reflect Canada’s immediate priorities as well as its long-term goals, including the potential for future population renewal. The focus on present needs should not overshadow a forward-looking vision for the country, as current policies play a decisive role in shaping Canada’s future.29

A common point made in public discussion of Canadian immigration policy is that levels planning should pay more attention to absorptive capacity. This means aligning the number of both temporary and permanent residents with the growth of social services – notably education and healthcare – as well as housing and other infrastructure. The concept of absorptive capacity can be interpreted in passive or active terms. Under a passive approach, levels planning would be guided by the current state of social services and infrastructure including housing, which would determine the appropriate level of immigration (e.g., based on an acceptable range of physicians, housing completions, etc., per 1,000 persons). Conversely, an active approach would flip the direction of causality and establish the parameters of social spending and infrastructural investment based on population growth which, in an era of low fertility, is essentially a function of the scale of temporary and permanent immigration. In this latter situation, IRCC would play a more central role in national planning, as immigration targets would shape the long-term scale of government spending across a wide range of responsibilities. This process would be greatly facilitated by a conscious, long-term population strategy at the heart of levels planning. In such a framework, all sectors of society – government, private business, and non-profit social services – could make informed decisions to guide their investments with far more assurance of long-term patterns of demand. This would be a potent indirect benefit of a population-based approach to migration and immigration management.

There are important tradeoffs between these approaches. A passive approach may be more cautious and politically feasible in the short term, but risks underestimating long-term needs and perpetuating reactive policymaking. An active approach, by contrast, allows for proactive investment and planning – but only if there is full follow-through. If governments commit to population growth targets without ensuring that social and physical infrastructure keep pace, the result could be increased strain on housing, healthcare, and public trust.

While this paper supports an active approach, its core aim is to push for long-term thinking and to encourage an informed public conversation about the choices ahead.

Regardless of which approach is chosen, the issue of social license is key. As noted earlier, a majority of Canadians have recently come to believe that population growth generated by immigration has outstripped the development of social and physical infrastructure. In 2023, this growing perception led to a substantial shift in public support for the number of newcomers that were being admitted. The government must ensure that population growth, infrastructure capacity, and capital investment are aligned – and clearly communicated to the public. This means developing a population strategy alongside an economic strategy. These are not competing priorities, but complementary and mutually reinforcing goals.

Conclusion

Given its low fertility, Canada’s demographic and economic future would be bleak in the absence of immigration. Even under low immigration scenarios (0.3 and 0.6 percent of the population per year), Canada would enter uncharted territory with respect to its OADR. At the same time, immigration is more efficient at increasing the population size than it is at either adding net new workers to the economy or fundamentally altering the age structure of the population. Higher rates of immigration may address short-term labour shortages, provide important skills, and stimulate economic activity (a higher GDP), but their effect on prosperity (GDP per capita) depends on whether they are accompanied by robust productivity growth, capital investment, and innovation. Moreover, they present challenges to Canada’s infrastructure, particularly in housing supply and healthcare availability. Without such complementary investments, rapid population growth could lead to a population trap – where population growth outpaces investment capacity – ultimately lowering prosperity, and potentially worsening fertility rates.

Canada’s demographic future depends on policy decisions made today, which carry long-term consequences that require careful planning and adaptation. While immigration level planning includes multi-year targets and considers a range of factors, in practice it often focuses on managing short-term pressures rather than shaping a long-term population vision. With fertility rates at historic lows, Canada’s reliance on immigration for population growth is intensifying. While immigration is a relevant tool for mitigating population ageing, it cannot prevent Canada from ageing on its own. This impasse highlights the need for a comprehensive population strategy that aligns with a long-term economic strategy – recognizing that growth and economic planning are complementary, not competing, goals. The strategy must also balance population growth with the challenges of an ageing society and address social priorities, including ethnocultural diversity and inclusion, Canada’s linguistic landscape, and Indigenous reconciliation.

A sustainable path forward must integrate immigration with policies to boost workforce participation, promote productivity, incentivize capital investment, and consider measures such as delayed retirement, all while recognizing the potential social and economic trade-offs involved. Without a clear and proactive strategy, Canada risks mounting economic and social pressures. A well-managed, long-term population plan, grounded in both economic realities and social capacity, will be essential to maintaining prosperity and ensuring that growth benefits all Canadians. For The Silo, Daniel Hiebert -Emeritus Professor of Geography at the University of British Columbia.

References

Adcerà, Alicia, and Ana Ferrer. 2013. “The Fertility of Recent Immigrants to Canada.” IZA Discussion Paper Series 7289: 1-21. https://docs.iza.org/dp7289.pdf.

Banulescu-Bogdan, Natalia, Haim Malka, and Shelly Culbertson. 2021. “How we Talk about Migration: The Link between Migration Narratives, Policy and Power.” Migration Policy Institute. https://www.migrationpolicy.org/sites/default/files/publications/narratives-about-migration-2021_final.pdf.

Beaujot, Roderic. 2002. “Effect of Immigration on Demographic Structure.” PSC Discussion Papers Series 16(9): 1-34. https://ir.lib.uwo.ca/pscpapers/vol16/iss9/1.

___________. 2017. “Canada: The case for stable population with moderately low fertility and modest immigration.” Canadian Studies in Population 44(3-4): 185-190.

British Columbia. 2021. “Labour Market Outlook: 2021-2023 Forecast.” Work BC. https://www.workbc.ca/sites/default/files/BC_Labour_Market_Outlook_2021_9MB.pdf.

Commonwealth of Australia. 2023a. “Review of the Migration System.” Department of Home Affairs. https://www.homeaffairs.gov.au/reports-and-pubs/files/review-migration-system-final-report.pdf.

___________. 2023b. “Migration Strategy: Getting Migration Working for the Nation.” Department of Home Affairs. https://immi.homeaffairs.gov.au/programs-subsite/migration-strategy/Documents/migration-strategy.pdf.

Conference Board of Canada. 2021. “Aging Population Requires Immigration Backfill: Canada’s Demographic Outlook to 2045.” Conference Board of Canada. https://www.conferenceboard.ca/product/aging-population-requires-immigration-backfill-canadas-demographics-outlook-to-2045/.

Crossman, Eden, Feng Hou, and Garnett Picot. 2020. “Two-step Immigrant Selection: A Review of Benefits and Potential Challenges.” Statistics Canada. https://www150.statcan.gc.ca/n1/en/pub/11-626-x/11-626-x2020009-eng.pdf?st=etDj-pJj.

Dettling, Lisa J., and Melissa Schettini Kearney. 2014. “House prices and birth rates: The impact of the real estate market on the decision to have a baby.” Journal of Public Economics 110(c): 82-100. https://ideas.repec.org/a/eee/pubeco/v110y2014icp82-100.html.

Dion, Patrice, Éric Caron-Malenfant, Chantal Grondin, and Dominic Grenier. 2015. “Long-Term Contribution of Immigration to Population Renewal in Canada: A Simulation.” Population and Development Review 41(1): 109-126. https://doi.org/10.1111/j.1728-4457.2015.00028.x.

Doyle, Matthew, Mikal Skuterud, and Christopher Worswick. 2023. “The Economics of Canadian Immigration Levels.” Canadian Labour Economics Forum Working Paper Series 58: 1-57. https://clef.uwaterloo.ca/wp-content/uploads/2023/06/CLEF-058-2023.pdf.

Doyle, Matthew, Mikal Skuterud, and Christopher Worswick. 2024. Optimizing Immigration for Economic Growth. Commentary 662. Toronto: C.D. Howe Institute. July. https://cdhowe.org/wp-content/uploads/2024/12/Commentary_662.pdf

Dungan, Peter, Tony Fang, Morley Gunderson, and Steve Murphy. 2023. “Macroeconomic Impacts of Immigration in the Canadian Atlantic Region: An Empirical Analysis Using the Focus Model.” IZA Institute of Labor Economics 16527: 1-25. https://docs.iza.org/dp16527.pdf

El-Assal, Kareem, and Daniel Fields. 2018. “Canada 2040: No immigration versus more immigration.” Conference Board of Canada. https://www.conferenceboard.ca/product/canada-2040-no-immigration-versus-more-immigration/.

Erkisi, Kemal. 2023. “Skill-Based Immigration and Economic Growth: A Long-Term Analysis for Canada.” Review of Applied Socio-Economic Research 26(2): 35-53. https://www.researchgate.net/publication/376264530_Skill-Based_Immigration_and_Economic_Growth_A_Long-Term_Analysis_for_Canada.

Fazio, Dimas, Tarun Ramadorai, Janis Skrastins, and Bernardus Ferdinandus Nazar Van Doornik. 2024. “Housing and Fertility.” SSRN Electronic Journal. https://dx.doi.org/10.2139/ssrn.5046571.

Fortin, Pierre. 2025. The Immigration Paradox: How an Influx of Newcomers Has Led to Labour Shortages. Commentary 677. Toronto: C.D. Howe Institute. February.

Gebremariam, Woldemicael, and Roderic Beaujot. 2010. “Fertility Behavior of Immigrants in Canada: Converging Trends.” PSC Discussion Papers Series 24(5): 1-30. https://ir.lib.uwo.ca/cgi/viewcontent.cgi?article=1138&context=pscpapers.

Government of British Columbia. 2024. “Education by the Numbers.” BC Government News. https://news.gov.bc.ca/releases/2022ECC0066-001332.

Guillemette, Yvan, and William Robson. 2006. “No Elixir of Youth: Immigration Cannot Keep Canada Young.” Backgrounder. Toronto: C.D. Howe Institute. September. https://cdhowe.org/publication/no-elixir-youth-immigration-cannot-keep-canada-young/.

Hiebert, Daniel. 2016. “What’s so special about Canada: Understanding the resilience of immigration and multiculturalism.” Migration Policy Institute. https://www.migrationpolicy.org/research/whats-so-special-about-canada-understanding-resilience-immigration-and-multiculturalism.

Hooper, Kate. 2023. “What Role can Immigration Play in Addressing Current and Future Labor Shortages?” Migration Policy Institute. https://www.migrationpolicy.org/sites/default/files/publications/mpi-global-skills-labor-shortages-brief-2023_final.pdf.

Immigration, Refugees and Citizenship Canada. 2023. “Express Entry Year-End Report 2022.” Government of Canada. https://www.canada.ca/en/immigration-refugees-citizenship/corporate/publications-manuals/express-entry-year-end-report-2022.html.

___________. 2024. “2025-2027 Immigration Levels Plan.” Government of Canada. https://www.canada.ca/en/immigration-refugees-citizenship/news/2024/10/20252027-immigration-levels-plan.html.

Laplante, Benoît. 2018. “The Wellbeing of Families in Canada’s Future.” Canadian Studies in Population 45(1-2): 24-32. https://doi.org/10.25336/csp29376.

Lee, Ronald D. 2014. “Macroeconomic Consequences of Population Aging in the United States: Overview of a National Academy Report.” American Economic Review 104(5): 234-239. https://www.aeaweb.org/articles?id=10.1257/aer.104.5.234.

Lee, Ronald, et al. 2014. “Is low fertility really a problem? Population aging, dependency, and consumption.” Science 346(6206): 229-234. https://doi.org/10.1126/science.1250542.

Mahboubi, Parisa. 2024. Quality Over Quantity: How Canada’s Immigration System Can Catch Up With Its Competitors. Commentary 654. Toronto: C.D. Howe Institute. February. https://cdhowe.org/publication/quality-over-quantity-how-canadas-immigration-system-can-catch-its/.

Mahboubi, Parisa, and Tingting Zhang. 2025. 2024 Labour Market Review: Challenges, Trends, and Policy Solutions for Canada. Commentary 678. Toronto: C.D. Howe Institute. March. https://cdhowe.org/publication/2024-labour-market-review-challenges-trends-and-policy-solutions-for-canada/.

Montcho, Gilbert, Julien Navaux, Marcel Mérette, and Yves Carrière. 2021. “Comparing Public Transfers between Immigrants and Natives: A National Transfer Accounts Approach.” SSRN Electronic Journal. https://ssrn.com/abstract=3968396.

Papademetriou, Demetrios. 2016. “Maintaining Public Trust in the Governance of Migration.” Transatlantic Council on Migration. https://www.migrationpolicy.org/research/maintaining-public-trust-governance-migration.

Riddell, Craig, Christopher Worswick, and David A. Green. 2016. “How does increasing immigration affect the economy?” Policy Options. https://policyoptions.irpp.org/magazines/november-2016/how-does-increasing-immigration-affect-economy/.

Robson, William B.P., and Parisa Mahboubi. 2018. “Inflated Expectations: More Immigrants Can’t Solve Canada’s Aging Problem on Their Own.” E-Brief 274. Toronto: C.D. Howe Institute. March. https://cdhowe.org/wp-content/uploads/2024/06/March-9-e-brief_274-Web.pdf.

___________. 2024. Another Day Older and Deeper in Debt: The Fiscal Implications of Demographic Change for Ottawa and the Provinces. Commentary 665. Toronto: C.D. Howe Institute. August. https://cdhowe.org/wp-content/uploads/2024/12/Commentary_665_0.pdf.

Romaniuk, Antole. 2017. “Stationary population, immigration, social cohesion, and national identity: What are the links and the policy implications? With special attention to Canada, a demographer’s point of view.” Canadian Studies in Population 44(3-4): 165-178. https://journals.library.ualberta.ca/csp/index.php/csp/article/view/29290.

Scotiabank. 2023. “Global Week Ahead: July 28, 2023.” Scotiabank Economics. https://www.scotiabank.com/ca/en/about/economics/economics-publications/post.other-publications.global-week-ahead.july-28–2023.html.

Smith, Philip. 2024. “Accounting for the decline in Canada’s Real GDP Per Capita since Mid-2022.” International Productivity Monitor 46: 83-100. https://www.csls.ca/ipm/46/IPM_46_Smith.pdf.

Statistics Canada, 2022. “Population Projections on Immigration and Diversity for Canada and its Regions, 2016 to 2041: Overview of Projection Assumptions and Scenarios.” Demosim Team. https://www150.statcan.gc.ca/n1/pub/17-20-0001/172000012022001-eng.htm.

___________. 2023. “Immigrant status and period of immigration by gender and age: Census metropolitan areas and census agglomerations.” Table: 98-10-0347-02. https://www150.statcan.gc.ca/t1/tbl1/en/tv.action?pid=9810034702.

___________. 2024a. “Population Estimates, Fourth Quarter 2023.” The Daily. https://www150.statcan.gc.ca/n1/daily-quotidien/240327/dq240327c-eng.htm.

___________. 2024b. “Population Projections for Canada, Provinces and Territories, 2024-2074.” The Daily. https://www150.statcan.gc.ca/n1/en/daily-quotidien/250121/dq250121c-eng.pdf?st=y_1MGKz0.

United Nations Population Fund (UNFPA). 2019. “Policy Responses to Low Fertility: How Effective are They?” Working Paper Number 1. https://www.unfpa.org/sites/default/files/pub-pdf/Policy_responses_low_fertility_UNFPA_WP_Final_corrections_7Feb2020_CLEAN.pdf.

Vézina, Samuelk, Jean-Dominique Morency, Laurent Martel, and François Pelletier. 2024. “Canadian labour force: What will happen once baby boomers retire?” Statistics Canada. https://publications.gc.ca/collections/collection_2024/statcan/75-006-x/75-006-2024-5-eng.pdf.

World Bank Group. 2025. “Population Growth (Annual Percentage).” World Bank Group Data. https://data.worldbank.org/indicator/SP.POP.GROW.

World Population Review. 2024. “Age Dependency Ratio by Country 2025.” World Population Review. https://worldpopulationreview.com/country-rankings/age-dependency-ratio-by-country.

Zhang, Haozhen, Jianwei Zhong, and Cédric de Chardon. 2020. “Immigrants’ net direct fiscal contribution: How does it change over their lifetime?” Canadian Journal of Economics/Revue canadienne d’économique 53(4): 1642-1662. https://doi.org/10.1111/caje.12477.