
The K-Shaped Divide in Canadian Household Savings
Canadians going into more debt
The trend of Canadians going into more debt is a significant concern, driven by rising living costs and financial obligations such as mortgages, student loans, and consumer debt. Recent statistics reveal that total household debt in Canada surpassed $3 billion in September 2024, with the average Canadian now carrying approximately $41,500 in household debt, excluding mortgages. This trend has been steadily rising for years,
Money.ca
Debt to Income Ratio
This ratio reached 173.08% in 2021. Secured debt, such as mortgages or car loans, is a major contributor to household debt, while unsecured debt, including credit cards, relies on the borrower’s creditworthiness.
The cost of living is catching up to a large chunk of Canadians, with almost one in four taking on new debt in the last year. The Financial Consumer Agency of Canada found that more than half of Canadians are struggling to pay bills, and the OSB reported that 4.2 out of every 1,000 adult Canadians filed for insolvency in 2024, the highest rate since 2019. This accumulation of debt is attributed to spending consistently outstripping income for some time now.
Global News
To manage debt, Canadians are advised to consider debt consolidation, a debt management plan, or a consumer proposal. These options can help reduce the amount paid if the interest rates and terms of a consolidation loan from a bank are better than those of the individual creditors.
Canada’s household saving picture is splitting in two. Since 2021, the top fifth has lifted its average net saving to over $75,000 a year, while the lowest has sunk deeper into dissaving, spending nearly $39,000 more than its disposable income. The middle and second fifths have also slipped further into the red. Higher earners are pulling away as lower earners draw down savings and borrow to keep spending. For more on the health of Canada’s economy, see this C.D. Howe Institute memo.
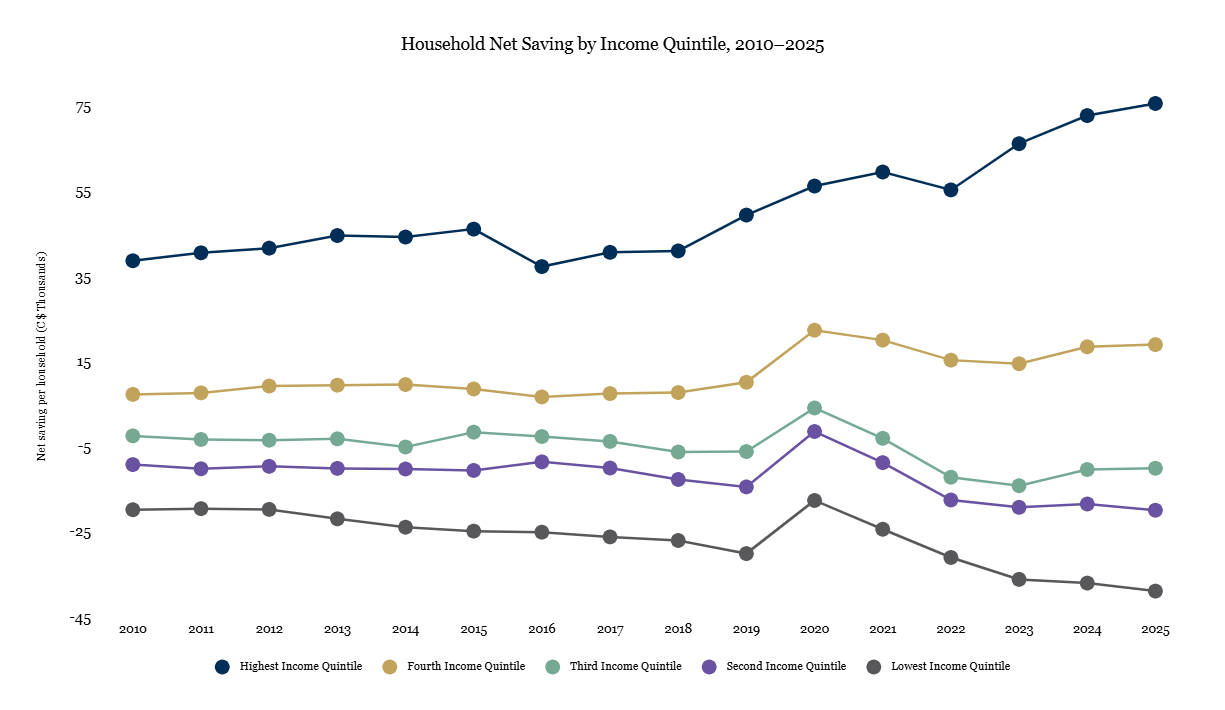
Note: Negative values denote dissaving (consumption exceeds disposable income). Quintiles averaged the following income: Lowest quintile $33,000, second quintile $62,000, third quintile $88,000, fourth quintile $120,000, fifth quintile $219,000.
Source: Statistics Canada, Distributions of Household Economic Accounts (Table 36-10-0587-01). Figures are average net saving per household.